







A weather station dashboard shows 12.0 m/s while its archive shows 4.2 m/s at the same displayed time. That difference could be legitimate: one number might represent a short gust and the other a longer average. It could also expose a mapping error or an old value being presented as current. The timestamp alone cannot settle the question.
Before replacing an anemometer, trace what each number means. Identify the sensor, reported statistic, interval and observation time at each stage. This guide follows that troubleshooting task, rather than choosing a station or designing its installation.
First check whether the reports describe the same measurement
Save the conflicting dashboard view and export, including time zones and channel names. Note whether the discrepancy persists in steady weather, occurs around gusts, or appears only after a communications interruption. Those patterns help decide which part of the data path to inspect first.
Then check the actual instrument list. A product described as five-in-one does not necessarily measure wind. The NiuBoL NBL-W-THPLC integrated sensor measures temperature, relative humidity, pressure, illuminance and CO2. Wind requires a different sensing configuration. Do not assign a dashboard wind tile to that head merely because both carry a weather-station label.
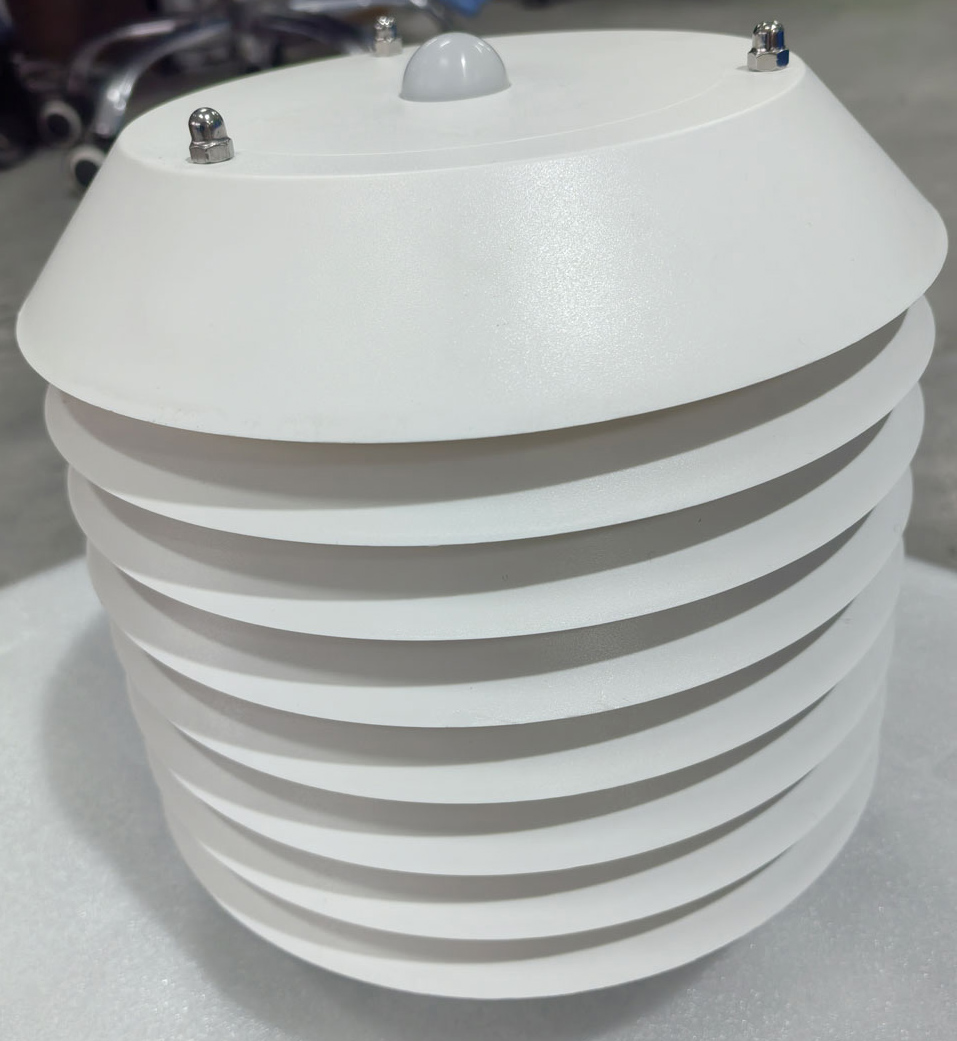
Actual shielded ambient sensing head shown; it is not the wind sensor in the calculation or a complete weather station.
For two wind values, establish whether each is an individual output, an arithmetic mean of speed, or a maximum of short-duration means. For direction, establish whether the software uses a circular or vector calculation. Matching units do not establish matching quantities.
Separate the intervals often called the update rate
Ask the integrator to describe the following settings separately. A single answer such as "updates every minute" leaves most of the measurement definition unresolved.
| Setting | What to establish | What it does not prove |
|---|---|---|
| Acquisition and filtering | What the instrument measures and filters internally | That each bus request produces a new measurement |
| Output refresh | When a register or output changes | That the value is unaveraged |
| Logger polling | When the receiver asks for data | The sensor's acquisition time |
| Averaging and gust processing | Window length, statistic and gust search period | That every model provides these calculations natively |
| Record and upload intervals | When data is saved and transmitted | That arrival equals observation time |
A three-second gust calculation needs a definition: for example, the largest three-second running mean within a specified reporting period. A two-minute scalar mean answers a different question. Neither setting should be attributed to a NiuBoL model without its documentation or a demonstrated receiver configuration.
Ask how startup and missing samples affect the calculation. A partly filled window, zero substitution and repeated old readings can produce different results from the same valid observations. Record the accepted rule rather than treating missing data as calm wind.
One defined record explains 12.0 versus 4.2 m/s
This is an illustrative calculation based on assumed site values, not a measured field record or a NiuBoL output specification.
Input: Assume 120 equally spaced, valid speed samples at one-second intervals. There are 117 readings of 4.0 m/s and three consecutive readings of 12.0 m/s. Define the short statistic as the maximum mean of three consecutive samples within this record; define the long statistic as the mean of all 120 samples.
Formula: Short maximum = (12 + 12 + 12) / 3. Long mean = (117 × 4 + 3 × 12) / 120.
Result: The short maximum is 12.0 m/s and the long mean is 4.2 m/s. The same input record produces both numbers without a calibration error.
Boundary: This works because the samples, windows and statistics are defined. It does not reconstruct a real gust from sparse archives or establish adequate sensor response. A lower sampling rate can miss a brief event, but it does not necessarily underestimate every event. Sampling phase, event duration and upstream processing matter. Discarded fluctuations cannot be recovered by changing the chart interval.
A Modbus reply time is not a measurement timestamp
Serial requests arrive at different moments, but the instrument may return measurements captured earlier. It might maintain a shared internal snapshot, update registers independently, or expose a sequence counter. Read the delivered register documentation before deciding which behavior applies.
Reading a contiguous register block can reduce communications overhead. It does not, on its own, guarantee simultaneous acquisition. Conversely, sequential replies do not prove sequential measurements. A packet capture establishes request and response timing; acquisition timing needs documentation, device timestamps or an appropriate test.
For each channel, retain acquisition time if available and record whether the logger timestamp means polling time, record creation or interval end. If acquisition time is unavailable, label the known time honestly and document the unresolved data age. Do not invent a snapshot flag the instrument does not supply.
The TG462/TG462S acquisition gateway provides interfaces for compatible field instruments. Its interface list does not establish a particular gust algorithm, simultaneous sampling or raw high-rate storage. Confirm those functions for the proposed configuration.

An acquisition component, not a complete weather station or proof of a particular averaging algorithm.
Use the disagreement pattern to choose the next test
| Observed pattern | Check next | Useful evidence |
|---|---|---|
| Difference mainly during gusts | Statistic, averaging and gust search period | One shared input sequence processed both ways |
| Constant scale difference | Units and register scaling | Raw value and decoded engineering value |
| One trace freezes during an outage | Retained values and freshness | Last valid observation time and fault status |
| Similar curves shifted in time | Time zone, interval labels and clock | Clock offsets and window boundaries |
| Rain totals differ near midnight | Reporting day, resets and delayed uploads | Counter history or tip events across the boundary |
An apparent clock shift can come from marking one average at its start and another at its end. Check that convention before adjusting a clock. Synchronizing devices does not remove different averaging windows or sensor response times.
During delayed uploads, preserve observation time separately from receipt time. For rainfall, even a small offset can move an event across the reporting-day boundary. There is no universal minimum drift or number of days before this becomes possible. Check the clock and counter reset convention.
Close the fault with a matched comparison
Choose an overlapping period and compare the same physical channel, units, statistic and interval boundaries. Capture sensor messages, logger values and platform output together where possible. Include steady weather, changing conditions and a controlled communications interruption under the project's test procedure.
Agree acceptance criteria first. Exact reproduction may be possible when two software paths process identical inputs; comparing separate instruments needs an uncertainty allowance and comparable exposure. A polling-span percentage is not a measurement-error limit.
Keep configuration revisions, firmware identities, clock offsets and missing-data behavior with the result. If the diagnosis needs samples never retained, state that limitation and arrange suitable acquisition for the next trial. For thresholds and relay faults, use the separate wind speed alarm guide; this comparison does not authorize machinery protection settings.
Questions about conflicting station readings
Q1. Can a gust and a mean both be correct at one displayed time?
Yes, when they represent different defined statistics over stated periods. Check those definitions before accepting the difference. A shared timestamp does not prove either value is correct or that they describe the same interval.
Q2. Will polling faster recover a missing gust?
Only if the instrument exposes suitable information and the receiver retains and processes it correctly. Faster requests cannot recover variations removed by internal averaging or absent from the available output.
Q3. Does one Modbus block read make all channels simultaneous?
Not necessarily. Grouped register access does not define acquisition and register-update behavior. Look for documented timestamps, sequencing or snapshot behavior rather than inferring it from packet length.
Q4. Why does a dashboard show a plausible value after disconnection?
It may retain the last valid reading. Inspect observation age and validity separately from the number. Test the configured timeout so an old reading is not silently treated as new.
Q5. Can I average archived averages to match another report?
Only when the intervals, weighting and valid sample coverage support that operation. Unequal or incomplete intervals need appropriate weighting. Stored means cannot reconstruct a short gust that was never retained.
Q6. What should I send when requesting troubleshooting help?
Send the sensor or logger identity, conflicting records with timestamps, and available averaging settings. A label photo and short export are enough to begin checking the measurement and acquisition configuration.
Compare definitions before replacing hardware
A useful diagnosis ends with a reproducible comparison, not a smaller-looking gap between charts. Establish channel identity, statistic, interval, observation time and validity first. Then determine whether the remaining difference belongs to processing, communications or the measurement itself.
Send your sensor or logger model, two conflicting records, and the statistic you need. NiuBoL can help check sensor and acquisition-interface compatibility and quote suitable monitoring components where a hardware change is needed.









