

— Case —
—Products—
 Consumer hotline +8618073152920
 WhatsApp:+8615367865107
Address:Room 102, District D, Houhu Industrial Park, Yuelu District, Changsha City, Hunan Province, China
Time:2026-08-29 15:29:52 Popularity:321
NiuBoL supplied three photovoltaic weather station systems for a rooftop solar monitoring project in Bangladesh. The stations were installed near PV arrays so the project team could record the weather variables that influence module temperature, solar irradiance and operating conditions: wind speed, wind direction, air temperature, humidity, pressure, rainfall, solar radiation and PV module temperature.
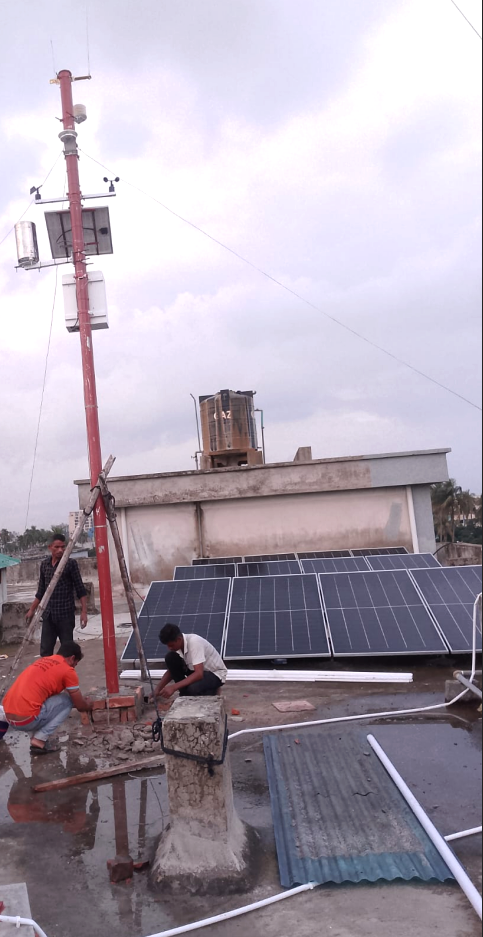
For a PV project, a weather station is not a decorative accessory. It is the environmental data layer of the monitoring system. When inverter output changes, the operator needs local evidence to separate weather-driven variation from module soiling, thermal loss, shading, wiring issues or equipment faults. The value of the station depends on sensor placement, stable data acquisition and a communication path that the owner or integrator can maintain.
The Bangladesh project used a separated sensor architecture rather than a single compact sensor. The configuration includes the NBL-W-SS wind speed sensor, NBL-W-DS wind direction sensor, NBL-W-LBTH atmospheric temperature, humidity and pressure sensor, NBL-W-RS tipping bucket rain gauge, NBL-W-HPRS pyranometer, NBL-W-PPT-100 PV module temperature sensor and NBL-D-PH-1 data logger.
| Component | Function in the PV weather station | Engineering value for the project |
|---|---|---|
| NBL-W-SS wind speed sensor | Measures local wind speed around the rooftop PV array. | Supports wind exposure review, structural awareness and analysis of convective module cooling. |
| NBL-W-DS wind direction sensor | Records the incoming wind direction. | Helps interpret local rooftop turbulence caused by walls, tanks and nearby structures. |
| NBL-W-LBTH atmospheric sensor | Measures air temperature, relative humidity and barometric pressure. | Provides baseline weather variables for PV performance records and outdoor equipment condition review. |
| NBL-W-RS tipping bucket rain gauge | Records rainfall events and rainfall amount. | Supports rainy-season operation analysis, drainage review and maintenance scheduling after heavy rainfall. |
| NBL-W-HPRS pyranometer | Measures global solar radiation in W/m². | Creates the key reference variable for comparing solar resource and PV output. |
| NBL-W-PPT-100 PV module temperature sensor | Measures module surface or backsheet temperature. | Helps distinguish air temperature from the actual thermal condition of the PV module. |
| NBL-D-PH-1 data logger | Collects, records and forwards sensor data. | Turns separate sensor signals into usable station data for display, storage or platform integration. |
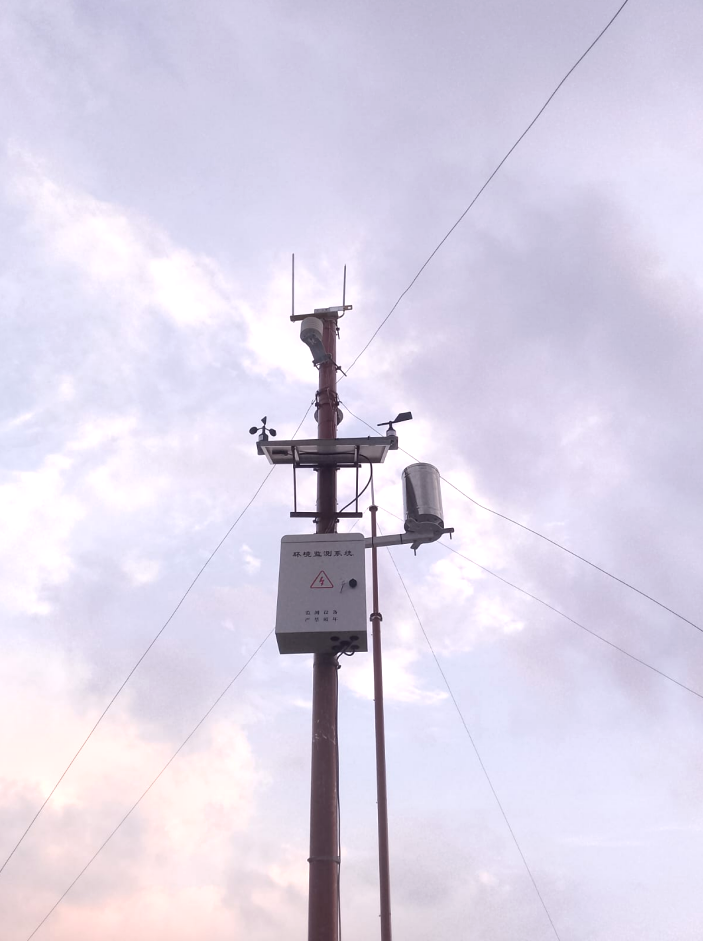
The station sits at the front end of the PV monitoring architecture. Sensors collect site variables, the NBL-D-PH-1 data logger receives the signals, and the data can then be displayed locally or transferred to a monitoring platform according to the project interface. This structure gives the owner a time-aligned weather record instead of relying only on regional forecasts or occasional manual readings.
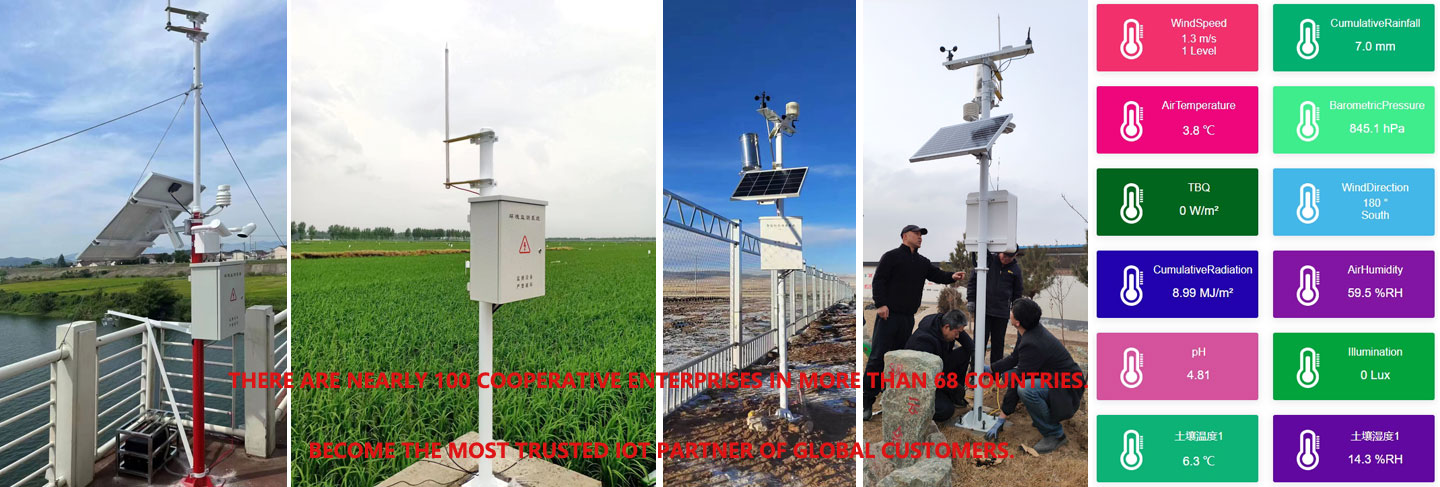
The rooftop installation photos show the station located close to the PV array. That is important because rooftop microclimate can differ from ground-level weather. Air movement, reflected heat, building surfaces and partial shading can change local measurement conditions. During final acceptance, the installer should record sensor height, orientation, horizontal leveling, cable routing, grounding and any possible shading near the pyranometer.
NiuBoL weather sensors can be selected with project-oriented outputs such as RS485, Modbus RTU, pulse or analog signals depending on the model and order configuration. For PV monitoring systems, RS485 / Modbus RTU is commonly used because it can connect to data loggers, RTUs, PLCs or third-party monitoring software. Each sensor on an RS485 bus should have a unique address, consistent baud rate and documented register mapping.
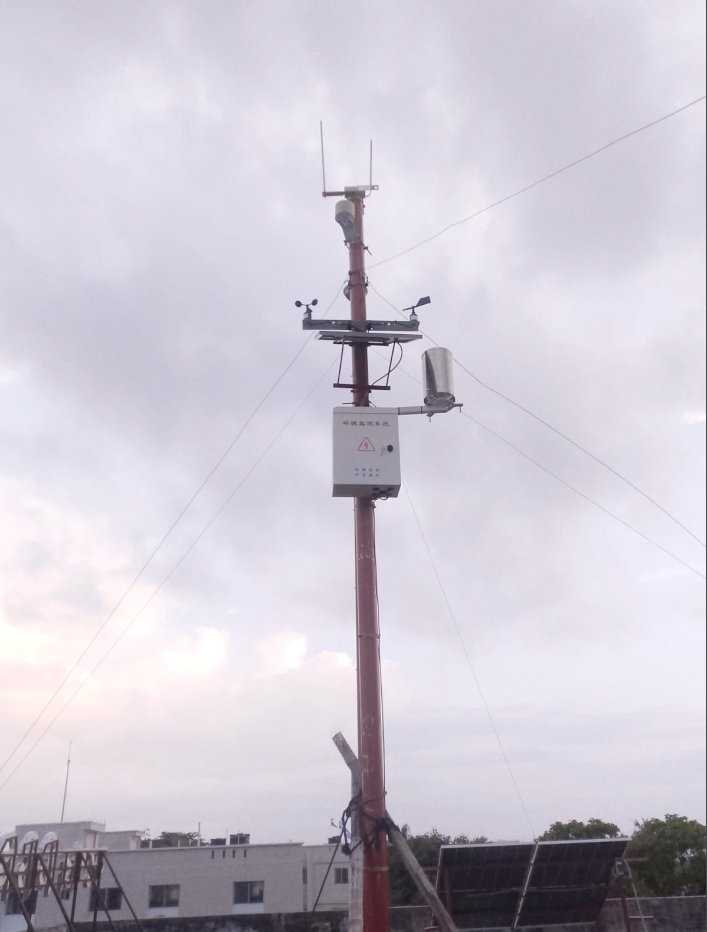
Many field problems come from installation details rather than from the sensing principle. Loose terminals, reversed A/B wiring, duplicated addresses, water entering a gland, poor shielding or unclear platform units can make good sensors appear unstable. The commissioning process should therefore read each sensor locally first, confirm values against site conditions, then connect the complete station to the upper monitoring system.
Solar radiation provides the reference for how much sunlight is available. Module temperature explains part of the difference between available radiation and electrical output. Wind speed and direction help interpret cooling and rooftop exposure. Temperature, humidity and pressure provide the basic weather context. Rainfall shows when cleaning, cooling or drainage-related events may affect performance records.
This combined dataset allows a project team to ask better operational questions. If radiation is strong but output is lower than expected, the team can check module temperature, soiling history and inverter data. If output drops during a rain event, the team can separate environmental change from equipment alarms. If module temperature rises unusually under moderate radiation, mounting ventilation or localized heat retention may need inspection.
Keep the pyranometer level and free from mast, cable or building shade during key solar hours.
Mount the PV module temperature sensor with stable contact on the selected module surface or backsheet.
Install wind sensors away from avoidable rooftop obstruction and record the wind direction reference.
Level the tipping bucket rain gauge and keep it away from splash zones and roof drainage disturbances.
Check enclosure sealing, cable glands, grounding and strain relief before long-term operation.
Verify every channel in the data logger with clear names, units and timestamps.
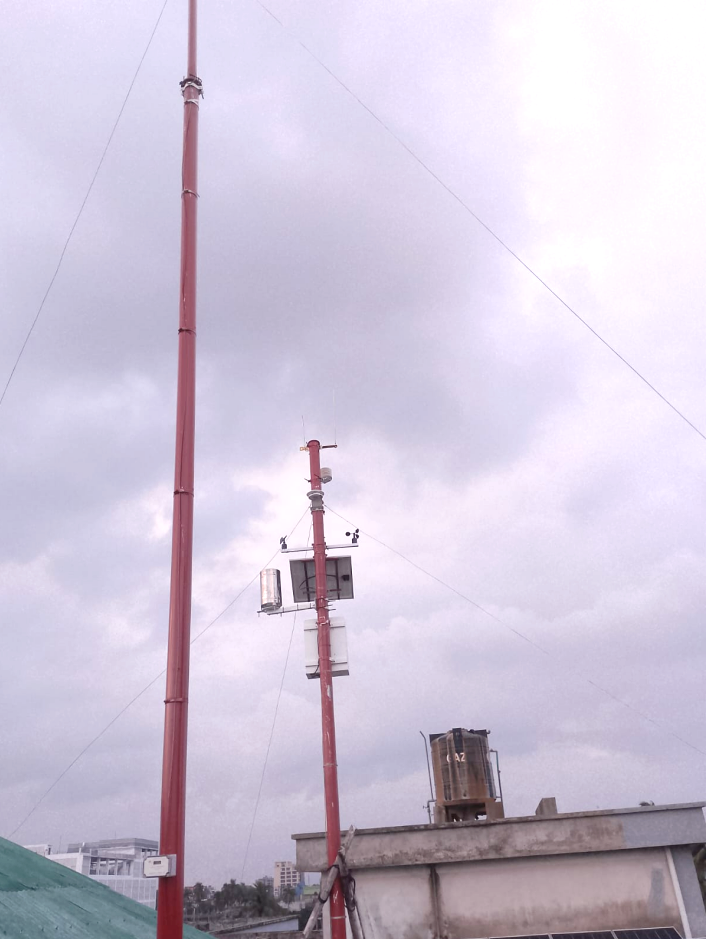
The Bangladesh PV weather station project shows how a solar monitoring system benefits from local environmental data. By combining wind, atmospheric, rainfall, solar radiation, module temperature and data logging modules, the station gives the project team a clearer basis for performance review and maintenance decisions. For similar PV projects, the RFQ should define sensor list, output protocol, power supply, mounting structure, cable length, platform interface and acceptance records before installation begins.
Prev:Weather Station and Soil Sensors Successfully Deployed in Cambodia
Next:NiuBoL 10-Meter Research Weather Station Installed in Tanzania
Related recommendations
Sensors & Weather Stations Catalog
 Agriculture Sensors and Weather Stations Catalog-NiuBoL.pdf
Weather Stations Catalog-NiuBoL.pdf
Agriculture Sensors Catalog-NiuBoL.pdf
Water Quality Sensor Catalog-NiuBoL.pdf
Related products
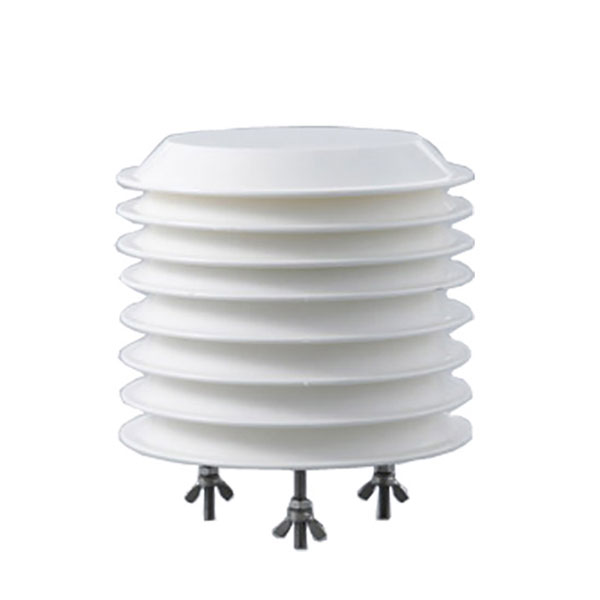 Combined air temperature and relative humidity sensor
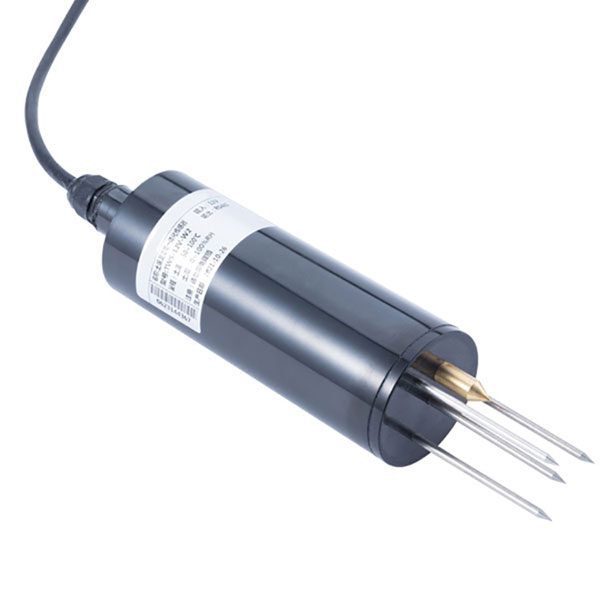 TDR Soil Moisture & Temperature Sensor for irrigation| RS485 |4-20mA| NBL-S-THR
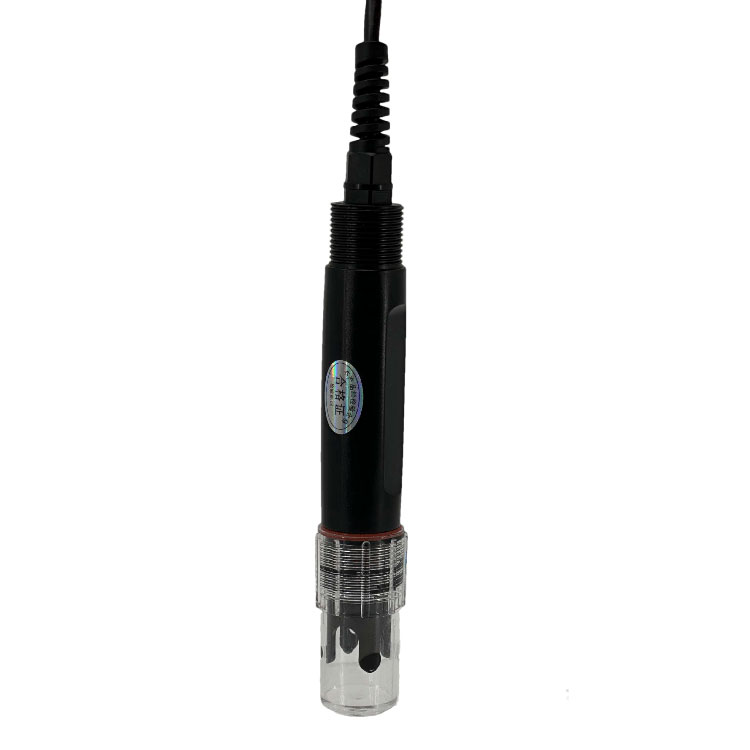 Soil pH sensor RS485 soil Testing instrument soil ph meter for agriculture |NBL-S-PH
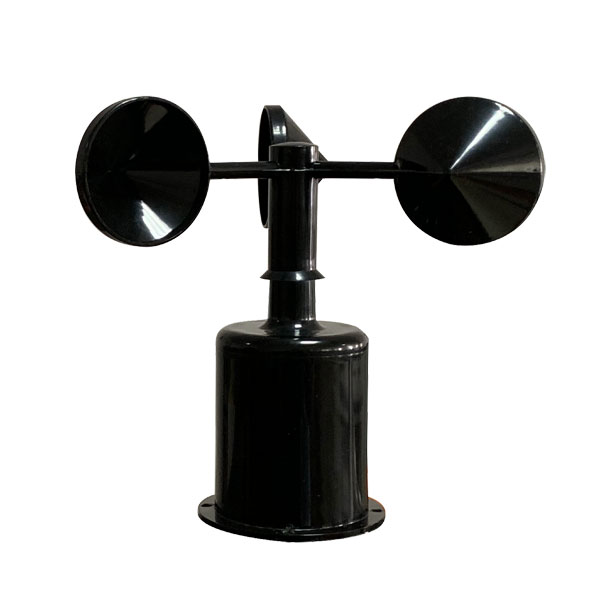 Wind Speed sensor Output Modbus/RS485/Analog/0-5V/4-20mA
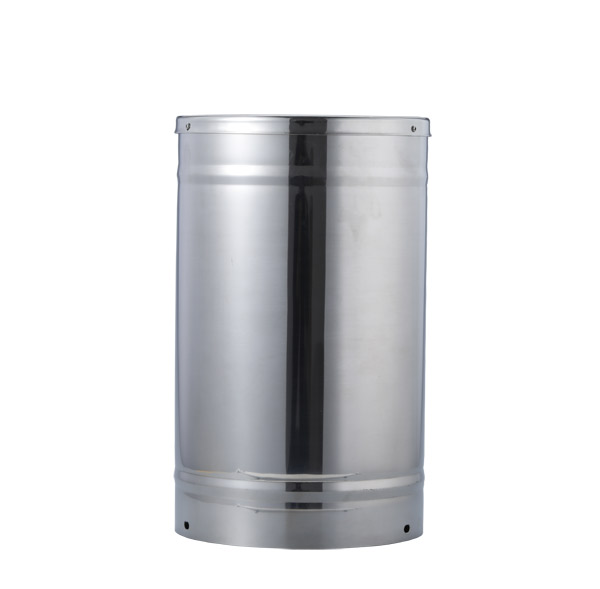 Tipping bucket rain gauge for weather monitoring auto rainfall sensor RS485/Outdoor/stainless steel
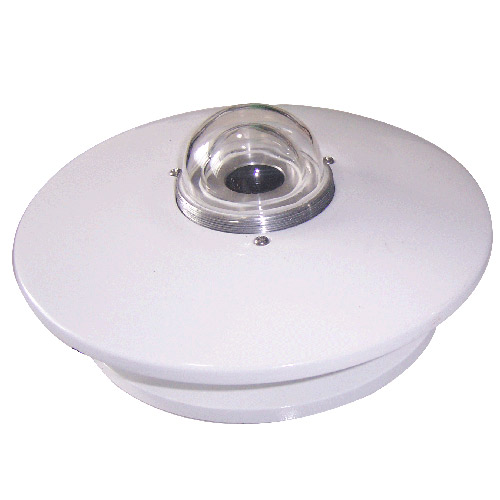 Pyranometer Solar Radiation Sensor 4-20mA/RS485
Screenshot, WhatsApp to identify the QR code
WhatsApp number:+8615367865107
(Click on WhatsApp to copy and add friends)