

— Blogs —
—Products—
 Consumer hotline +8618073152920
WhatsApp:+8615367865107
Address:Room 102, District D, Houhu Industrial Park, Yuelu District, Changsha City, Hunan Province, China
Product knowledge
Time:2021-12-27 20:08:56 Popularity:2328
Quick Answer: Wireless communication distance is improved by correcting antenna location, reducing avoidable cable loss and interference, and choosing radio settings that suit the required delivery performance. A quoted open-field distance is not a guaranteed site result. Establish a baseline, change one factor at a time and measure whether complete, timely records reach the receiving application.
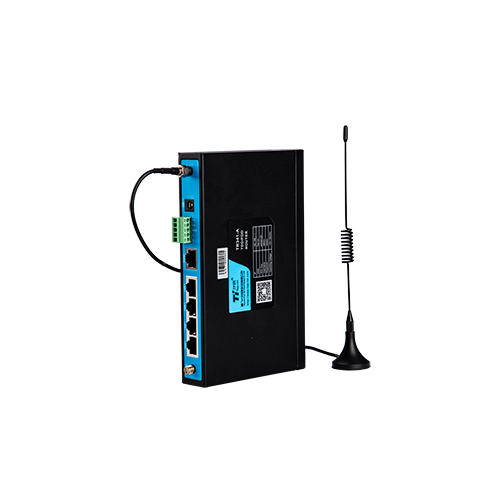
A wireless module does not have one fixed operating distance. The usable range is the distance at which the receiver still obtains an adequate signal-to-noise ratio with an acceptable packet error rate. Buildings, metal enclosures, terrain, vegetation, antenna height, cable loss, local radio traffic and the selected modulation all change that margin.
For industrial sensor projects, define the required update interval and permitted data loss before choosing the radio. A soil monitoring node sending a short record every 15 minutes has a different link requirement from a camera, a moving machine or a controller that needs low-latency commands.
Limited industrial wireless range is only one reason for a missing platform value. Trace the sensor radio link: check whether the sensor was read locally, whether a record was created and whether the receiver or server accepted it. A wrong Modbus register, expired service profile or rejected payload can look like poor reception on the final dashboard.
For remote environmental monitoring, log the failure time alongside local records and communications status. If local measurements continue normally but upload fails, investigate the network path. If the logger itself resets during transmission, investigate power before buying a higher-gain antenna.
Inspect the final installation, not just the radio on a workbench. A metal cabinet, a nearby wall or a low position among wet foliage can change antenna performance. Test with the cabinet closed, equipment powered and cables routed as intended. An apparently successful test with an open door can conceal the actual installed problem.
Keep the antenna suited to the frequency and connection. A connector that fits mechanically does not establish the correct impedance, antenna type or band. Check feed-line condition, adapters, outdoor sealing and the strain on the connector. Moving an antenna outside a cabinet can help only if the resulting cable and mounting arrangement are suitable.
Directional antennas can improve a fixed point-to-point path, but alignment becomes more critical and the coverage area narrows. An omnidirectional antenna is usually more appropriate when multiple sensor nodes surround one gateway. Antenna gain must also comply with local effective-radiated-power limits.
Raise antennas where a safe, approved mounting arrangement permits, then measure the result. Height alone is not a universal cure: terrain, reflections and the geometry of both ends still matter. Do not improvise mast extensions without checking mechanical loading, access and the site's electrical protection design.
A practical receive-power estimate is transmitter output plus transmitting and receiving antenna gains, minus feed-line, connector and propagation losses. Compare the result with receiver sensitivity at the selected modulation and data rate. The difference is the estimated link margin, not a guarantee that every packet will arrive.
As an illustrative private-radio calculation, assume 14 dBm output, 2 dBi gain at each end, 1 dB loss at each feed and 105 dB path loss. Estimated received power is 14 + 2 + 2 - 1 - 1 - 105 = -89 dBm. With an assumed -109 dBm sensitivity, the estimated margin is 20 dB. These are assumed design values, not NiuBoL specifications or permission to transmit at that power in a particular country.
Adding a feed line with 6 dB more loss reduces that estimated margin to 14 dB. That is why a longer cable can cancel the benefit of moving an antenna to a better position. Compare the complete arrangement, not the antenna gain printed on its label.
| Quantity | Unit or condition | Use in a field assessment |
|---|---|---|
| Transmitter output | dBm at the radio port | Use the configured, permitted setting rather than an unrelated maximum. |
| Antenna gain | dBi with a radiation pattern | Evaluate gain in the intended direction and polarization. |
| Feed-line loss | dB at the operating frequency | Include cable length, connectors and adapters. |
| Receiver sensitivity | dBm at a stated rate and error criterion | Compare settings on the same test basis. |
| Observed delivery | Valid records and delay over a defined period | Check the performance the operating application actually needs. |
A visually clear path may still suffer from nearby obstructions and ground reflections. Check the path around the line of sight, not only whether one antenna can be seen from the other. The NIST guide to industrial wireless deployment provides a framework for assessing the installation and its operating requirements.
A lower data rate can improve receiver sensitivity in a supported radio mode, but it also increases transmission time. Evaluate the actual payload, number of nodes and required reporting cycle. A setting that helps one distant node may leave insufficient capacity when many nodes share the channel.
Increasing retries can improve eventual delivery while concealing a weak link and using more energy or airtime. Keep retry counts and delivery delay in the test record. If a message arrives only after several attempts, it may be useful for historical logging but unsuitable for the intended alarm response.
For a private radio, supported channel and modulation settings may be controlled by the system owner within applicable rules. For cellular equipment, many radio choices are managed by the operator and modem. Do not treat a cellular RTU as though it has the same user-adjustable frequency and relay arrangement as a private sensor radio.
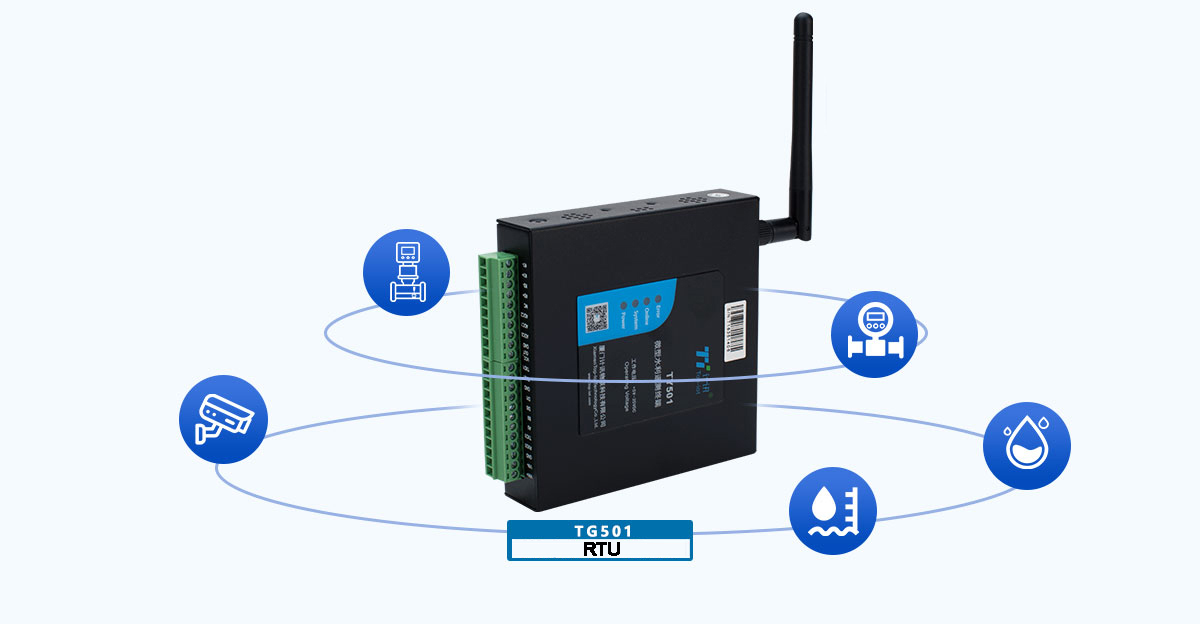
An RS485 / Modbus RTU sensor can feed a nearby logger or RTU, with selected records forwarded through cellular, Ethernet or another supported network. A problem in the field bus is not corrected by increasing radio power. Test local acquisition first, then the upstream link.
NiuBoL industrial cellular routers and RTU options serve different acquisition and transport requirements. Select the device that can read or carry the required information. A cellular router is not automatically a LoRaWAN gateway, and a telemetry RTU is not automatically a repeater for another radio protocol.
Where the link must cross a difficult obstruction, assess a new endpoint location, a supported relay architecture or a wired connection. A repeater only helps when the actual protocol supports the arrangement and both resulting paths are viable. It also introduces another power, maintenance and failure point.
For example, if 288 records are expected in a day and 279 arrive validly within the agreed time, timely delivery is 279/288 = 96.875%. If six more arrive after the deadline, eventual completeness becomes 285/288, about 98.96%. This illustrative test shows why eventual completeness and timely delivery must not be reported as the same result.
Neither percentage is a universal acceptance threshold. Agree on the requirement for the actual monitoring duty. Also examine the longest continuous gap: scattered losses and a single prolonged outage can have different consequences even when the daily percentage is identical.
Check both directions where the application needs acknowledgments or commands. A successful uplink does not prove a reliable return path, especially when the endpoints have different antennas, supply arrangements or transmit capabilities.
If failures coincide with a motor, welder or another transmitter operating, compare the timestamps before changing hardware. If the link deteriorates after vegetation growth, inspect the path and mounting. If it fails during cold or low-solar periods, check battery condition and voltage at the radio under load.
Do not assume that a strong signal indicator proves a clean link. Interference can prevent decoding despite substantial received power. Conversely, a weak signal with consistent valid delivery may be adequate for one duty but leave little margin for future obstruction. Use the available indicators with end-to-end records.
For quotation or support, give NiuBoL the endpoints, distance, terrain, country, actual device models, antenna and cable details, power source, payload and observed failure pattern. Include before-and-after test results. This evidence is more useful than a request for a module with a larger advertised distance.
No. Gain changes the radiation pattern, and the desired endpoint may lie outside its strongest direction. Cable loss, alignment, polarization and the permitted antenna arrangement still need checking.
Not as a guarantee. Buildings, metal equipment and interference change the propagation environment. Use comparable test conditions for product comparisons and verify the actual site.
Check antenna installation, feed losses, power stability and the failed stage first. Any change to radio power or antenna arrangement must remain within the equipment authorization and destination-country requirements.
It can increase airtime and reduce shared capacity. Evaluate the number of nodes, payload size and response window rather than selecting the slowest mode by default.
No. It needs the required local interface or an appropriate intermediary. Cellular connectivity does not imply compatibility with every radio modulation or network protocol.
Repeat the same payload and reporting test in the final installation. Compare timely delivery, eventual completeness, longest gap and retries, and include relevant operating or environmental conditions.
Wireless communication distance is a result of the installed path, equipment settings and required delivery performance. Diagnose the failing stage, correct measurable losses and verify the result with repeatable records. Change hardware only after the evidence shows which part of the link needs improvement.
Related recommendations
Sensors & Weather Stations Catalog
 Agriculture Sensors and Weather Stations Catalog-NiuBoL.pdf
Weather Stations Catalog-NiuBoL.pdf
Agriculture Sensors Catalog-NiuBoL.pdf
Water Quality Sensor Catalog-NiuBoL.pdf
Related products
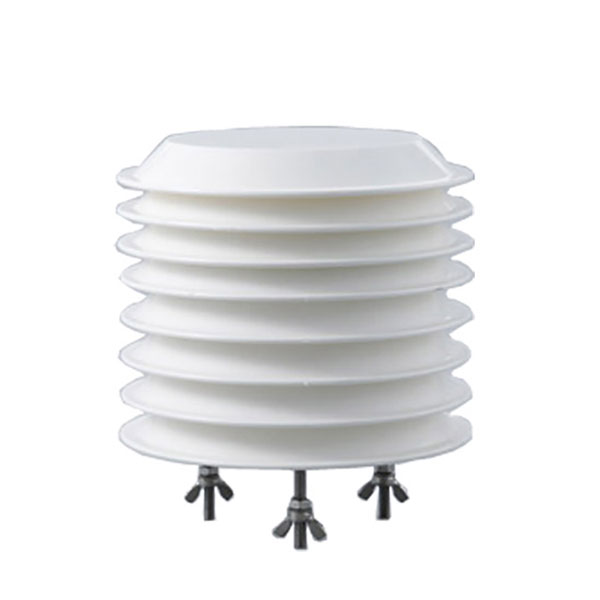 Combined air temperature and relative humidity sensor
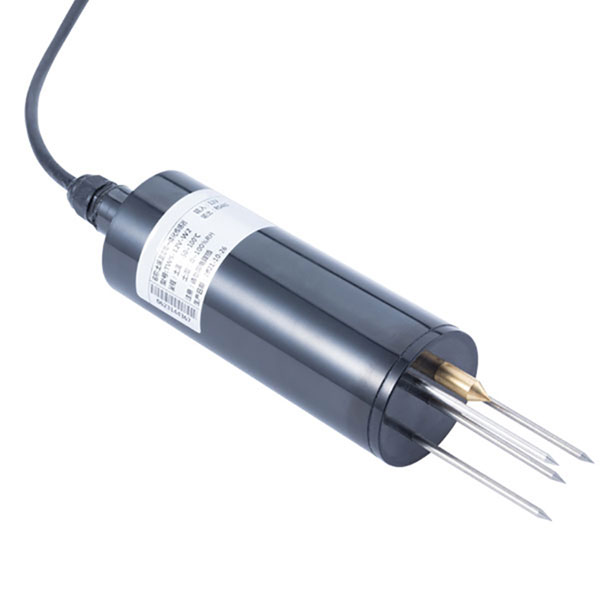 TDR Soil Moisture & Temperature Sensor for irrigation| RS485 |4-20mA| NBL-S-THR
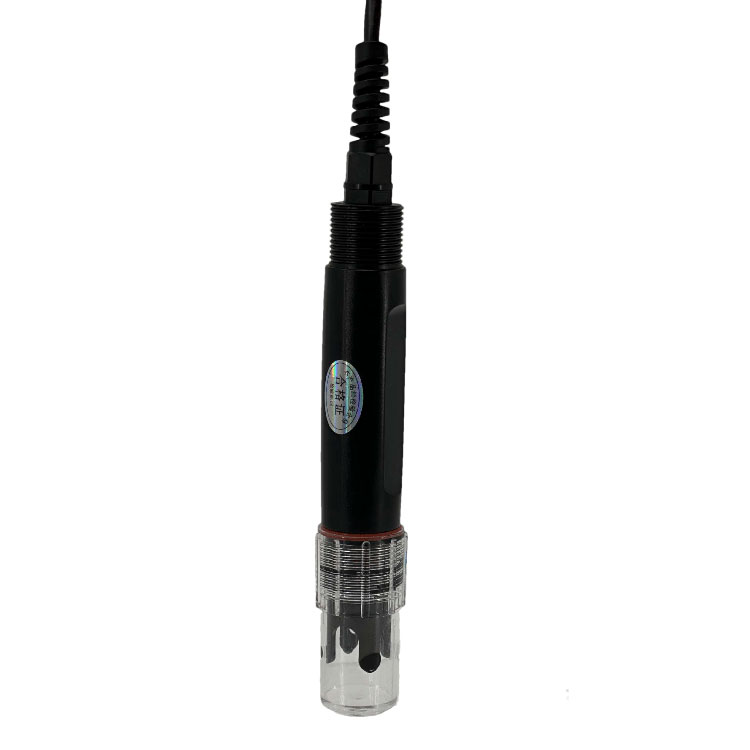 Soil pH sensor RS485 soil Testing instrument soil ph meter for agriculture |NBL-S-PH
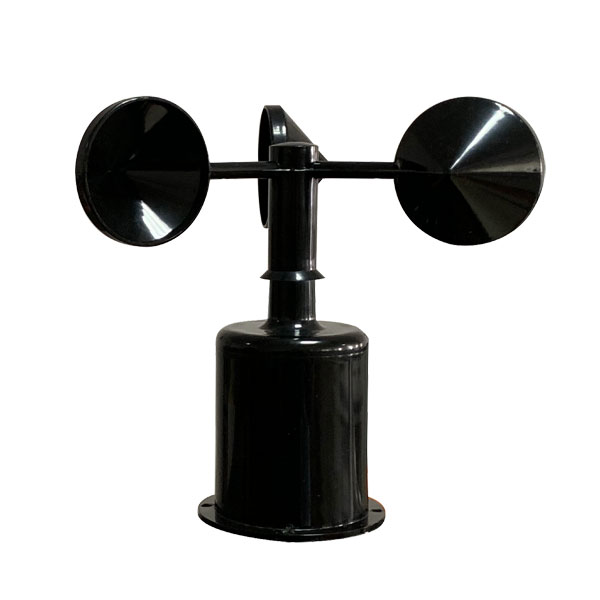 Wind Speed sensor Output Modbus/RS485/Analog/0-5V/4-20mA
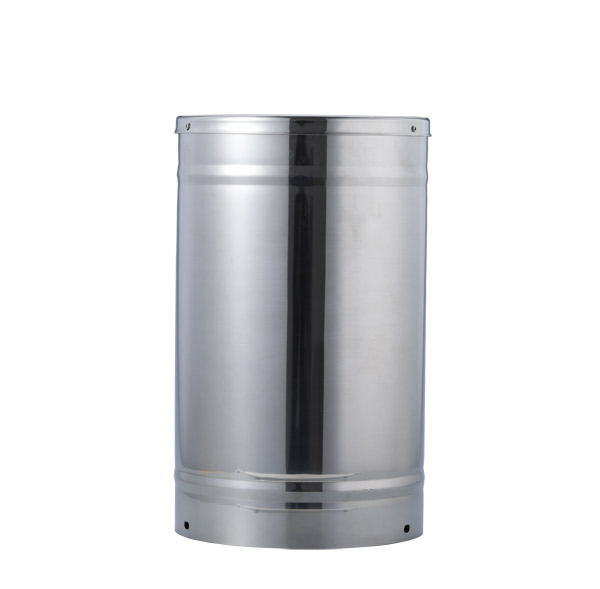 Tipping bucket rain gauge for weather monitoring auto rainfall sensor RS485/Outdoor/stainless steel
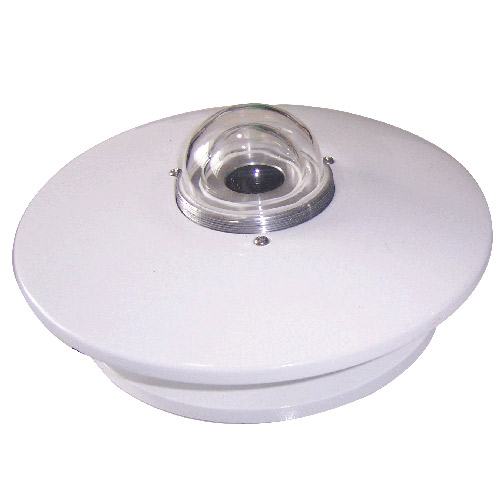 Pyranometer Solar Radiation Sensor 4-20mA/RS485


Screenshot, WhatsApp to identify the QR code
WhatsApp number:+8615367865107
(Click on WhatsApp to copy and add friends)