





— Blogs —
—Products—
 Consumer hotline +8618073152920
WhatsApp:+8615367865107
Address:Room 102, District D, Houhu Industrial Park, Yuelu District, Changsha City, Hunan Province, China
Product knowledge
Time:2025-04-08 11:38:47 Popularity:1633
Agricultural weather station reports should identify what was measured, where it was measured and which period the result covers. Rainfall, air temperature and soil moisture can inform farm decisions, but they do not directly measure crop stress, disease or irrigation demand. Keep observations separate from calculated indices and agronomic recommendations so the farm can judge which conclusions the record supports.
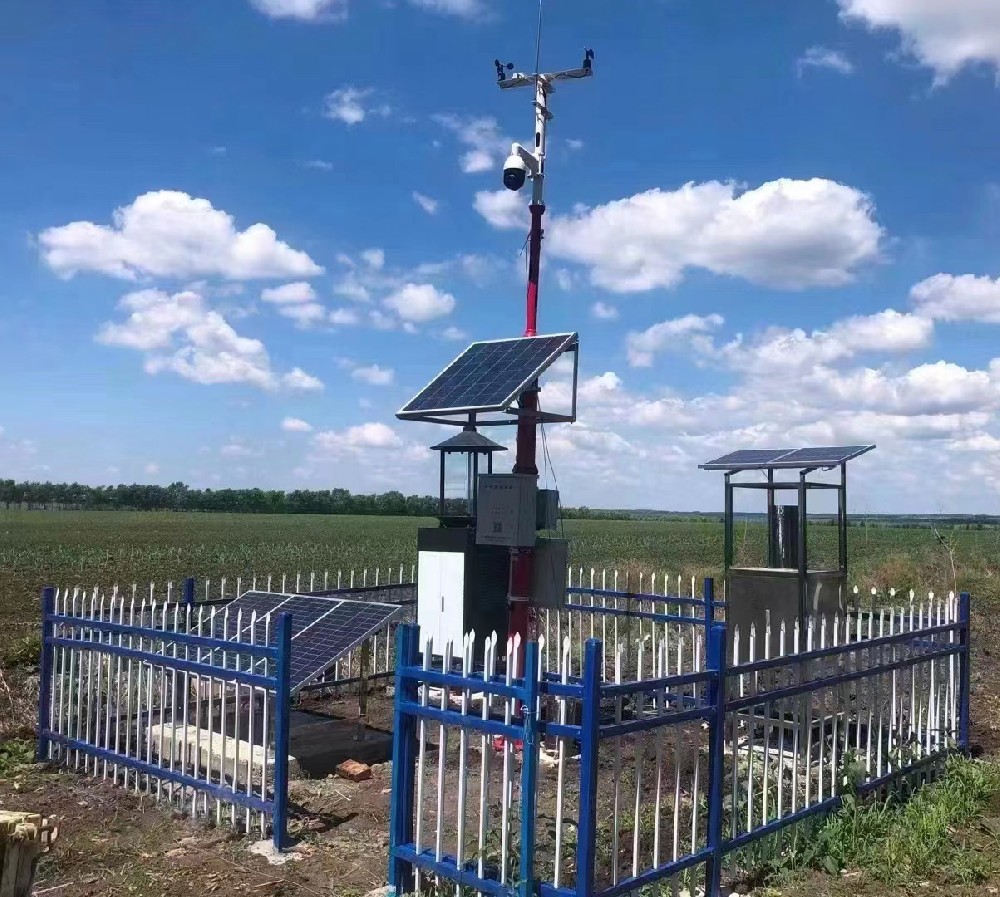
An agricultural automatic meteorological station can collect atmospheric observations without someone reading every instrument manually. Its reporting value depends on the task. An irrigation manager needs rainfall and representative soil response; a crop adviser may need temperature history around a particular growth stage. A greenhouse manager needs indoor conditions distinguished from the weather outside.
Before ordering channels, write down what the weekly report must help someone decide. A report intended to identify fields requiring inspection is different from one intended to calculate a crop model. Specifying the decision helps avoid purchasing instruments that generate more columns but leave the important question unanswered.
Give each report a station identifier, location, observation period and data-availability statement. Keep field and crop information associated with the record, but identify it as farm information rather than sensor output. A station does not automatically know the crop variety, sowing date or irrigation treatment simply because it is installed in an agricultural field.
| Report item | How it is obtained | What must accompany it |
|---|---|---|
| Air temperature, humidity and pressure | Atmospheric sensors at a documented exposure | Units, sample or summary period, sensor location and valid coverage |
| Rainfall amount | Rain-gauge observations accumulated over a defined period | Period boundary, collector condition and any missing or service periods |
| Soil temperature and moisture | Probes in specific soil volumes | Field or irrigation zone, sensing depth and installation history |
| Crop-development or water-demand index | A defined calculation using suitable inputs | Method, crop settings, input requirements and treatment of gaps |
| Management recommendation | Interpretation using observations and agronomic information | Responsible decision-maker, applicable crop conditions and remaining field checks |
For example, a rainfall total is an observation-based quantity. An irrigation recommendation additionally depends on soil, root depth, crop stage, application efficiency and the management method. Labeling a rainfall column crop water supply does not establish how much water reached the active roots.
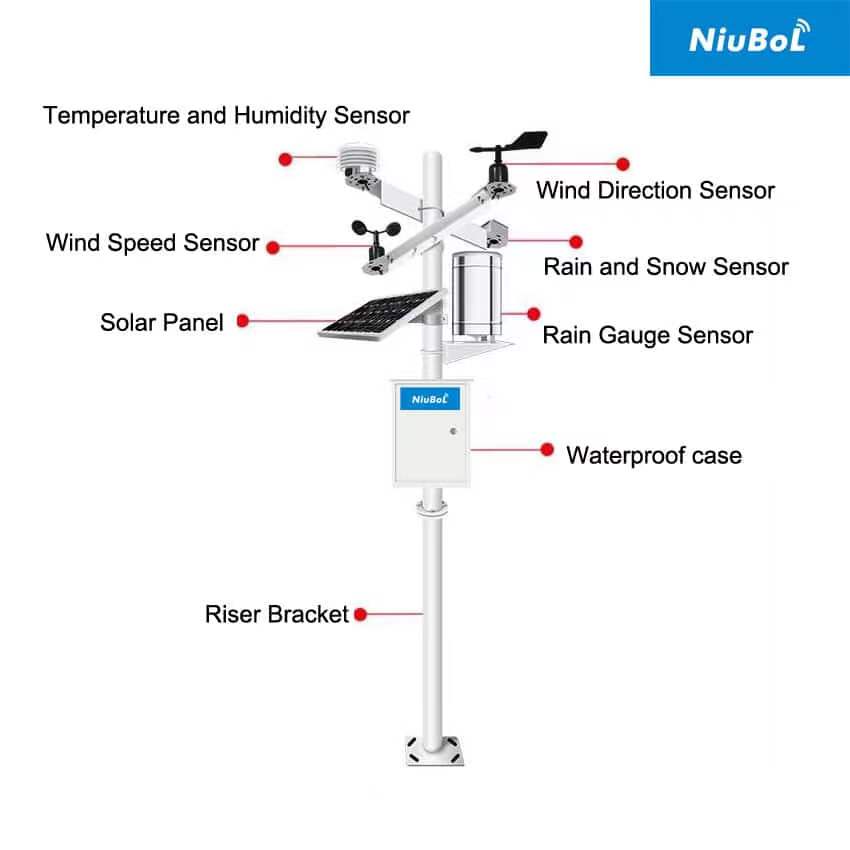
A modular station can combine weather and soil instruments, with each channel retaining its own purpose. The following examples show the distinction between component specifications and the interpretation of the resulting records. They are not a single accuracy specification for a complete farm-monitoring system.
| Component | Selected specification | Reporting use |
|---|---|---|
| NBL-W-LBTH | Air temperature -40°C to 80°C, ±0.5°C; humidity 0-100%RH, ±5%RH; pressure 10-1200 hPa, ±1.5 hPa | Atmospheric conditions at the observation point, not plant tissue temperature or pathogen detection |
| NBL-S-THR | Soil temperature -50°C to 100°C, ±0.5°C; soil moisture 0-100%, stated accuracy ±3%; DC 12-24 V; IP68 | Local soil conditions at a recorded depth; no EC, pH or NPK channel |
| NBL-W-RS | 0.2 mm increment; 0-4 mm/min intensity range; operating temperature 0°C to 50°C | Liquid rainfall collected at the station, not field infiltration or irrigation distribution |
| NBL-W-SS | 0-45 m/s or 0-70 m/s version; IP65; selected pulse, analog or RS485 output | Wind at the installed exposure, not a general authorization to spray |
Light and carbon dioxide require their own selected instruments. Illuminance, broadband solar irradiance and plant-light measurements are different quantities; do not rename one as another in a report. Adding an indoor CO2 channel likewise requires a suitable sensor, not a calculation from humidity or pressure.
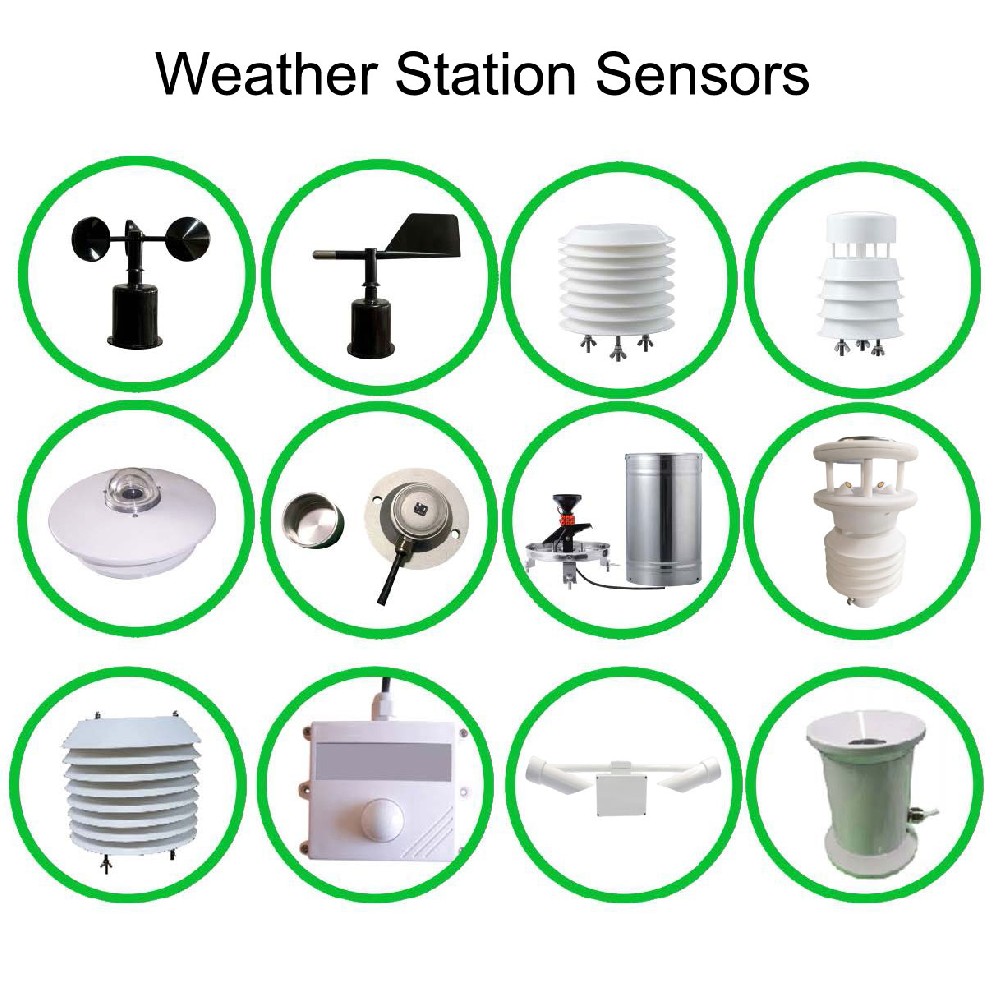
A logger or gateway sits between the sensor outputs and the report. For RS485 Modbus RTU versions, confirm addresses, serial settings, register definitions and scaling. A pulse rain gauge needs a compatible counting input; an analog instrument needs the appropriate input and conversion. A shared brand or similar connector does not make these signal types interchangeable.
Ask for an export example before acceptance. It should distinguish air temperature from soil temperature and identify each soil depth or greenhouse zone. Use observation timestamps rather than upload times to assemble daily records. Check the time zone and daily cut-off so a rain event is assigned consistently across reports.
A daily maximum means the highest value captured by the stated acquisition and aggregation method. It is not automatically the true maximum between samples. If one system stores hourly samples and another stores maxima from more frequent readings, their maximum columns are not necessarily comparable. Keep those methods with exported data instead of relying on the column name alone.
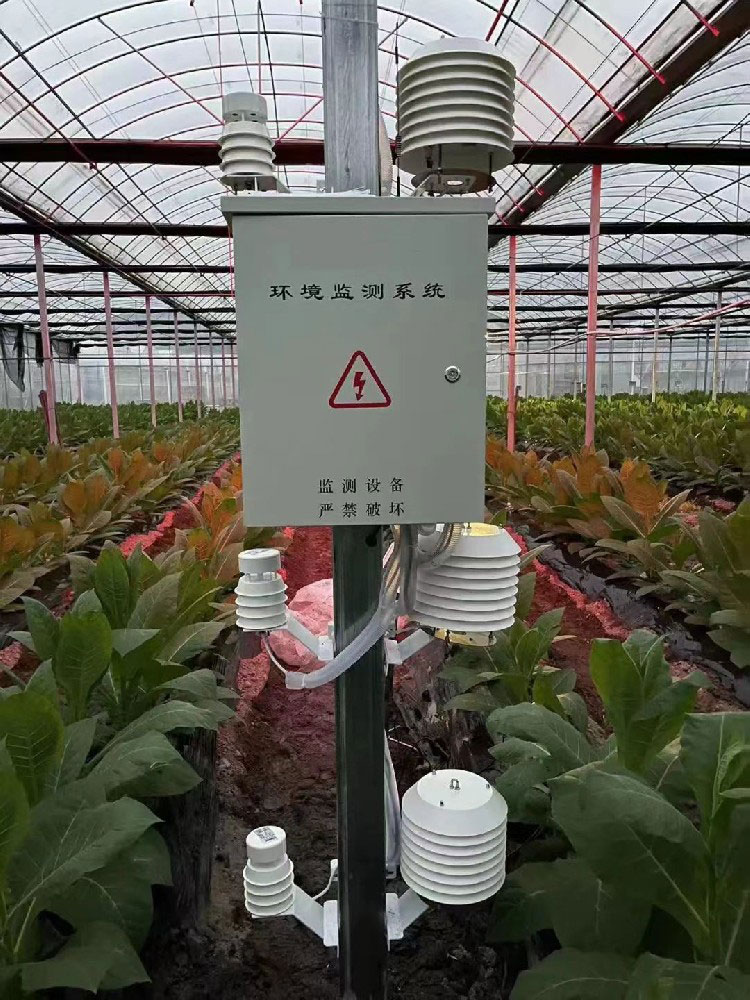
An outdoor station describes the atmosphere at its own exposure. Inside a greenhouse, shading, ventilation, irrigation and canopy position affect the local measurements. Report the inside and outside locations separately. A drop in outdoor humidity does not establish that a dense indoor crop canopy has dried.
When reviewing an intervention, record when it occurred: ventilation changed, irrigation started or a shade screen moved. Then compare the relevant channels over the same period. A temperature change after a control action is an observation worth investigating, not proof that the action alone caused it; outdoor conditions may also have changed.
Humidity can be an input to crop-specific disease-risk assessment, but no universal humidity reading authorizes a pesticide treatment. Disease assessment and treatment decisions require the appropriate agronomic method and applicable restrictions. Keep that recommendation outside the list of directly measured channels.
Review missing periods, maintenance and exposure changes before drawing a seasonal conclusion. A lower recorded rain total may reflect a real difference, but it may also include an unobserved storm during a power failure. A newly shaded air sensor may describe changed surroundings rather than a cooler season across the farm.
Keep sensor replacements, relocations, soil-probe depths and changes in reporting methods dated. Compare the same periods and quantities. Do not combine greenhouse and open-field temperatures into one unexplained average, or present a few seasons of local observations as a long-term climate trend.
Crop yield and quality records can be compared with weather observations, but weather alone does not establish why production changed. Retain irrigation, crop management and field information for the review. The station provides environmental context; it does not independently measure treatment effectiveness or predict yield.
Send NiuBoL the required observations, measurement positions, reporting interval, example output and existing PLC, RTU or data logger inputs. State whether the project needs raw observations, summaries, calculated indices or controller integration. These requirements affect the configuration and quotation separately.
Before acceptance, trace one value from the sensor through the logger to the exported report. Check units, identity and timestamps, then demonstrate how an unavailable channel appears. Confirm who maintains calculation settings and who can retrieve historical records. A readable dashboard is useful, but it is not a substitute for a report the farm can interpret and export.
Ask for a report that includes a weather event the farm would actually review, such as a cold night or a heavy-rain period. Show the relevant channels, sensor locations, units and interval definition beside the event. If the report combines air and soil measurements, label the depths and heights rather than presenting one generic temperature. Include the periods marked unavailable so a neat line does not conceal gaps.
The receiving team should be able to trace one reported value back to a timestamped observation and repeat the calculation. This matters when an agronomist challenges a frost duration or when a contractor changes a sensor. A chart may be useful for communication, but its procurement value comes from reproducible definitions, access to the underlying records and a clear record of instrument changes.
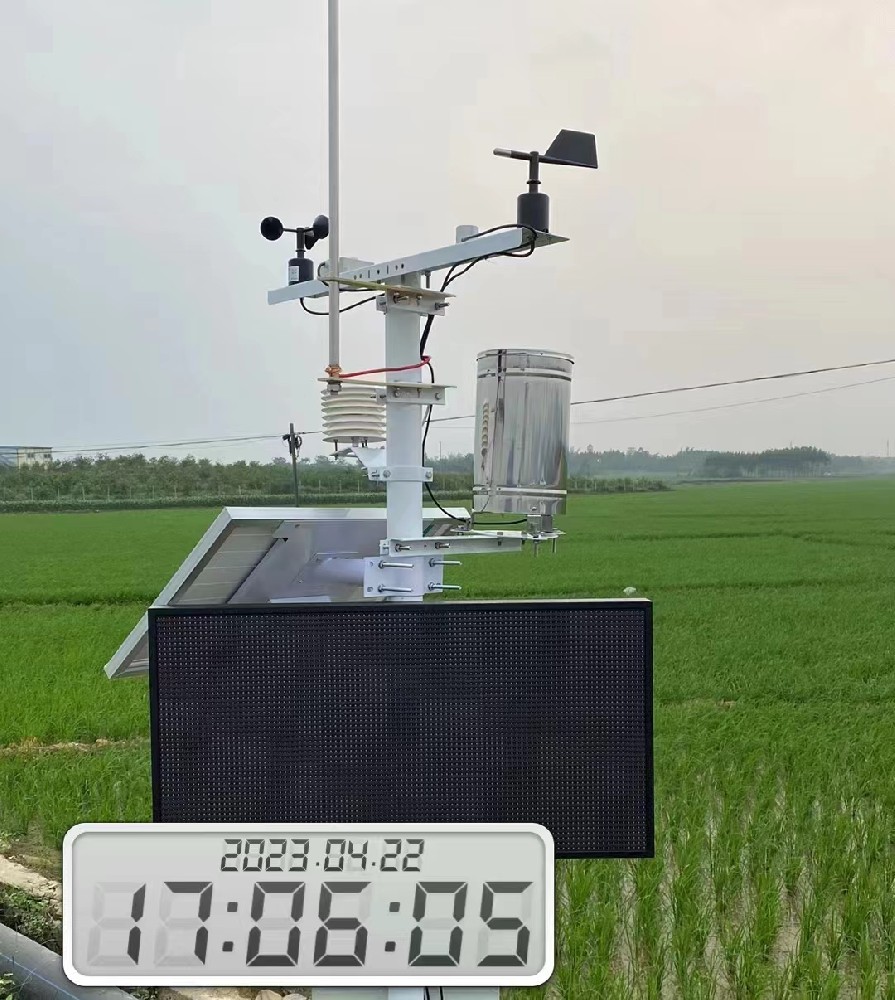
It measures selected environmental quantities. Irrigation demand is an interpretation or calculation requiring suitable inputs, crop information and a defined method. Ask which observations and calculations are included rather than assuming the station name includes an irrigation model.
No. Give each quantity a separate identity and document soil depth and atmospheric exposure. Combining or relabeling these readings removes information needed for planting, root-zone and greenhouse decisions.
Use consistent periods, units and summary methods, with adequate data coverage. Retain the history of location, instruments and exposure changes. Investigate differences before attributing them to climate or a management treatment.
No. Automatic operation also needs a controller, appropriate actuators, feedback and an agreed response to failed or stale inputs. A report or alert is not evidence that a vent, valve or cooling system actually operated.
Request the delivered channel schedule, output versions, decoding settings and an accepted export example. Keep the application requirements with that configuration so a later order does not silently substitute a different measured quantity or reporting method.
Retain station identity and location, sensor height or depth, units, interval definition, timestamps, maintenance events and data-quality status. The same column heading can mean different things after a sensor is moved or a logger averaging rule changes. A report should expose those changes instead of hiding them behind a continuous graph.
Yes, when the buyer needs later audit or a different aggregation. Keep the original records and the calculation method used for each summary. A monthly average cannot reconstruct a short frost event or show whether missing intervals were excluded; those questions require the underlying time series.
Ask the supplier to generate one report from a known period that includes a normal interval, a missing value and a maintenance event. Compare the report with the underlying records and confirm the receiving team's required export format. Sign off on the definitions, not merely the appearance of the chart.
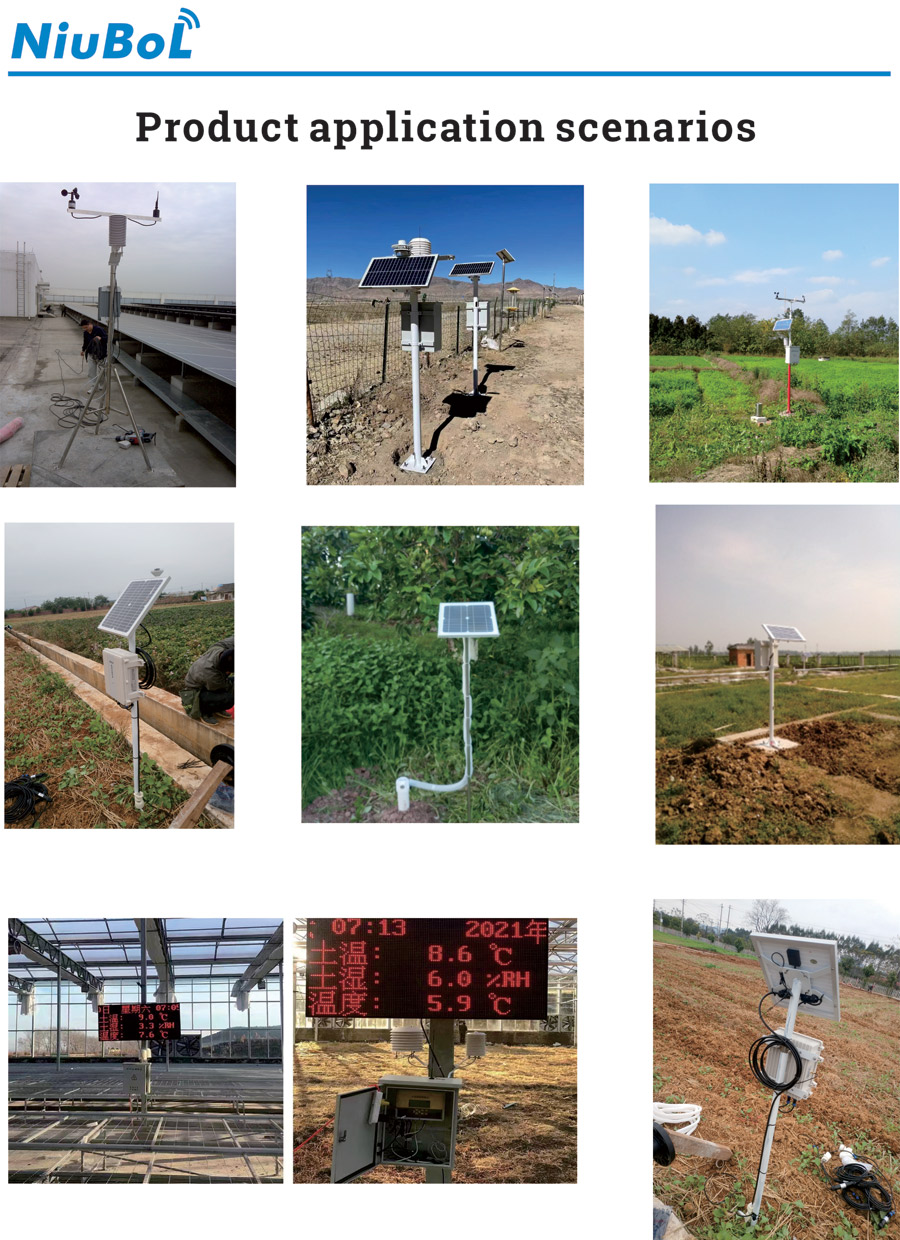
Agricultural weather station reports are useful when the reader can distinguish measurements, calculations and advice. Select NiuBoL instruments for the required observations, preserve location and timing information, and check data coverage before interpreting a field or seasonal difference. The report should show what is known without claiming that the sensors make every farm decision.
Prev:Visibility Monitoring Station Data: Preserve Units, Limits and Status
Next:Weather Monitoring for Sowing: Soil Temperature Is Not Air Temperature
Related recommendations
Sensors & Weather Stations Catalog
 Agriculture Sensors and Weather Stations Catalog-NiuBoL.pdf
Weather Stations Catalog-NiuBoL.pdf
Agriculture Sensors Catalog-NiuBoL.pdf
Water Quality Sensor Catalog-NiuBoL.pdf
Related products
 Combined air temperature and relative humidity sensor
 TDR Soil Moisture & Temperature Sensor for irrigation| RS485 |4-20mA| NBL-S-THR
 Soil pH sensor RS485 soil Testing instrument soil ph meter for agriculture |NBL-S-PH
 Wind Speed sensor Output Modbus/RS485/Analog/0-5V/4-20mA
 Tipping bucket rain gauge for weather monitoring auto rainfall sensor RS485/Outdoor/stainless steel
 Pyranometer Solar Radiation Sensor 4-20mA/RS485


Screenshot, WhatsApp to identify the QR code
WhatsApp number:+8615367865107
(Click on WhatsApp to copy and add friends)

