





— Blogs —
—Products—
 Consumer hotline +8618073152920
WhatsApp:+8615367865107
Address:Room 102, District D, Houhu Industrial Park, Yuelu District, Changsha City, Hunan Province, China
Product knowledge
Time:2026-11-10 07:30:00 Popularity:2
An outdoor PM2.5 sensor reports mass concentration of particles at or below 2.5 μm, typically by laser scattering over a 0–1000 μg/m³ span. At the low ambient concentrations that matter at a perimeter or urban background site, the number is shaped less by the optics than by humidity, hygroscopic growth and any derived size fraction presented as a measurement.
Two outdoor nodes on the same monitoring site produced the same reported value on different mornings. One reading triggered a data-quality review; the other did not. The difference was not in the sensor but in what else was logged with it.
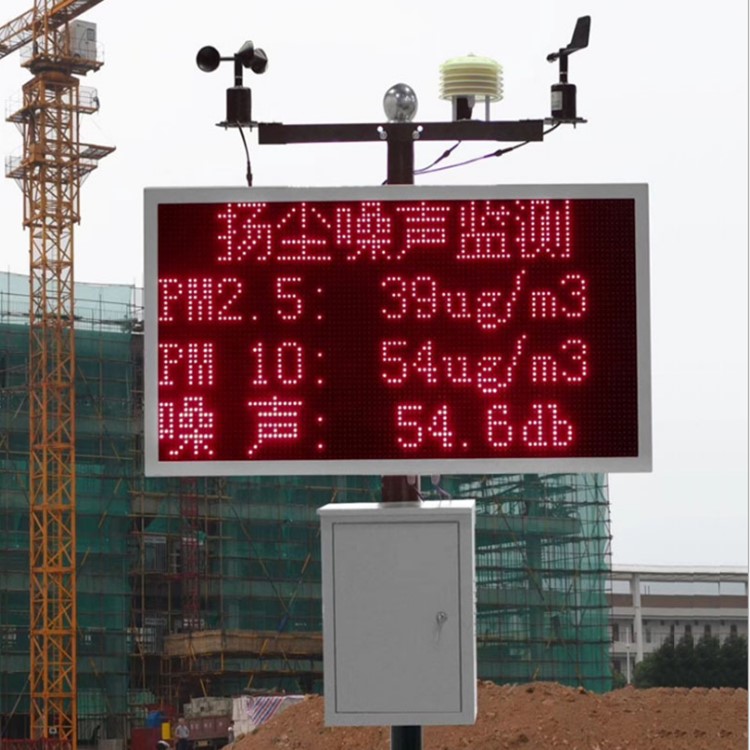
Figure 1. PM100 sensors.
For an outdoor PM2.5 sensor, Node B's 8 μg/m³ at 81% RH is not the same measurement as Node A's 8 μg/m³ at 42% RH. Water taken up by hygroscopic particles increases their scattering cross-section, so an optical instrument reports more mass without any change in the dry particle load. Storing RH alongside the concentration is the only way to separate them.
The derived PM1 column is a second trap. An outdoor PM2.5 sensor in this class can output PM1, PM2.5 and PM10 through algorithms, and a stated estimation is PM1 = PM2.5 × 0.7 in most urban backgrounds, where PM1 accounts for roughly 50–80% of PM2.5. That is a model output, not a measured channel.
At 8 μg/m³, the 0.7 factor gives 5.6 μg/m³. Applying the 50–80% band gives 4.0–6.4 μg/m³ instead — a 2.4 μg/m³ spread caused by the assumed ratio, not by the instrument. Writing 5.6 μg/m³ into an acceptance sheet presents a modelling assumption as a measurement.
An outdoor PM2.5 sensor using laser scattering in this range is specified for 0–1000 μg/m³ with a relative error of ±15% and a maximum absolute error of ±10 μg/m³. It detects particles as small as 0.3 μm, runs on DC 12–24 V, and is stated for −20 to +60 °C and 0–99% RH. The absolute error term dominates at low ambient levels: against a reading of 8 μg/m³, a ±10 μg/m³ term is larger than the value itself.
That does not make the sensor useless at a background site. It means the number should be used as a trend and an event indicator, not as a low-level absolute determination. A change from 8 to 21 μg/m³ after a vehicle pass is a resolvable event; a claim that Node A is exactly 3 μg/m³ cleaner than Node B is not.
The 0–99% RH figure is an environmental rating with a hard qualifier: liquid moisture must be strictly prevented from entering the internal circuit. A numerical range is not a condensation immunity statement. A separate 6-in-1 air quality assembly is specified for −30 to 50 °C and 15–90% RH, with ±5% FS sampling accuracy across PM2.5, CO, CO2, O3, SO2 and NO2 and optional PM10.
Two humidity envelopes at the same site therefore describe different products. The 15–90% RH condition applies without condensation, while 0–99% RH describes a chamber rating that still forbids liquid ingress. Keep the two out of one specification table, and state which product each row refers to.
Hygroscopic growth is not a fixed offset on an outdoor PM2.5 sensor. It depends on particle composition, so a sulfate-rich aerosol responds differently from soot at the same RH. Above roughly 70–80% RH, the bias grows quickly and recovery after a humid period can be slow. A dawn rise that coincides with high RH is often water, not emissions.
Air movement changes the reading in two ways at once. Wind changes the sample presented to the inlet, and a change in RH changes how the remaining particles scatter light. Log the wind record and RH at the same timestamp as PM2.5, otherwise a siting decision is being made on a mixed signal.
The derived PM1 and PM10 relationships add another layer. In areas with a relatively stable particle size distribution, PM1 may be estimated from PM10, where PM1 accounts for about 30% of PM10. That assumption is only valid where the size distribution is stable — exactly the condition a passing plume or a nearby dust event violates.
Where a decision depends on a size fraction, ask for a direct channel rather than an algorithmic estimate. A sensor series integrating PM1, PM2.5 and PM10 monitoring is a different configuration from a single PM2.5 unit with a derived PM1 output, and the distinction belongs in the register map.
Consider two co-located outdoor units, one reporting 8 μg/m³ and one reporting 11 μg/m³ over the same 30-minute average at 45% RH. The difference is 3 μg/m³, or 37.5% of the lower reading. That looks like a serious disagreement until the error terms are stated.

Figure 2. Combined air temperature and relative humidity sensor.
Illustrative calculation based on assumed site values, not a measured field record. If the applicable error expression is ±15% of reading, the first unit spans 6.8–9.2 μg/m³ and the second 9.35–12.65 μg/m³. Those intervals do not quite touch: a 0.15 μg/m³ gap remains, so under this convention the two units would appear separable.
If instead a ±10 μg/m³ absolute term applies, both intervals widen by an order of magnitude and overlap almost completely, so a 3 μg/m³ difference carries no discriminating information. The same pair of readings therefore supports opposite conclusions depending on what the datasheet states. No conclusion is possible until the convention is known.
The same arithmetic applies to an alert threshold. A threshold placed 2 μg/m³ above a baseline of 8 μg/m³ is smaller than the spread in the derived PM1 band and smaller than the absolute error term. Set thresholds as multiples of the stated uncertainty, not as round numbers.
Use an upwind reference node to decide whether a rise is local or transported. If PM2.5 climbs at the site while the upwind node stays flat and RH is stable, the source is likely local. If both rise together, the site is tracking regional background and an inlet inspection may be the wrong response.
An acceptance record for an outdoor PM2.5 sensor should carry six fields per interval: the raw concentration, RH, temperature, the wind record, the error convention in force, and a flag marking any derived size fraction. With 1-minute logging that is 1,440 rows per day per node, so a 7-day co-location against a reference produces 10,080 rows before a single node-to-node comparison is made. Keep derived columns separate from measured ones; a register map that stores an estimated PM1 in the same field as a measured PM2.5 value makes a later audit impossible.
Do not use an optical outdoor PM2.5 sensor as a gravimetric reference or as evidence of compliance with an ambient air quality limit. Its mass conversion depends on assumed particle density and shape, and its low-level behaviour depends on RH. Where a limit is in question, agree the reference method and its uncertainty separately.
Do not present a derived PM1 or PM10 value as an independent measurement. A 0.7 factor or a 30% PM10 relationship describes a typical urban size distribution, not the air at the inlet. Report it as an estimate with its assumed ratio, or omit it.
Do not compare two nodes whose RH differs by 30 points without a humidity flag. In the worked table, both nodes read 8 μg/m³, but only one justified an inlet inspection once RH was considered. And do not mount the inlet under a canopy, against a wall, near an exhaust outlet or within reach of a sprinkler: the sample then describes the local airflow, not the site.

Figure 3. 10-in-1 Compact Ultrasonic Weather Sensor — CO2 PM2.5 PM10 Environmental Monitoring Sensor.
Q1. Is an 8 μg/m³ outdoor reading accurate to 1 μg/m³?
No. A PM2.5 sensor in this class is stated for 0–1000 μg/m³ with a relative error of ±15% and a maximum absolute error of ±10 μg/m³, and the absolute term is larger than an 8 μg/m³ reading. Use the value as a trend and an event indicator; an outdoor PM2.5 sensor is not a low-level reference instrument. State which error convention applies before comparing two units.
Q2. Can a derived PM1 value be treated as a measured channel?
No. An estimate such as PM1 = PM2.5 × 0.7 reflects a typical urban background where PM1 is roughly 50–80% of PM2.5. At 8 μg/m³ that gives 5.6 μg/m³, but the 50–80% band gives 4.0–6.4 μg/m³. The 2.4 μg/m³ spread is model uncertainty, not instrument noise.
Q3. Does 0–99% RH mean the sensor works in condensing air?
No. The rating comes with an explicit condition that liquid moisture must be strictly prevented from entering the internal circuit. A 6-in-1 assembly in the same product family is specified for 15–90% RH, applying without condensation. A numerical range is not condensation immunity.
Q4. Why did two nodes with the same PM2.5 value lead to different decisions?
Because one was at 42% RH and the other at 81% RH. Hygroscopic growth increases scattering at high humidity, so the optical mass estimate rises without a change in dry particle load. In the worked table, the 81% RH case justified an inlet inspection and the 42% RH case did not. An outdoor PM2.5 sensor cannot separate those two cases without the humidity field.
Q5. Is ±5% FS the same as ±15% of reading?
No. One is a fraction of full scale and the other a fraction of the current value; at 8 μg/m³ against a 1000 μg/m³ measuring span they differ by orders of magnitude. The ±5% FS figure belongs to a specific 6-in-1 assembly, not to every PM2.5 sensor. Never put both conventions in one acceptance column.
Q6. Should an outdoor node be placed under a canopy?
No. The inlet would then sample sheltered air rather than the site, and a shift in wind and RH can move the reading at once. Mount in an open, well-ventilated position with unobstructed inlets, and log the wind record alongside PM2.5 so a change in transport is not read as an emission.
An outdoor PM2.5 sensor earns its place when it resolves changes, not when it certifies small absolute differences. In the worked comparison, 8 and 11 μg/m³ could not be separated until the error convention was stated, and two identical readings at 42% and 81% RH supported opposite decisions.
Keep RH, temperature and the wind record with every value, label derived size fractions as estimates with their assumed ratio, and set thresholds as multiples of the stated uncertainty. Before accepting a node, ask which channels are measured and which are calculated — that single line in the register map decides whether the data can be compared at all.
Reading a small PM2.5 number correctly
An outdoor PM2.5 sensor is a trend and event instrument at low ambient concentrations, not a low-level reference. Two outdoor nodes both reading 8 μg/m³ at 42% and 81% RH are not the same measurement, and a derived PM1 value in the worked 4.0–6.4 μg/m³ band is a model output rather than a sized fraction. Against a 0–1000 μg/m³ span, an 8 μg/m³ reading is under 1% of full scale, so the error convention decides what it can support. Store RH, the wind record and a derived-value flag with every interval, and co-locate against a reference before comparing sites.
Co-locating outdoor PM2.5 sensors? Share the site layout, RH range and reference instrument via our contact page, and we will help you define the acceptance fields and derived-value flags.
Prev:Smart Agriculture Monitoring: How Many Nodes per Zone?
Next:no more
Related recommendations
Sensors & Weather Stations Catalog
 Agriculture Sensors and Weather Stations Catalog-NiuBoL.pdf
Weather Stations Catalog-NiuBoL.pdf
Agriculture Sensors Catalog-NiuBoL.pdf
Water Quality Sensor Catalog-NiuBoL.pdf
Related products
 Combined air temperature and relative humidity sensor
 TDR Soil Moisture & Temperature Sensor for irrigation| RS485 |4-20mA| NBL-S-THR
 Soil pH sensor RS485 soil Testing instrument soil ph meter for agriculture |NBL-S-PH
 Wind Speed sensor Output Modbus/RS485/Analog/0-5V/4-20mA
 Tipping bucket rain gauge for weather monitoring auto rainfall sensor RS485/Outdoor/stainless steel
 Pyranometer Solar Radiation Sensor 4-20mA/RS485


Screenshot, WhatsApp to identify the QR code
WhatsApp number:+8615367865107
(Click on WhatsApp to copy and add friends)

