





— Blogs —
—Products—
 Consumer hotline +8618073152920
WhatsApp:+8615367865107
Address:Room 102, District D, Houhu Industrial Park, Yuelu District, Changsha City, Hunan Province, China
Product knowledge
Time:2026-11-10 06:22:58 Popularity:4
Smart agriculture monitoring pays back when a node answers a decision for a specific zone, not when it adds a channel. Four zones, twelve nodes and one shared gateway can cost less and produce more usable data than twelve nodes placed by convenience. The arithmetic starts with the crop question, not the equipment list.
A 40-hectare block split by soil texture and irrigation setup gives a cleaner design than a grid drawn on a map. The table below is a worked smart agriculture monitoring layout with one decision per zone, one node count per zone, and no channel added without a question attached to it.
In a smart agriculture monitoring layout, ten probes with four depths and two with two produce 44 moisture channels plus one temperature channel per depth. That is a lot of numbers for four questions. The design only works because each zone has one decision attached to it; without that, the same 44 channels become a dashboard nobody acts on.
A multi-depth probe in this product class is offered with standard nodes at 10, 20, 30 and 40 cm. Its moisture resolution is 0.1%, but stated accuracy is ±3% in the laboratory and ±5% in the field — the figure that matters when zone boundaries are drawn. Temperature covers −40 to 80 °C at ±0.5 °C, with IP67 above ground, IP68 below ground and RS485 Modbus RTU channels that need a correct device map and serial settings.
The ±3% laboratory and ±5% field figures are the important ones for smart agriculture monitoring zone design. A fine reporting increment does not remove installation or spatial differences. Two zones whose refill points differ by less than the field uncertainty cannot be managed as separate irrigation zones on moisture alone, no matter how many probes are installed.
In a smart agriculture monitoring layout, Zone A asks when the wetting front passes 30 cm. That question needs the 20 and 30 cm channels to be read at a short interval during irrigation and the 40 cm channel to confirm the front did not pass the root zone. It does not need a 10 cm channel at three separate positions in the same 9 hectares.
Zone C asks a different question — whether waterlogging is limiting root growth. Here the 40 cm channel matters more than the surface channel, and the answer is a duration above a site-defined threshold rather than a single value. A probe that reports 0.24 m³/m³, or 24% VWC, is not automatically reporting 24% of field capacity. If an accepted site value for field capacity were 0.30 m³/m³, the simple ratio would be 80%, but that ratio is an interpretation, not a sensor output.
Retain depth identity for each temperature channel. A 10 cm temperature reading and a 40 cm reading are different measurements with different diurnal behaviour; averaging them into one "soil temperature" hides the very gradient that explains a moisture discrepancy.
Match the soil profile to the crop question before ordering hardware. Standard nodes at 10/20/30/40 cm cover many annual row crops, but other depths are available by configuration. Ordering a standard arrangement for a shallow-rooted crop spends channels on depths the roots never reach.
A common mistake in smart agriculture monitoring is to compare probe prices. The larger costs are the gateway, the cabling or radio path, the installation visit and the revisit to fix a node that drifted or lost power. In the twelve-node example, one shared RS485 Modbus gateway serves all four zones, and a single 12–24 VDC supply arrangement can be planned once rather than four times.
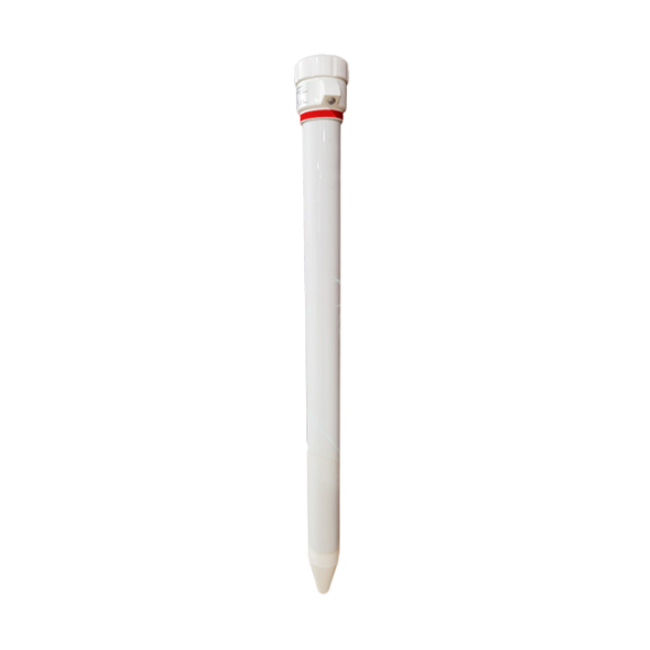
Figure 1. Multi depth soil moisture sensor for water-saving irrigation, flower horticulture, greenhouse, smart….
Consider an illustrative budget. If each probe costs 140 units installed, twelve probes cost 1680 units. One gateway, one enclosure, power distribution and commissioning add 900 units, and two follow-up visits over three years add 400 units. The three-year total is 2980 units, of which the probes themselves are 56%. Equipment price is therefore a poor proxy for project cost.
Illustrative calculation based on assumed site values, not a measured field record. The 140-unit probe, the 900-unit shared infrastructure and the 400-unit revisit figures are worked example values. Use current quotations and the ordered configuration for your site, and check the power and transmission arrangement against the current datasheet before setting a budget.
Payback needs a benefit stated in the same units. If zone-based scheduling reduces irrigation by 6% on a block using 4200 m³ per season, that is 252 m³ saved per season, or 756 m³ over three years. Whether that repays 2980 units depends entirely on the local water and pumping cost, which is a site input, not a number a supplier can supply. Ask for the delivered volume measured on site, not an assumed saving.
The numerical channels in a smart agriculture monitoring cabinet travel over RS485 Modbus RTU, while the crop-imaging module in the same four-condition setup transfers files by another route. Budget the two separately: a register map covers the soil and weather values, and the image path needs its own storage, bandwidth and retrieval test. Neither belongs in one "system accuracy" figure.
A 7-in-1 soil sensor in this product family measures temperature, moisture, EC, pH, N, P and K over RS485 Modbus RTU, with the seven values held in consecutive registers. Combining seven measurements at one point reduces cables, mounting positions and Modbus addresses, but it does not improve any single channel.
Its specified pH accuracy is ±1 pH, so it should not be positioned as a laboratory pH instrument: a single device cannot be more accurate than its weakest channel. Each RS485 sensor needs a unique Modbus address, with polling intervals and power distribution sized for the whole network.
Air-temperature and humidity observations come from a separate module mounted above the crop. Atmospheric moisture is context for a canopy decision, not a direct measure of leaf wetness, and a quoted RH range is not an immunity statement for condensation. Keep that module out of the soil-depth channel count in the table above.
There are clear cases in smart agriculture monitoring where the right answer is fewer probes. If two candidate zones share the same soil texture, the same irrigation hardware and the same crop, and their first-season moisture traces differ by less than the ±5% field uncertainty, a separate node in each cannot support a separate decision. Merge them and spend the saved channel on a third depth at the node you keep.
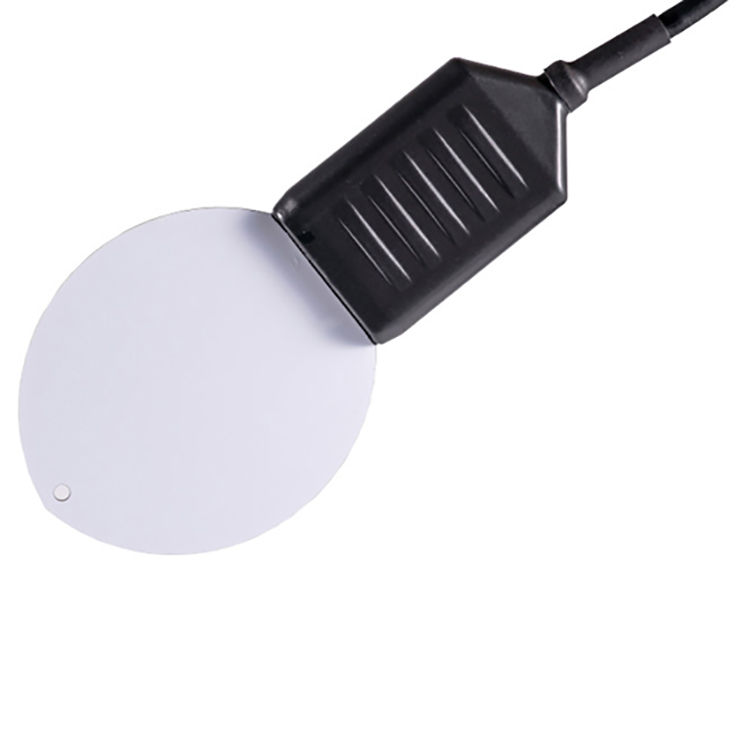
Figure 2. Leaf Temperature and Humidity Sensor For Smart Agriculture.
The same applies to control. An agricultural weather station may log soil moisture, air temperature and RH on a configurable recording interval, but a 0–100% measurement range is not a recommended control band. Confirm the actual I/O configuration and which device holds the control rules before setting thresholds.
A fine reporting interval also has a cost. Polling 44 moisture channels every minute produces 63,360 values per day; at 10-minute logging the same layout writes 6,336, most of them changing slowly. Where the decision is a refill point crossed over hours, the longer interval preserves the event and reduces power, storage and traffic. Fix the sampling policy from the decision timescale, not from the maximum rate the logger supports.
Q1. How many nodes does a 40-hectare block need?

Figure 3. NiuBoL Smart Environmental Monitoring Station — 4G Solar Multi-Parameter Environmental Monitoring System.
Smart agriculture monitoring designs follow the decisions, not the area: the worked layout uses twelve multi-depth probes across four zones. Each zone has one crop question. If two zones share soil texture, irrigation hardware and crop, and their traces differ by less than the ±5% field accuracy, merge them and add a depth at the node you keep instead.
Q2. Does 0.1% moisture resolution mean 0.1% accuracy?
No. A multi-depth probe in this class is stated at 0.1% resolution with ±3% accuracy in the laboratory and ±5% in the field. A fine reporting increment does not remove installation or spatial differences. Compare zone boundaries against the field figure, not the display increment.
Q3. Is 24% VWC the same as 24% of field capacity?
No. A reading of 0.24 m³/m³ is 24% VWC. It is not automatically 24% of field capacity. With an accepted site value of 0.30 m³/m³, the simple ratio is 80%, but that is an interpretation. Store VWC and any derived ratio in separate columns and measure field capacity on site.
Q4. Why is a shared gateway cheaper than buying fewer probes?
In the worked budget, twelve probes at 140 units each are 1680 units, while one shared gateway, enclosure, power distribution and commissioning add 900 units and two revisits add 400 units. The probes are 56% of a 2980-unit three-year total, so probe price is a poor proxy for project cost. These are illustrative values, not a quotation.
Q5. Can one 7-in-1 sensor replace separate laboratory instruments?
It replaces separate probes, cables, mounting positions and RS485 addresses, measuring temperature, moisture, EC, pH, N, P and K over Modbus RTU. Its specified pH accuracy is ±1 pH, so it is not a laboratory pH instrument. A single device cannot be more accurate than its weakest channel.
Q6. Should numerical channels and images share one acceptance test?
No. RS485 Modbus RTU carries selected numerical values, while images and cabinet reports use a separate transfer path with its own storage and retrieval test. Test the register map and the image route separately, and confirm which device holds the control rules before setting any threshold.
Smart agriculture monitoring is a layout exercise followed by a cost exercise. In the four-zone example, 44 moisture channels are only useful because each zone has one decision attached; the same channel count without those decisions is a dashboard. Probe price was 56% of the three-year total, and the payback depended on a water saving that only a site measurement can establish. Write the decision sentence for each zone first, verify the register map and the separate image route, then review zone boundaries after one season and merge the ones the field uncertainty cannot distinguish.
Where the payback actually comes from
Smart agriculture monitoring pays back through the questions attached to each zone, not through node count. The worked 40-hectare layout used 4 zones and 12 multi-depth probes for 2,980 units over three years, of which probes were 56% and gateway, power and commissioning 30%; the 6% water saving amounted to 756 m³ over the same period. A node with no decision behind it adds cost without adding a reading anyone uses. Write the decision, the depth and the action threshold for every channel first, then buy the hardware that answers those questions and revisit the refill point each season.
Planning zones for a smart agriculture monitoring project? Tell us the soil texture, irrigation setup and the decisions each zone must support through our contact page, and we will work through the node count with you.
Prev:Multiparameter Water Quality Sonde: pH Drift Over Seven Days
Next:no more
Related recommendations
Sensors & Weather Stations Catalog
 Agriculture Sensors and Weather Stations Catalog-NiuBoL.pdf
Weather Stations Catalog-NiuBoL.pdf
Agriculture Sensors Catalog-NiuBoL.pdf
Water Quality Sensor Catalog-NiuBoL.pdf
Related products
 Combined air temperature and relative humidity sensor
 TDR Soil Moisture & Temperature Sensor for irrigation| RS485 |4-20mA| NBL-S-THR
 Soil pH sensor RS485 soil Testing instrument soil ph meter for agriculture |NBL-S-PH
 Wind Speed sensor Output Modbus/RS485/Analog/0-5V/4-20mA
 Tipping bucket rain gauge for weather monitoring auto rainfall sensor RS485/Outdoor/stainless steel
 Pyranometer Solar Radiation Sensor 4-20mA/RS485


Screenshot, WhatsApp to identify the QR code
WhatsApp number:+8615367865107
(Click on WhatsApp to copy and add friends)

