





— Blogs —
—Products—
 Consumer hotline +8618073152920
WhatsApp:+8615367865107
Address:Room 102, District D, Houhu Industrial Park, Yuelu District, Changsha City, Hunan Province, China
Product knowledge
Time:2026-11-10 08:00:00 Popularity:3
Wastewater monitoring produces two kinds of numbers: continuous online values and discrete laboratory determinations. They are not interchangeable. The online series shows when something changed; the laboratory result establishes what the value was under a defined method. A defensible record keeps both, with the sampling conditions attached.
A discharge point reported an online estimate of 42 mg/L at 14:00. A grab sample taken at 14:10 and analyzed by the reference method returned 31 mg/L. Neither number is automatically wrong, and that is the problem.
In wastewater monitoring an optical channel reports an estimate tied to fluorescent organic matter over a 150 mg/L measuring span, with turbidity quoted from 0 to 100 NTU. The 0.1 mg/L step in the record is a display increment. Such an estimate is neither a laboratory BOD determination nor a pollutant identification, and a full-scale error of 7.5 mg/L applies across that span.
At 42 mg/L, a 7.5 mg/L full-scale term is roughly 18% of the reading. The 11 mg/L gap between the two methods is larger than that term, so it cannot be dismissed as instrument uncertainty alone. It could be a real change in the ten minutes between readings, a sample that was not representative of the flow, or turbidity interference that the optical compensation did not cover.
The 0.1 mg/L increment is not evidence of discrimination at that level. A fine reporting digit does not establish that the instrument can resolve a small change in a low-background stream. Use a validated optical relationship, not an assumed laboratory BOD or pollutant identity, when interpreting the online channel.
In wastewater monitoring the two methods sample different volumes at different times. A probe sees the water passing its optical window continuously; a grab sample is a few hundred millilitres taken at one instant from one point. If the discharge is stratified, or if a batch release is moving past the intake, the two can legitimately differ by more than the sensor error.

Figure 1. NBL-WQ-BOD-4A Online BOD Sensor RS485 — NiuBoL.
Sample handling introduces its own changes. A laboratory BOD determination incubates a diluted sample at 20 °C for five days and takes the difference in dissolved oxygen before and after; settling, filtration or pH adjustment changes which fraction of the sample is measured. That is a defined method on a five-day timescale, not a step an online optical probe performs, and it is why a same-afternoon comparison needs a stated sampling time.
Temperature and pressure are part of the online specification, not decoration. An optical BOD-type channel is specified for 12–24 VDC, RS485 Modbus RTU, pressure <0.1 MPa, POM/316L construction, and mounting at least 30 cm below the lowest expected water level. Outside those conditions the stated relationship no longer describes the measurement.
A pH channel in the same cabinet illustrates the point from the other side. pH is an activity, pH = −log10 a(H+), not an ion concentration, so a laboratory value and a probe value can differ because the sample changed during transport rather than because either instrument drifted. Record temperature and sample preparation for the laboratory path alongside the probe's own conditions, and keep the two sets in separate columns.
Data validity is the fraction of scheduled intervals that carry a usable value, where usable means the online reading, the sample condition and the timestamp source are all present. It is a more useful acceptance metric for wastewater monitoring than uptime, because a running pump can still deliver unusable water from a stagnant line.

Figure 2. NBL-WQ-COD Online COD Water Quality Sensor.
Consider a month with 43,200 one-minute intervals. Remove 1,440 minutes for a scheduled calibration, 2,880 minutes for a blocked intake line, and 720 minutes for sample transport gaps where no paired laboratory value exists. That leaves 38,160 valid intervals, or 88.3% of the month.
Illustrative calculation based on assumed site values, not a measured field record. The interval counts and the three loss categories are worked example values. Compute validity from your own event log, and count an interval as valid only when the online value, the sample condition and the timestamp source are all recorded.
Now consider how many of those valid intervals can actually be compared with a laboratory result. If four grab samples per week produce 16 paired observations in the month, the paired coverage of 38,160 valid online intervals is 0.04%. A monthly bias correction derived from 16 pairs is being applied to tens of thousands of values. State that denominator before quoting a corrected dataset.
Weekly standard checks belong in the acceptance record too, but as procedure limits rather than instrument specifications. Record the replicate mean and spread against the site's own trigger values, and keep that column separate from the datasheet error term; a drift flag is not an accuracy claim about the probe.
In wastewater monitoring, continuous sampling depends on a pump running continuously, which makes it a high-failure component. A pump that cavitates, loses prime or clogs delivers a stagnant volume to the probe. The instrument then reports a stable, plausible value from water that is no longer moving. A flat line is a fault signature, not a clean process.
Pretreatment has the same problem. Settling or filtration removes the very suspended material a turbidity channel is meant to report. If the online probe sits after a filter and the laboratory sample is taken before it, the two numbers describe different water by design. Record the exact sampling point for both paths on the same drawing.
Biofilm and sediment on the optical window raise apparent values slowly. A weekly downward step after cleaning, followed by a gradual climb, is the classic fouling signature. Log each cleaning as a dated event and keep the raw series; smoothing the drift away removes the evidence needed to set a cleaning interval.
Electrical and exposure conditions matter too. A probe with an unfitted module can still return a default register value that looks like a measurement, so list the fitted channels and their ranges on the sampling schematic. Check supply voltage at the probe with the pump running, and note immersion depth against the lowest expected water level; a window that breaks the surface during low flow returns a step, not a concentration change.
When the response-time budget is tighter than the time needed to collect, transport and prepare a sample, wastewater monitoring cannot confirm an event from an online estimate alone. Write that budget into the alarm design, and let the online channel trigger sampling rather than declare a breach.
An online value also cannot stand alone where a discharge limit is being assessed. The optical estimate rests on a validated relationship and carries a full-scale error term of 7.5 mg/L over its 150 mg/L span; the 0.1 mg/L reporting increment does not establish low-level discrimination. The acceptance method and its uncertainty belong in the permit or project specification, not in the sensor datasheet.
Finally, do not apply a bias correction derived from a handful of paired samples to a whole month without stating the paired coverage. A correction that fits 16 pairs may be valid for the conditions on those 16 days and wrong for a storm event on the seventeenth.
Q1. Why did the online reading say 42 mg/L and the lab say 31 mg/L?
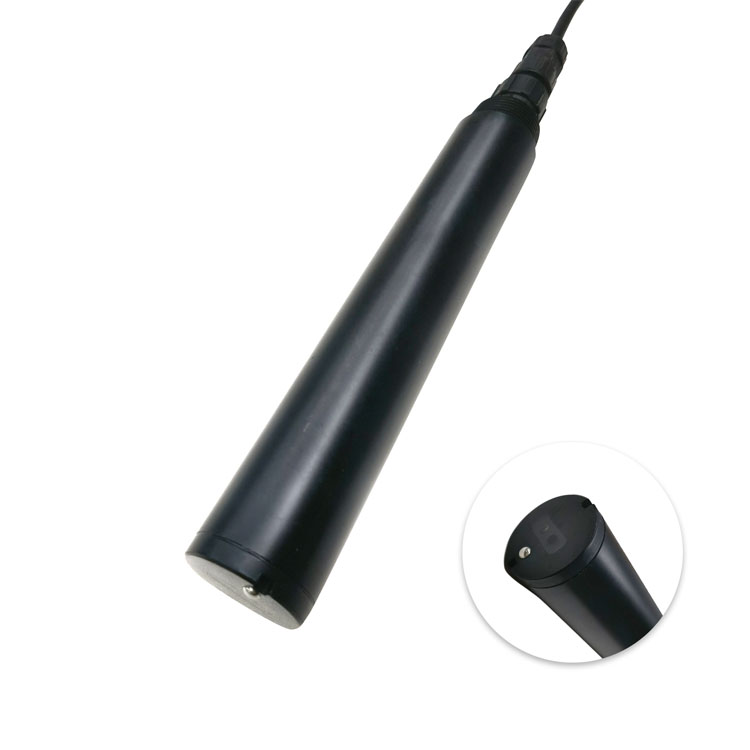
Figure 3. NBL-WQ-TS Online Turbidity Water Quality Sensor.
They sample different water at different times under different methods. The online channel is an optical relationship associated with fluorescent organic matter; the grab sample is a discrete volume taken ten minutes later with transport and preparation. The 7.5 mg/L full-scale error across the 150 mg/L span is smaller than the 11 mg/L gap, so sampling time, representativeness and turbidity compensation also need checking before the difference is called a fault.
Q2. Does 0.1 mg/L resolution mean the probe can detect a 0.1 mg/L change?
No. In wastewater monitoring, a 0.1 mg/L display step cannot resolve small changes when the channel carries a 7.5 mg/L full-scale error across its 150 mg/L span. Resolution is a reporting digit; the error term and the validated relationship set what the value can support.
Q3. What is data validity and why is it better than uptime?
In wastewater monitoring, data validity counts intervals where the online value, sample condition and timestamp source are all recorded. In the worked month, 43,200 one-minute intervals lost 1,440 to calibration, 2,880 to a blocked line and 720 to transport gaps, leaving 38,160 valid, or 88.3%. A running pump with a clogged intake has high uptime and low validity.
Q4. Can I correct the whole online series from a few lab comparisons?
State the paired coverage first. In the worked example, four grab samples per week give 16 pairs against 38,160 valid intervals, or 0.04% paired coverage. A correction fitted to 16 pairs may not describe a storm event on another day. Record the number of pairs with any corrected dataset.
Q5. Does the lab preparation method affect comparability?
Yes. A laboratory BOD determination incubates a diluted sample at 20 °C for five days and uses the dissolved-oxygen difference; settling or filtration removes material the online optical channel sees. The two paths have different timescales and different sample fractions. Document both preparation paths on one schematic.
Q6. Should a flat online line be treated as a stable process?
No. A pump that loses prime, an intake that clogs or a filter that blinds leaves a stagnant volume at the probe, producing a plausible constant reading. Log pump state and cleaning events, and treat a flat line followed by a drop after cleaning as a fouling signature rather than a clean process.
Wastewater monitoring is defensible when the continuous series and the laboratory result are stored as two related but different measurements. The 42 versus 31 mg/L afternoon was not a malfunction until the sampling points, timing and methods were written down. Compute validity from the event log, report paired coverage before applying any correction, and log pump state and cleaning as dated events.
Before the first value is accepted, ask for the sampling schematic and the online method's validated relationship — those two lines decide whether a difference is a change in the water or a change in how it was measured.
Two records, one decision
Wastewater monitoring needs the online series and the laboratory result kept as separate records. In the worked afternoon the online estimate read 42 mg/L and the laboratory method 31 mg/L, an 11 mg/L gap that is larger than the 7.5 mg/L full-scale error but smaller than the combined uncertainty once sampling time and turbidity compensation are included. With 88.3% valid intervals, uptime alone would have hidden the blocked intake and calibration losses. Write the response-time budget into the alarm design, let the online channel trigger sampling, and report data validity beside the concentration.
Reconciling online and laboratory wastewater results? Leave the sampling point, response-time budget and paired results on our contact page, and our engineers will help you separate the error terms from the sampling differences.
Prev:Outdoor PM2.5 Sensor: Low-Level Accuracy at 81% RH
Next:no more
Related recommendations
Sensors & Weather Stations Catalog
 Agriculture Sensors and Weather Stations Catalog-NiuBoL.pdf
Weather Stations Catalog-NiuBoL.pdf
Agriculture Sensors Catalog-NiuBoL.pdf
Water Quality Sensor Catalog-NiuBoL.pdf
Related products
 Combined air temperature and relative humidity sensor
 TDR Soil Moisture & Temperature Sensor for irrigation| RS485 |4-20mA| NBL-S-THR
 Soil pH sensor RS485 soil Testing instrument soil ph meter for agriculture |NBL-S-PH
 Wind Speed sensor Output Modbus/RS485/Analog/0-5V/4-20mA
 Tipping bucket rain gauge for weather monitoring auto rainfall sensor RS485/Outdoor/stainless steel
 Pyranometer Solar Radiation Sensor 4-20mA/RS485


Screenshot, WhatsApp to identify the QR code
WhatsApp number:+8615367865107
(Click on WhatsApp to copy and add friends)

