





— Blogs —
—Products—
 Consumer hotline +8618073152920
WhatsApp:+8615367865107
Address:Room 102, District D, Houhu Industrial Park, Yuelu District, Changsha City, Hunan Province, China
Product knowledge
Time:2024-05-03 11:51:09 Popularity:1725
Quick answer: Weather station data can support decisions throughout a crop cycle, but the relevant measurement changes by stage. Planting may depend on soil and air temperature, vegetative growth on water balance, flowering on heat or frost risk, and harvest on rainfall and drying conditions.
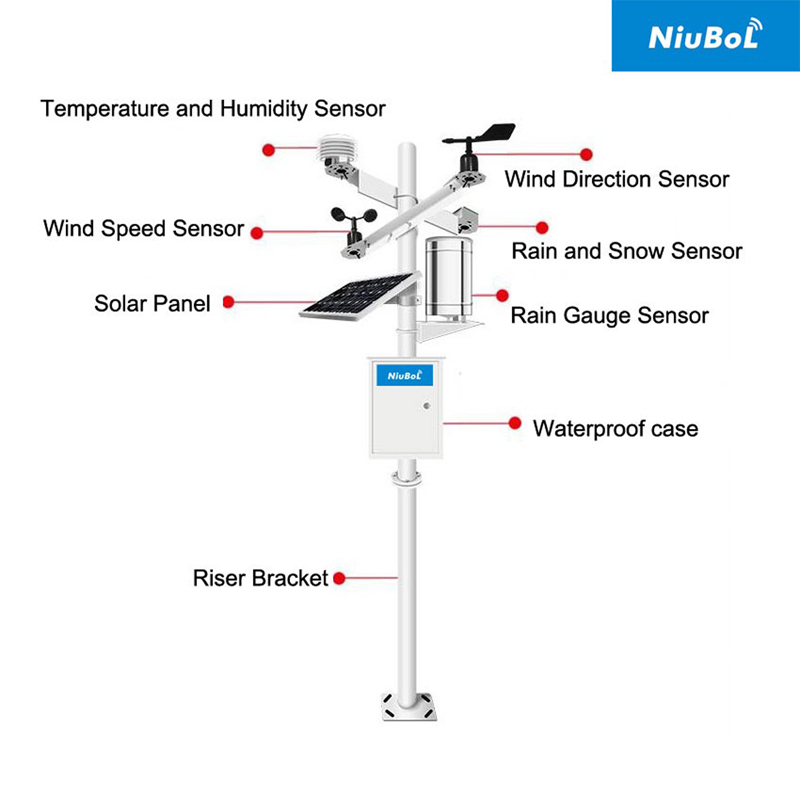
A farm does not need every available sensor to answer its next operational question. It needs measurements that describe the crop's current exposure, taken where that exposure occurs. A station beside the farm office may describe regional weather reasonably well while missing a colder orchard hollow or the wetter soil in a separate irrigation block. For crop growth cycle monitoring, define the field, planting date, variety and observed development stage alongside each station record.
| Crop stage | Useful observations | Decision and limitation |
|---|---|---|
| Pre-planting and sowing | Soil temperature at sowing depth, soil moisture, recent rainfall | Review seedbed conditions and access; air temperature alone does not describe the seedbed. |
| Vegetative growth | Air temperature, RH, solar radiation, wind, rainfall and root-zone moisture | Review atmospheric demand and water depletion; rainfall is not identical to effective root-zone recharge. |
| Flowering and fruit set | Duration of temperature extremes, humidity and wind | Identify periods needing inspection or protection; thresholds depend on crop and stage. |
| Maturity and harvest | Rain timing, humidity, temperature and wind | Assess drying and access alongside actual crop maturity and operational constraints. |
Log soil temperature at the intended sowing depth before comparing it with an agronomic sowing criterion. Record depth and placement when installing the probe. A shallow point exposed after cultivation is not comparable with the same probe under a settled seedbed. Use morning and daily trends rather than one warm afternoon reading. Where field traffic is the question, inspect soil condition directly: a moisture reading at one point cannot certify that machinery can cross the entire field.
A daily maximum says little about how long flowers were exposed to heat. Preserve shorter-interval temperature observations so an agronomist can calculate time above a crop-specific threshold. Likewise, a sheltered air sensor and a sensor close to the canopy answer different questions. An air temperature alarm is not a direct measurement of flower temperature, frost damage or pollen viability. Include the alarm location and persistence period in the action rule.
Rainfall does not show how much water remains in the root zone. Soil sensors help verify infiltration and depletion, while weather data explain atmospheric demand. Their locations and timestamps must be comparable.
For irrigation scheduling with weather data, separate atmospheric demand from the water actually stored around roots. Reference evapotranspiration, ETo, requires a calculation method and suitable weather inputs; it is not a direct sensor output or the amount that must be pumped. Crop coefficients and growth stage then affect crop demand, while rainfall effectiveness, irrigation delivery, runoff and drainage affect the field balance. The FAO root-zone water-balance method treats soil water storage and depletion explicitly rather than equating rainfall with usable water.
As an illustrative field calculation, a volumetric water-content rise of 0.02 m3/m3 across a uniformly affected 0.30 m soil layer represents 0.02 x 0.30 x 1000 = 6 mm of stored water. One probe cannot establish that the full layer changed uniformly, and this is not an irrigation efficiency measurement. Measurements at more than one depth help distinguish a shallow wetting event from deeper recharge. Check the sensor's suitability for the soil before turning that calculation into an automatic irrigation rule.

A NiuBoL agricultural weather station can combine atmospheric instruments with separately located soil probes. The mast does not have to be the location of every measurement. Keep a rainfall collector clear of overhead obstruction, expose the air sensor away from artificial heat, and place soil probes in representative management zones. A greenhouse needs its own internal observations; an outdoor station cannot substitute for conditions beneath a closed roof.
| Example component | Relevant specification | Consequence for crop records |
|---|---|---|
| NBL-W-LBTH air temperature | -40 to 80 degrees C; +/-0.5 degrees C; 0.1 degree C resolution | Resolution is finer than stated accuracy; do not interpret every 0.1 degree change as a certain biological difference. |
| NBL-W-LBTH relative humidity | 0-100% RH; +/-5% RH; 0.1% RH resolution | A near-saturation reading does not directly establish leaf wetness. |
| NBL-W-LBTH interface | 12-24 V DC; RS485 / Modbus RTU version or 4-20 mA output option | Order the interface required by the logger; do not assume both outputs are fitted. |
| NBL-W-HPRS solar radiation | 0-2000 W/m2; 0.3-3 um spectral range; response time up to 35 seconds to 99% | Provides solar irradiance for weather records; it does not directly measure photosynthetic photon flux. |
| NBL-W-SS speed and NBL-W-DS direction | Separate wind instruments; IP65 | Specify exposure and sampling for the intended farm operation, not simply a mast height shared by all sensors. |
| Soil and leaf channels | Depth, range, soil compatibility and output depend on selected probe | Select for the crop question; do not copy the air sensor's limits or protection rating. |
Supply capacity, sensor power demand, cable jacket material and enclosure protection must be checked for the assembled station. A sensor's DC voltage rating does not determine battery autonomy. For a remote farm, include logger, modem and any heaters in the load calculation, then size solar charging for the local low-sun period. Specify cable routing around cultivation, mowing and seasonal removal so a sound measurement plan does not become a repeated cable-repair job.
For a simple growing-degree-day calculation, an agreed daily method may use max(0, (Tmax + Tmin)/2 - Tbase). If Tmax is 26 degrees C, Tmin is 14 degrees C and the selected base is 10 degrees C, that method gives 10 degree-days. This is an illustrative arithmetic example, not a universal crop base temperature. Some crop models use upper limits or different integration methods. Changing the method halfway through a season makes accumulated totals difficult to compare.
Define each day's time boundary and treatment of missing observations before calculating minima, maxima, heat hours or rainfall. An offline logger that uploads yesterday's readings this morning must preserve their original observation times. Otherwise, a delayed upload can appear as today's storm or temperature event. For rain gauges, retain cumulative counts or event records where supported, and identify resets so the daily total does not become negative or include two days.
Thresholds depend on crop, variety, growth stage and local practice. The station records conditions; agronomic rules determine the response. Alarm logic should include persistence or averaging where a single short spike would cause an unnecessary action.
Crop-stage weather alerts should name an action and a responsible person. A high-temperature warning during flowering may trigger canopy inspection; a rainfall alert before harvest may prompt a revised work schedule. Neither proves damage. Separate measured current conditions from forecast information: a station reports what has happened at its sensors, not the future arrival time of a storm. Spray decisions also require the pesticide label, local rules and actual field conditions, not a generic wind threshold.
Canopy growth, irrigation patterns and seasonal shade can alter exposure even when the instruments stay in place. Photograph the site at installation and after major canopy changes. If a sensor is moved above a growing crop, record the old and new height and the date. A temperature step after relocation should not be mistaken for a sudden crop response. For soil probes, retain zone, depth, row position and distance from the emitter.
RS485 / Modbus RTU connects compatible sensor versions to a logger, RTU or PLC; it does not identify the crop variety, field or irrigation zone automatically. Give the platform a stable station identifier and separate channel names such as air temperature and soil temperature at a recorded depth. Bench-test each device address and engineering scale before combining the bus. Bring acquisition time, communication status and maintenance flags into the farm database with the value.
At the end of the season, compare weather events, irrigation, field operations and yield by management zone. The objective is not to claim that weather data alone caused an outcome, but to identify repeatable conditions for the next plan.
Look for flat lines, impossible jumps, missing periods and disagreement between nearby measurements. A blocked rain gauge may report zero during a known storm; a moved soil probe can create a sudden baseline change. Annotate maintenance and field operations so these events are not mistaken for crop behavior.
Keep the raw record used for daily minimum, maximum or accumulation calculations. Historical inputs can then be reviewed if a crop model changes.
See NiuBoL automatic weather stations for configurable crop-monitoring systems.
Before buying additional stations, compare the decisions that differ between zones. A slope exposed to wind and a sheltered block may need different atmospheric points; adjacent irrigation zones on different soils may chiefly need additional soil measurements. Ask NiuBoL to review a field map, crop calendar, existing logger inputs and the decisions currently delayed by missing observations. That gives a more useful configuration discussion than requesting the largest sensor package.
No. Rain, humidity and temperature help assess access and drying risk, but harvest also depends on maturity measurements, quality targets, labor and equipment. Keep the weather record as one input to the decision rather than treating an alarm as proof that the crop is ready.
Not automatically. Compare the event with root-zone response, irrigation already delivered and the crop's current demand. Runoff, uneven rainfall and shallow wetting can leave deeper roots dry. A representative soil profile is more informative than a rainfall total alone.
It can provide a shared atmospheric reference where exposure is comparable. It cannot establish identical soil storage, frost exposure or canopy conditions across all blocks. Add measurement points where a different condition would change an actual management decision.
Choose it from the calculation: daily totals may suit seasonal rainfall review, while short heat events need finer observations. Store sufficient detail locally to recompute the required statistic. Upload frequency can be slower than measurement frequency if the logger preserves timestamps and valid records.
No. Lux is visually weighted light, solar irradiance is measured in W/m2, and leaf wetness is a separate surface condition. Select the measured quantity required by the crop model; a shared RS485 connection does not make these channels interchangeable.
Provide crops and stages, field and irrigation-zone maps, intended calculations, existing acquisition equipment and site access constraints. Identify which decisions require local alarms and which only need historical reports. Sensor count, mounting and communication can then follow those requirements.
Weather station data becomes useful when it is organized by crop stage and linked to documented field actions. Preserve the distinction between atmospheric demand, soil storage and observed crop condition. A station that supports a specific sowing, irrigation or harvest decision is more useful than a larger set of channels with no agreed interpretation.
Related recommendations
Sensors & Weather Stations Catalog
 Agriculture Sensors and Weather Stations Catalog-NiuBoL.pdf
Weather Stations Catalog-NiuBoL.pdf
Agriculture Sensors Catalog-NiuBoL.pdf
Water Quality Sensor Catalog-NiuBoL.pdf
Related products
 Combined air temperature and relative humidity sensor
 TDR Soil Moisture & Temperature Sensor for irrigation| RS485 |4-20mA| NBL-S-THR
 Soil pH sensor RS485 soil Testing instrument soil ph meter for agriculture |NBL-S-PH
 Wind Speed sensor Output Modbus/RS485/Analog/0-5V/4-20mA
 Tipping bucket rain gauge for weather monitoring auto rainfall sensor RS485/Outdoor/stainless steel
 Pyranometer Solar Radiation Sensor 4-20mA/RS485


Screenshot, WhatsApp to identify the QR code
WhatsApp number:+8615367865107
(Click on WhatsApp to copy and add friends)

