


— Blogs —
—Products—
 Consumer hotline +8618073152920
 WhatsApp:+8615367865107
Address:Room 102, District D, Houhu Industrial Park, Yuelu District, Changsha City, Hunan Province, China
Product knowledge
Time:2025-10-15 15:17:40 Popularity:1178
In today's era of increasingly scarce water resources, traditional water utilities monitoring remains stuck in manual inspections or wired wiring stages, leading to frequent issues like data delays, high operation and maintenance costs, and sluggish fault responses. According to the latest market analysis, the global IoT water treatment systems market is expected to start at $2.6 billion in 2025 and expand to $7.1 billion by 2034 with a compound annual growth rate (CAGR) of 11.8%. This wave is driving urban water supply, flood control and drought resistance, and agricultural irrigation sectors from "passive response" to emergencies toward "proactive management" and "predictive maintenance."
Building a smart water system monitoring system is the core path of this transformation. It integrates high-precision IoT sensors, wireless communication technologies, and cloud-based intelligent analysis to achieve 24/7 real-time remote monitoring of water tanks, rivers, or reservoirs. Managers no longer need to rush around; instead, they can grasp the overall dynamics with one click via a mobile app or dashboard—from level fluctuations to potential leak warnings, fully empowering decision-making. Especially in 2025, with the deepening of 5G edge computing and AI algorithms, system accuracy can reach millimeter level, reducing leak rates by over 20%.
An efficient system is like a precision building, supported by a solid three-layer architecture. The following details the key elements of each layer, ensuring seamless connectivity from perception to decision-making.
Front-End Perception Layer: Sensors—The "First Sentinel" of Data
This layer serves as the "eyes and ears" of the entire system, responsible for collecting multi-dimensional data such as level, flow, and water quality. Core devices include:
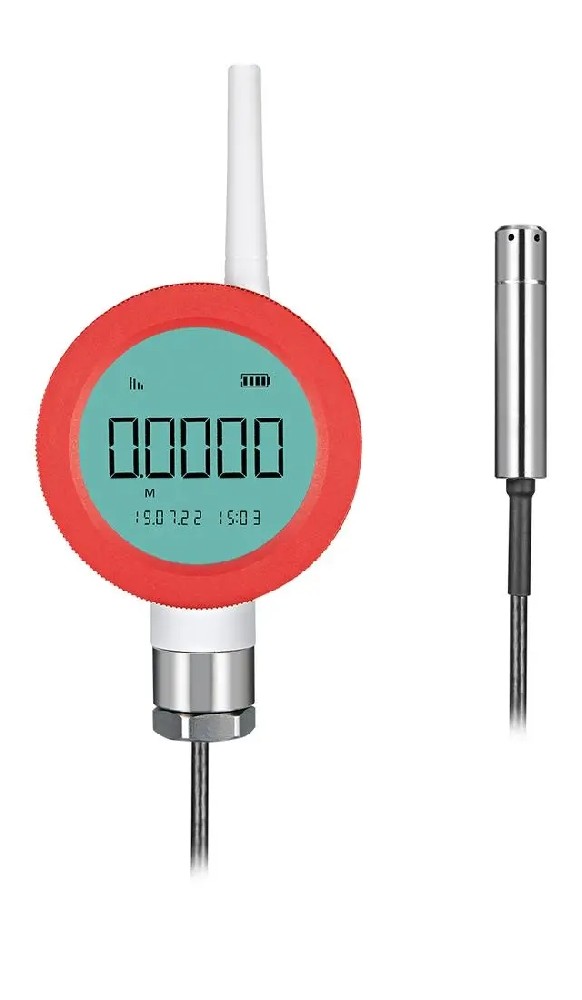
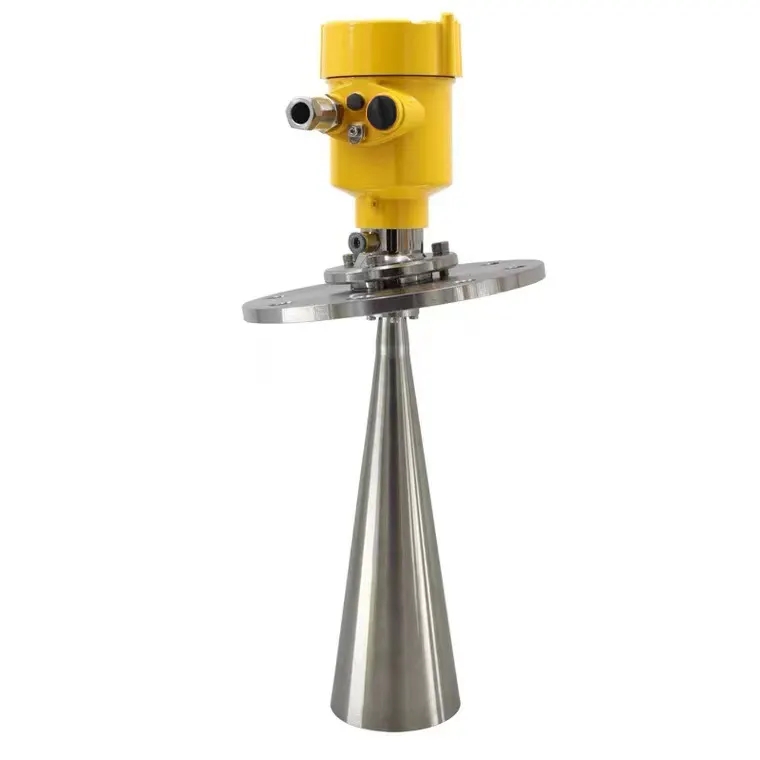
- Level sensors: Hydrostatic types suitable for deep wells (accuracy ±0.5%, high-pressure resistant); ultrasonic types preferred for non-contact scenarios (blind zone as small as 5cm, suitable for foamy liquid surfaces).
- Water quality sensors: Integrated probes for dissolved oxygen (DO), pH, and turbidity, enabling multi-parameter synchronous monitoring to avoid "data silos" from single level data.
- Optimization suggestions: Choose IP68-rated waterproof modules with built-in self-diagnostic functions (e.g., signal strength self-check) to ensure stable operation for over 3 years in humid or corrosive environments.
After data collection, how to efficiently transmit it to the cloud? Low-power wide-area network (LPWAN) technology is key. The following table compares mainstream options to help you make precise selections:
| Technology | Advantages | Disadvantages | Applicable Scenarios |
| NB-IoT | Deep coverage (strong underground penetration), high capacity support (thousands of devices per base station), worry-free operator maintenance; market size expected to reach $14.69 billion in 2025. | Slightly higher power consumption (optimize upload frequency), dependent on network coverage. | Urban pipe networks, municipal water tanks, dense monitoring points, such as fire pools in commercial complexes. |
| LoRa/LoRaWAN | Ultra-low power consumption (battery life 5-10 years), transmission distance over 10km, private deployment possible; suitable for IoT applications in water resource management. | Requires self-built gateways, limited data capacity (suitable for low-frequency uploads). | Remote mountain reservoirs, farmland irrigation, deep well monitoring, such as the University of the Philippines campus water utilities project. |
| 4G/5G | High bandwidth, low latency (<10ms), supports video/big data backhaul. | High power consumption and cost, not suitable for massive deployments. | Core pump stations, large water plants for HD monitoring and instrumentation integration. |
When selecting, prioritize coverage range and power consumption: NB-IoT for urban areas, LoRa for rural ones.
Once data reaches the cloud, its value truly explodes. This layer focuses on storage, analysis, and output:
- Data processing: Use edge computing for pre-filtering noise, ensuring 99.9% transmission success rate.
- Visualization and analysis: Integrate GIS maps, real-time curves, and AI predictive models to track water consumption trends.
- Expansion potential: Supports Modbus/OPC protocols for integration with SCADA systems, achieving full-stack automation.
Simply collecting data is akin to "waiting idly for game." The essence of smart systems lies in turning insights into immediate responses.
- Threshold alarms: When level exceeds overflow (upper limit) or falls below safety line (lower limit), the system pushes SMS/email/App notifications in <5 seconds. Combined with IoT real-time monitoring, response time can be shortened from hours to minutes.
- Trend warnings: AI algorithms analyze drop rates—if level drops >2cm/h during non-peak periods, alert for potential pipe bursts, preventing large-scale leaks.
- Fault self-diagnosis: Sensor signal anomalies (e.g., reading jumps) trigger device alarms, linking to backup channels to avoid single points of failure. In actual deployments, this mechanism can improve fault detection rates to 95%.

Use open-source/commercial platforms like ThingsBoard or custom dashboards to achieve:
- Real-time dashboards: Level heatmaps, flow bar charts, color-coded anomalies (red-yellow-green).
- Historical trends: Curve graphs tracking monthly water consumption, supporting PDF/Excel report exports.
- GIS integration: Map overlays for monitoring points.
These features are not just visually appealing but drive decisions: Managers can optimize water supply scheduling accordingly, achieving 15-20% water savings.

A chain mall group deployed over 20 distributed fire water tanks, facing challenges like weak underground signals and high inspection frequency (3 times weekly). NiuBoL solution: Each tank equipped with hydrostatic sensor + NB-IoT terminal, uploading level/temperature data every 15 minutes. The platform sets dual thresholds (95% warning, 85% alarm), integrated with SMS pushes.
Results: Inspection manpower reduced by 80%; during one pump fault, the system alerted at 88% level, enabling hazard repair within 48 hours. NB-IoT's penetration ensures zero packet loss in basements, with overall ROI exceeding 150% in the first year.
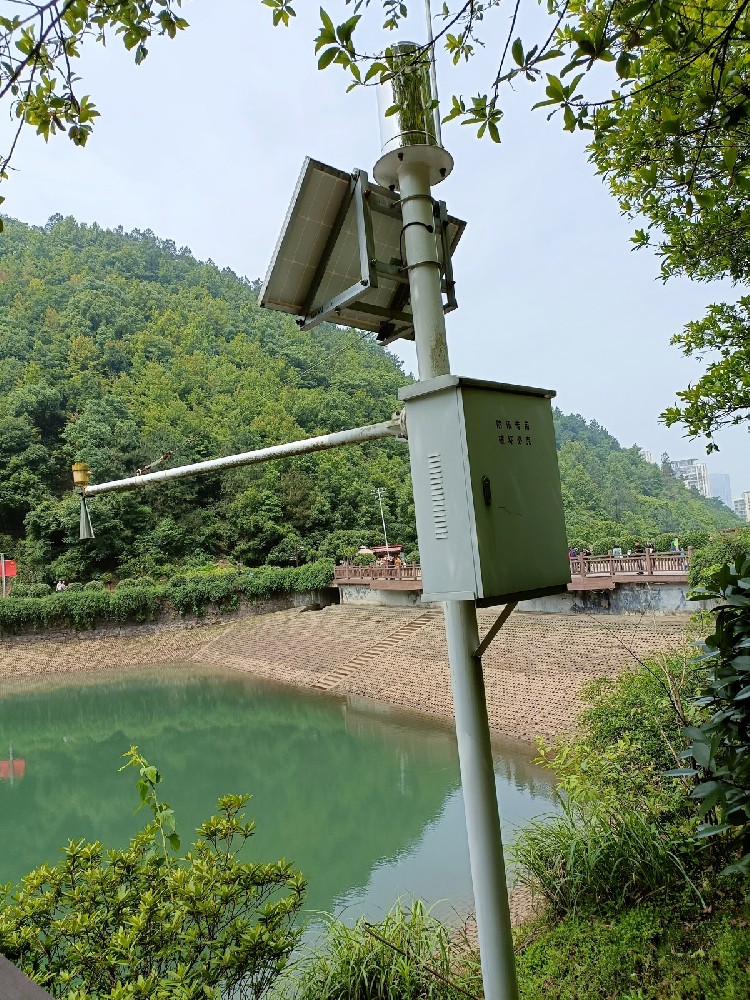
Drawing from a local university project, NiuBoL deployed LoRa gateways + ultrasonic sensors for remote farmland reservoirs. Terminals report hourly, with 3-year battery life. The system warns of drought trends (abnormal level drop rates), linking to app-guided irrigation. Effects: Water utilization rate up 25%, reducing human errors—LoRa's low power consumption proves its status in areas without cellular coverage.
These cases confirm: Choose the right technology, and smart water utilities become "within reach."

With a decade of deep cultivation in water utilities IoT, NiuBoL provides end-to-end solutions: From corrosion-resistant sensors and NB-IoT/LoRa terminals to secure cloud platforms. We emphasize data real-time performance (latency <1s), reliability (MTBF >100,000 hours), and compliance (GDPR/ISO 27001). Beyond hardware, our expert team offers free audits of your water system pain points and custom deployment blueprints.
Call to Action: Don't let data lags hinder operations. Visit the [NiuBoL official website](www.niubol.com) to start your 24/7 smart monitoring journey. Let NiuBoL help you build the "digital defense line" for water resources!

A: NiuBoL terminals are optimized for ultra-low power consumption; under 1-hour upload mode, standard lithium batteries last 3-5 years. Combined with sleep algorithms and solar assistance, extreme scenarios can reach 8 years, far exceeding industry averages.
A: Absolutely feasible. Open APIs and MQTT protocols support one-click integration of level/alarm data, achieving automated closed-loop management. Multiple water plants have verified seamless integration, with efficiency improvements of 30%.
A: LoRa is the top choice—its 10km+ coverage and private gateways free from operator dependency, with power consumption only 1/3 of NB-IoT.
A: Entry-level kits (sensor + terminal) cost about 500 yuan per point; first-year ROI is quickly recouped through reduced inspections/leak prevention. Our ROI calculator can simulate your scenario for free, expecting investment recovery within 2 years.
Still have questions? Contact us via email or hotline for 7x24 response.
Prev:Pool Water Level Sensor Solutions: Types, Installation, and Automated Refill Systems
Next:Top 5 Industrial Applications for Ultrasonic Liquid Level Sensors in Tanks & Silos
Related recommendations
Sensors & Weather Stations Catalog
 Agriculture Sensors and Weather Stations Catalog-NiuBoL.pdf
Weather Stations Catalog-NiuBoL.pdf
Agriculture Sensors Catalog-NiuBoL.pdf
Water Quality Sensor Catalog-NiuBoL.pdf
Related products
 Combined air temperature and relative humidity sensor
 Soil Moisture Temperature sensor for irrigation|NBL-S-THR
 Soil pH sensor RS485 soil Testing instrument soil ph meter for agriculture |NBL-S-PH
 Wind Speed sensor Output Modbus/RS485/Analog/0-5V/4-20mA
 Tipping bucket rain gauge for weather monitoring auto rainfall sensor RS485/Outdoor/stainless steel
 Pyranometer Solar Radiation Sensor 4-20mA/RS485

Screenshot, WhatsApp to identify the QR code
WhatsApp number:+8615367865107
(Click on WhatsApp to copy and add friends)
