





— Blogs —
—Products—
 Consumer hotline +8618073152920
WhatsApp:+8615367865107
Address:Room 102, District D, Houhu Industrial Park, Yuelu District, Changsha City, Hunan Province, China
Product knowledge
Time:2025-01-14 10:59:47 Popularity:2100
Campus weather station climate lessons should distinguish local weather observations from long-term climate statistics. A few weeks of school data can support useful exercises in daily variation, rainfall totals and measurement quality, but cannot by themselves establish a climate trend. Specify a station and data workflow that let teachers explain that distinction with inspectable records.
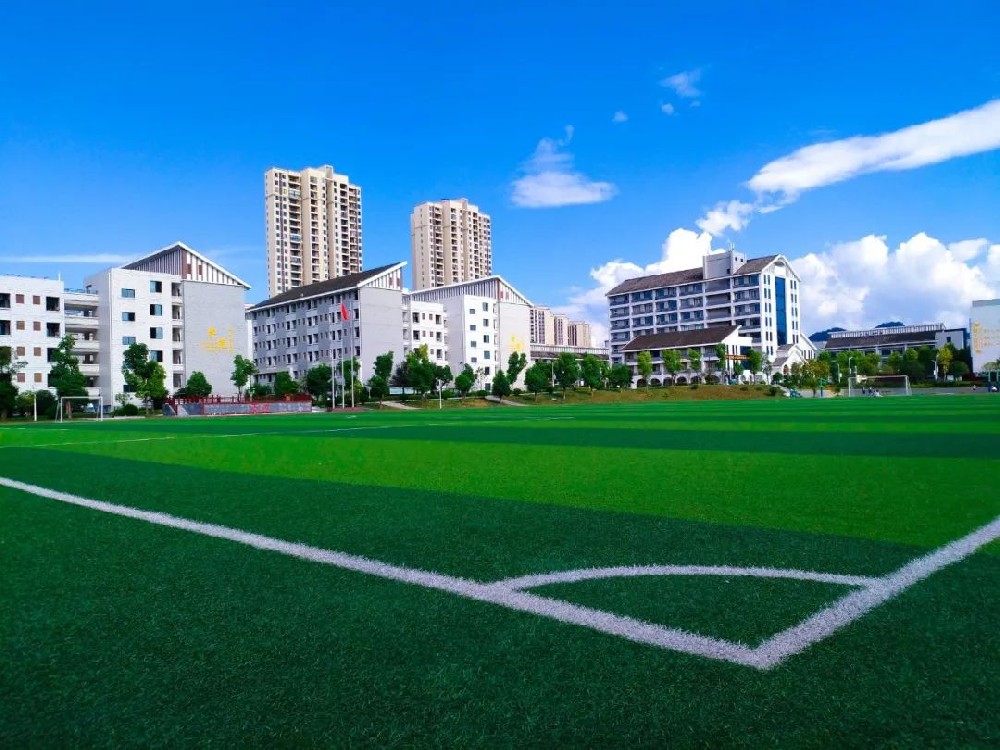
A primary class can compare wet and dry days or identify the warmest observed afternoon in a named week. A secondary class can examine daily ranges, incomplete records or differences between two sites. Neither needs a claim that one school term demonstrates regional climate change. Identifying the limits of the record is part of the lesson.
A campus weather station measures conditions at its installed sensors. Temperature near a sun-heated wall, rainfall beside a building and wind behind trees describe that exposure. They may not represent the wider district. Keep a location description with the class dataset so students can discuss what was actually measured before explaining why it changed.
NOAA's U.S. Climate Normals use a uniform 30-year period for conventional official normals. This provides a useful example of the longer statistical context used to describe typical conditions. It does not mean a school must wait 30 years before doing weather lessons, or that any 30-year unexamined file is automatically a suitable climate reference.
For a school outside the United States, use an appropriate official local or national reference rather than treating a U.S. station as the campus baseline. Note the reference station, dates, elevation where relevant, and variable definition. A classroom exercise can compare observations with a reference while retaining the differences between the two sites.
For example, a school's daily maximum temperature is not directly comparable with a reference monthly mean. A one-week rainfall total is not the same quantity as a typical monthly rainfall total. Align the variable and period before calculating a difference, and label a partial period as partial.

| Observation | NiuBoL component or configuration | Lesson boundary |
|---|---|---|
| Air temperature | NBL-W-LBTH: -40 to 80 C; accuracy +/-0.5 C; resolution 0.1 C | Resolution does not establish the accuracy of a claimed small trend |
| Relative humidity | NBL-W-LBTH: 0-100% RH; accuracy +/-5% RH | Air humidity is not soil water content |
| Barometric pressure | NBL-W-LBTH: 10-1200 hPa; accuracy +/-1.5 hPa | Keep local pressure distinct from sea-level-corrected reference data |
| Rainfall | NBL-W-RS tipping-bucket configuration: 0.2 mm per tip | Accumulation needs a complete period and an agreed reset time |
| Data acquisition | Compatible logger for the ordered sensor outputs | A dashboard chart must retain units, observation time and missing-data status |
The NBL-W-LBTH atmospheric sensor supports an RS485 Modbus RTU version with DC 12-24 V supply. Its radiation shield helps reduce direct solar heating of the sensing elements, but installation near heat sources can still affect the observations. The NBL-W-RS rain gauge provides a separate rainfall channel; do not infer snowfall depth or water balance from that channel alone.
Define what a daily statistic contains. A maximum among readings collected only during school hours is a maximum of those observations, not necessarily the full day's maximum. Similarly, an average of a few classroom readings need not equal the logger's mean from a complete day. State the sampling period and method alongside the result.
Consider an illustrative rainfall exercise with five accepted tips from a 0.2 mm-per-tip configuration. The accumulated reading is 1.0 mm. If the recorder was unavailable during part of the day, the class cannot call that a complete daily total without further evidence. A missing interval is not a period of zero rain.
For temperature comparisons, retain original values and calculate a separate result. Do not edit the original observation to make it agree with a nearby public station. A difference can prompt questions about time, exposure and sensor condition without automatically proving that either record is wrong.
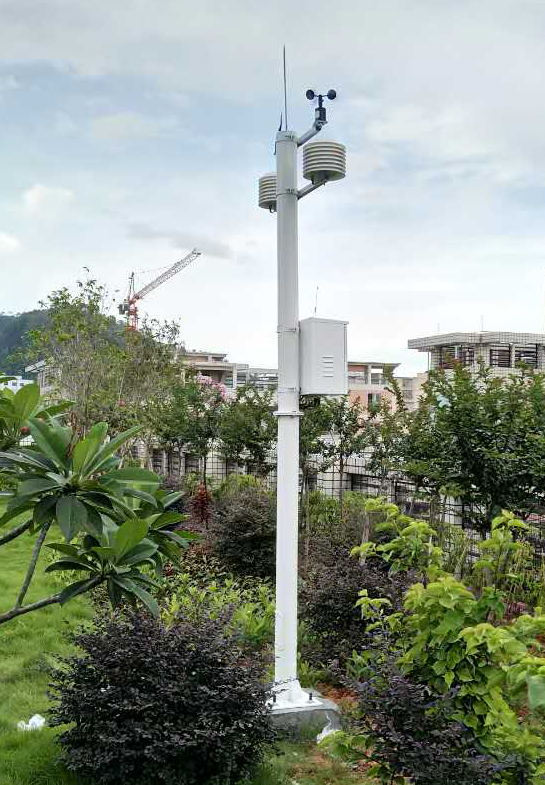
A sensor moved away from a warm building can show a change even if regional conditions have not changed. Tree growth, a new shade structure or a replaced shield can also alter exposure. Keep these events in the station history and show them alongside the chart where they affect interpretation.
Students can compare two observation periods and list plausible explanations, but the available data may not separate them. Reporting that uncertainty is more useful than forcing a conclusion. Avoid drawing a straight line through a short, seasonally changing series and labelling it a long-term warming rate.
Teachers need readable data, exportable records where required and an explanation of daily calculations. Students usually need observation access rather than permission to reset rainfall or change sensor scaling. Confirm the delivered display and software functions instead of assuming every station includes a particular classroom platform.
A school project should identify who maintains the instruments during holidays and who records repairs and moves. Keep supervised learning separate from climbing a mast, opening electrical equipment or conducting an outdoor exercise in hazardous weather. Local observations support learning; they do not replace official forecasts, warnings or the school's weather-safety procedures.
For a NiuBoL enquiry, provide the intended lessons, proposed site photographs, required variables, observation schedule and data-access arrangements. Request a configuration that makes those records understandable and maintainable. Choose additional channels around curriculum questions and the school's maintenance capacity.
Not by itself. It describes observations over that term, affected by weather, exposure and data completeness. Long-term interpretation needs a suitable record and method beyond a short classroom series.
No. Short records can teach measurement, daily variation and responsible comparison. Label the question and period accurately rather than calling every chart a climate trend.
Check the measured quantity, period, elevation, exposure and processing method. Differences do not automatically establish a sensor fault or a local climate effect.
No. Zero is a measurement result, not a missing-data label. Mark gaps and explain how they limit totals, averages and comparisons.
Specify the required variables, units, timestamps, daily-calculation definitions, observation access and maintenance responsibility. Check a real exported or displayed record before accepting the teaching-data workflow.
Campus weather station climate lessons are stronger when they explain what the record can and cannot support. Select suitable sensors, preserve observation context and compare like quantities over defined periods. This makes a school station useful for scientific reasoning without promising conclusions beyond its data.
Prev:Ultrasonic wind speed and direction sensors and their applications
Next:Agricultural IoT Cloud Platform: Monitoring, Control and Traceability
Related recommendations
Sensors & Weather Stations Catalog
 Agriculture Sensors and Weather Stations Catalog-NiuBoL.pdf
Weather Stations Catalog-NiuBoL.pdf
Agriculture Sensors Catalog-NiuBoL.pdf
Water Quality Sensor Catalog-NiuBoL.pdf
Related products
 Combined air temperature and relative humidity sensor
 TDR Soil Moisture & Temperature Sensor for irrigation| RS485 |4-20mA| NBL-S-THR
 Soil pH sensor RS485 soil Testing instrument soil ph meter for agriculture |NBL-S-PH
 Wind Speed sensor Output Modbus/RS485/Analog/0-5V/4-20mA
 Tipping bucket rain gauge for weather monitoring auto rainfall sensor RS485/Outdoor/stainless steel
 Pyranometer Solar Radiation Sensor 4-20mA/RS485


Screenshot, WhatsApp to identify the QR code
WhatsApp number:+8615367865107
(Click on WhatsApp to copy and add friends)

