

— Blogs —
—Products—
 Consumer hotline +8618073152920
WhatsApp:+8615367865107
Address:Room 102, District D, Houhu Industrial Park, Yuelu District, Changsha City, Hunan Province, China
Product knowledge
Time:2026-02-06 17:30:34 Popularity:616
Quick Answer: A farmland weather station combines local weather observations with optional soil and crop-surface measurements. For precision agriculture projects, its value is the ability to distinguish what happened above the field from how the root zone responded. Rainfall is not the same as effective root-zone recharge, high air humidity is not proof of leaf wetness, and a wet soil reading does not measure standing-water depth.
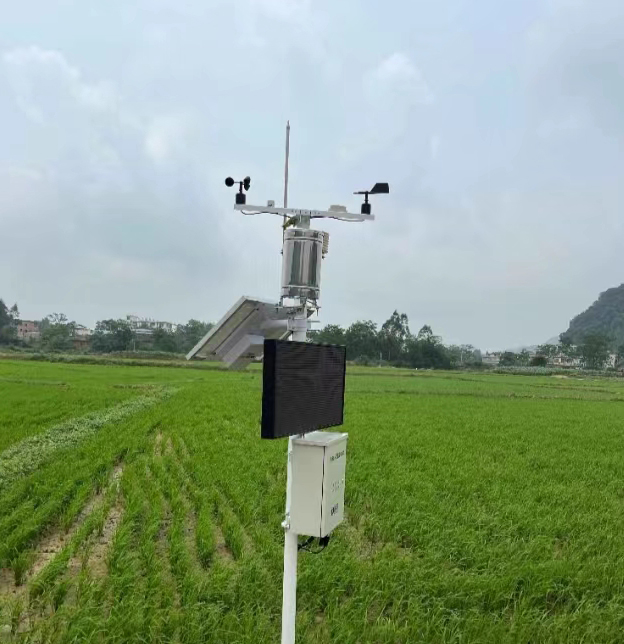
After heavy rainfall, neighboring field blocks can require different actions. One may drain rapidly, another may remain saturated, and a third may receive little useful water beneath a dense canopy. A station at the farm office records one location; it cannot establish that all three blocks experienced the same rainfall or soil response.
Separate the project into an above-ground observation point and the field measurements needed to interpret it. A reference weather station can record rain, air conditions, wind and radiation. Soil probes then observe selected depths in representative management zones. A leaf wetness sensor adds information about the persistence of surface wetting where that is relevant to crop monitoring.
This arrangement avoids purchasing extra weather stations merely to obtain more soil points. It also avoids the opposite mistake: installing one soil probe beside a weather pole and presenting it as the condition of an entire irrigation district. The number of observation points should follow soil variation, drainage, irrigation layout and the decisions made separately for each block.
| Field question | Useful measurement | What it does not establish |
|---|---|---|
| Did rain reach this part of the farm? | Rain accumulation and event timing from a representative collector | The amount stored in the crop root zone or rainfall at every distant block |
| How far did the wetting response extend? | Soil moisture at separately identified depths | Drainage discharge or nutrient mass lost beneath the root zone |
| Is there water above the ground surface? | A suitable water-level point referenced to ground or drain elevation | Soil aeration solely from a level value |
| How long did the canopy remain wet? | A representative leaf wetness sensor and temperature record | A confirmed disease infection or an automatic pesticide recommendation |
| Can the weather record support evapotranspiration estimates? | Appropriately exposed temperature, humidity, wind and radiation inputs | A crop-specific irrigation command without an agronomic water-balance method |
Soil electrical conductivity can help investigate changing salt conditions, but it is not a direct nitrate or fertilizer-concentration measurement. Moisture, temperature and soil contact can also affect conductivity observations. A decrease after rain therefore needs interpretation; it is not, by itself, a measured quantity of nutrient leaching.
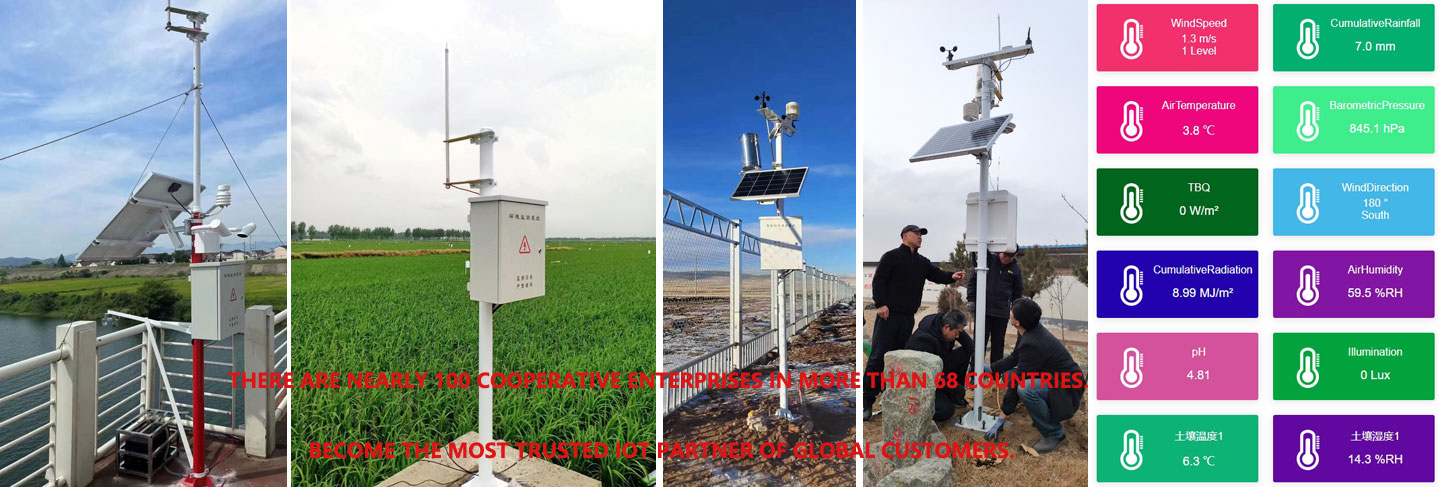
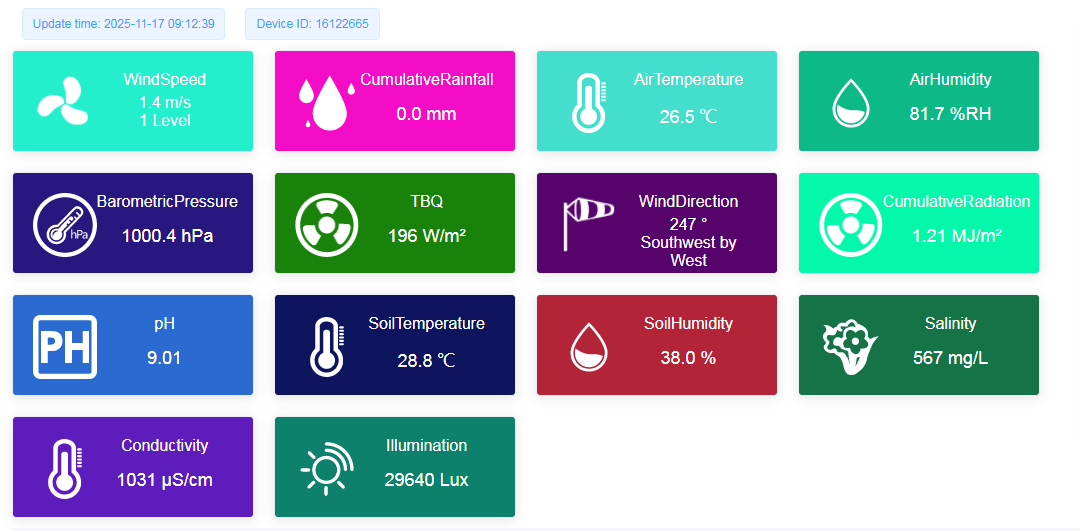
Agricultural dashboards often place rain, air humidity, soil moisture and accumulated radiation beside one another. Their units and time basis must remain visible. A rain total in millimeters and an instantaneous soil-water percentage describe different quantities. Similarly, radiation in W/m2 and energy accumulated over a day cannot use the same label or numerical scaling.
For a soil volumetric water content channel, use VWC or an equivalent soil-water label, not air RH. Associate each trace with its location and depth. A chart that averages a shallow wet point and a deeper dry point can conceal the very information needed to decide whether the irrigation event reached the intended layer.
A valve command is also different from evidence of water delivery. If the project needs to confirm that irrigation occurred, acquire suitable flow, pressure or equipment feedback. Weather observations can explain demand and context, but they do not prove that the pump started or that each emitter delivered water.
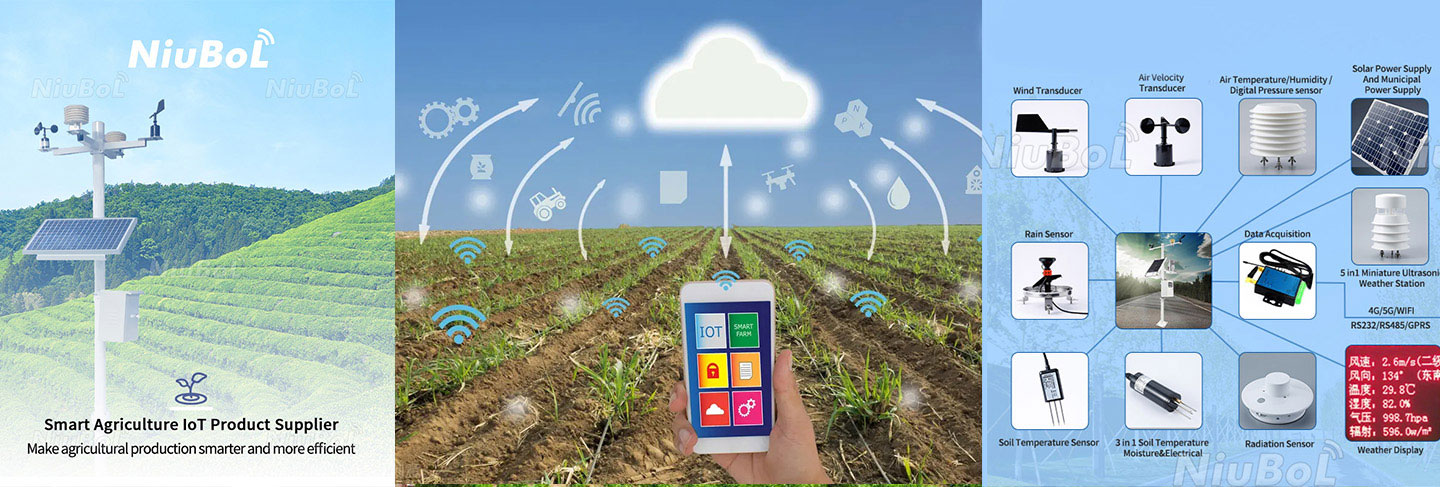
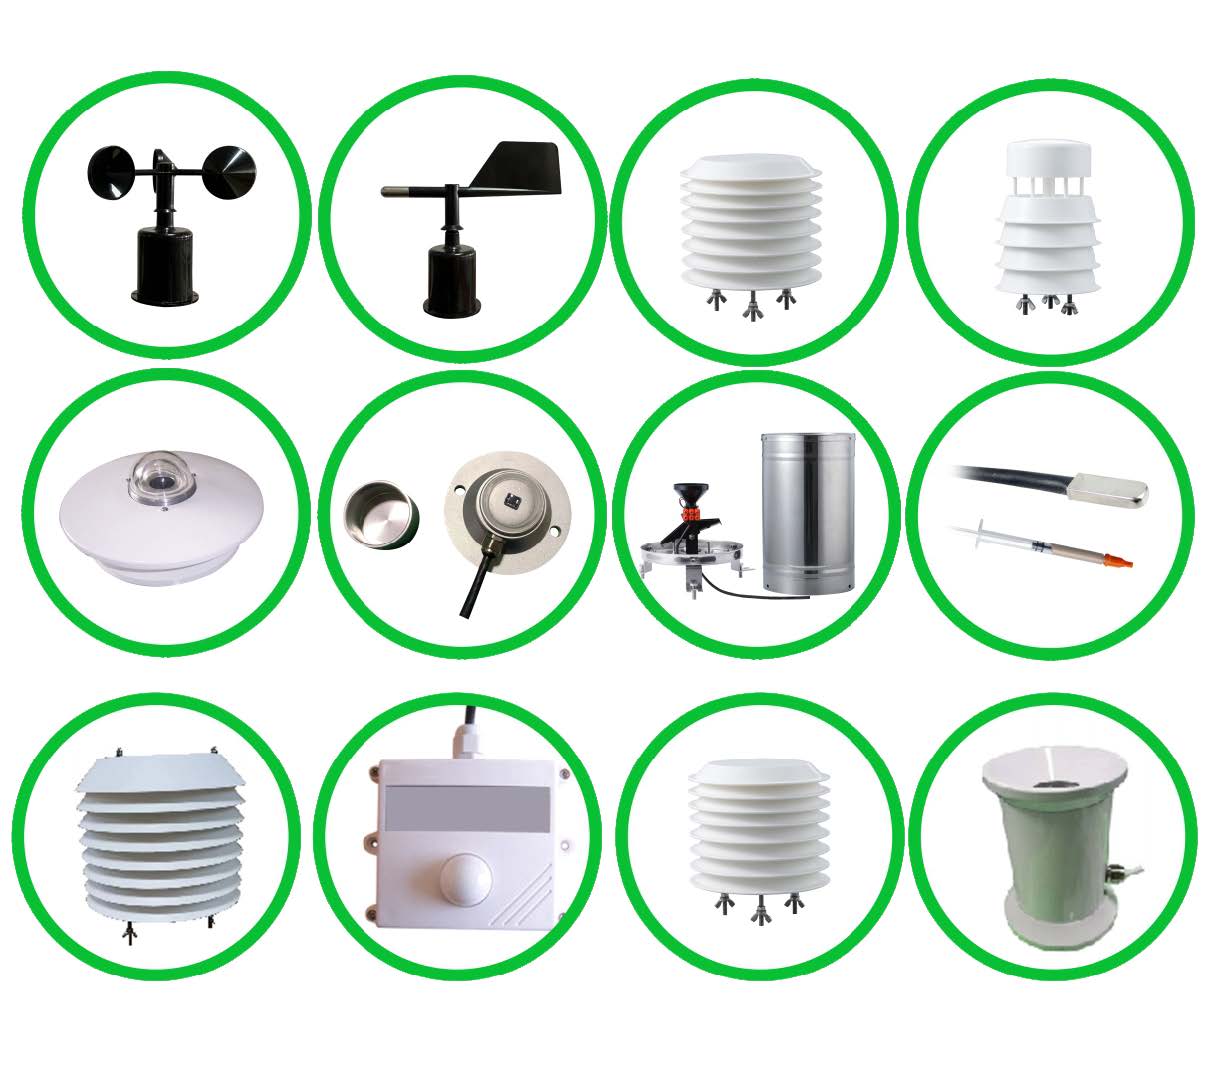
The following NiuBoL components provide a defined basis for a modular farmland weather station. Select only the channels required by the project. Do not combine the most favorable values from different probe versions into a single station specification.
| Component | Measurement specification | Power, interface or exposure condition |
|---|---|---|
| NBL-W-LBTH | Air temperature -40 to +80 degrees C, +/-0.5 degrees C; RH 0-100%, +/-5% RH; pressure 10-1200 hPa, +/-1.5 hPa | 12-24 VDC; select RS485 or the required analog version. Use radiation-shielded, ventilated exposure. |
| NBL-S-THR soil probe | Moisture 0-100%, resolution 0.1%, accuracy +/-3%; temperature -50 to +100 degrees C, resolution 0.1 degree C, accuracy +/-0.5 degrees C | 12-24 VDC; about 0.3 W; selected RS485 Modbus RTU, 4-20 mA or 0-5 V output. Probe IP68; operating environment -40 to +80 degrees C. |
| NBL-W-RS, 0.2 mm rain-gauge version | 0-4 mm/min; +/-4% in an indoor static test at 2 mm/min | Pulse or selected powered-output version. Operating temperature 0-50 degrees C for this unheated configuration. |
| NBL-W-LM crop-surface sensor | Leaf-surface temperature -40 to +80 degrees C, +/-0.5 degrees C; surface wetness response reported on a 0-100 scale | 12-24 VDC; RS485, default 9600 bps; peak consumption 120 mW, standby 72 mW. Establish the wet/dry interpretation for the installation. |
| Separate wind instruments, if required | NBL-W-SS wind speed and NBL-W-DS wind direction | IP65 for the wind sensors; select range and output separately. Do not assign this rating to the complete station cabinet. |
| Field cable assemblies | Rain-gauge standard cable 5 m; other lengths depend on component configuration | Specify jacket material, UV exposure, burial route, rodent risk and joint protection rather than inferring material from length. |
The NBL-W-LM surface-wetness channel should not be read as ambient relative humidity or as the percentage of the crop that is wet. Use its installed response to define wet periods, then apply a crop- and disease-specific method if risk assessment is required. Neither air RH nor a simulated leaf measures infection directly.
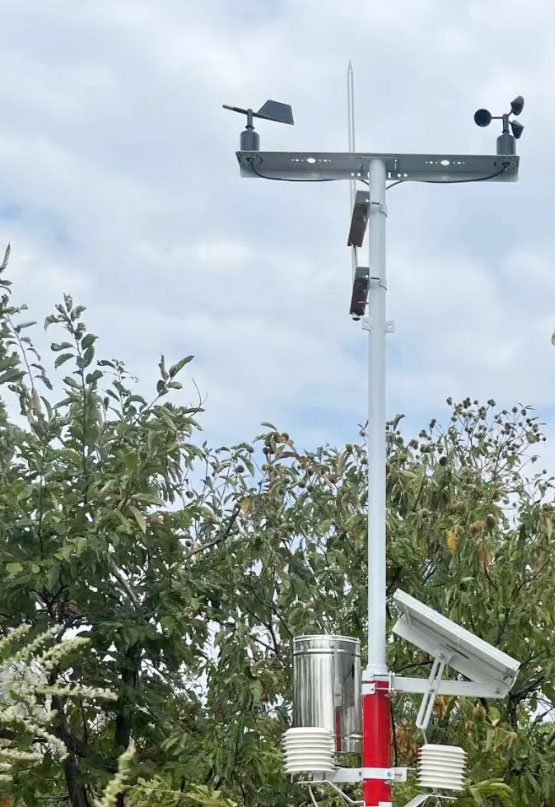
One mounting height cannot satisfy every agricultural measurement. An exposed weather reference and a sensor intended to follow the crop canopy have different purposes. Document those purposes before placing instruments on the same crossarm. Crop growth can shade an initially exposed instrument or change the relationship between a sensor and the canopy.
For reference evapotranspiration, the FAO Penman-Monteith method uses defined weather inputs and reference exposure, including wind at 2 m or an appropriate height conversion. A humidity sensor placed inside a crop canopy is not automatically an interchangeable input. Keep the reference observation separate from any dedicated canopy study.
Place rain collectors away from irrigation spray and obstructions that distort collection. Keep solar panels and supports from shading radiation measurements. Install soil probes with consistent contact at the intended depths and positions relative to crop rows and emitters. A depth selected for shallow-rooted vegetables need not be suitable for a mature orchard.
For drip irrigation, specify the horizontal distance from the emitter as well as depth. A probe inside the wetted bulb and one outside it answer different questions. Record that geometry so a maintenance replacement does not unintentionally create a different measurement point.
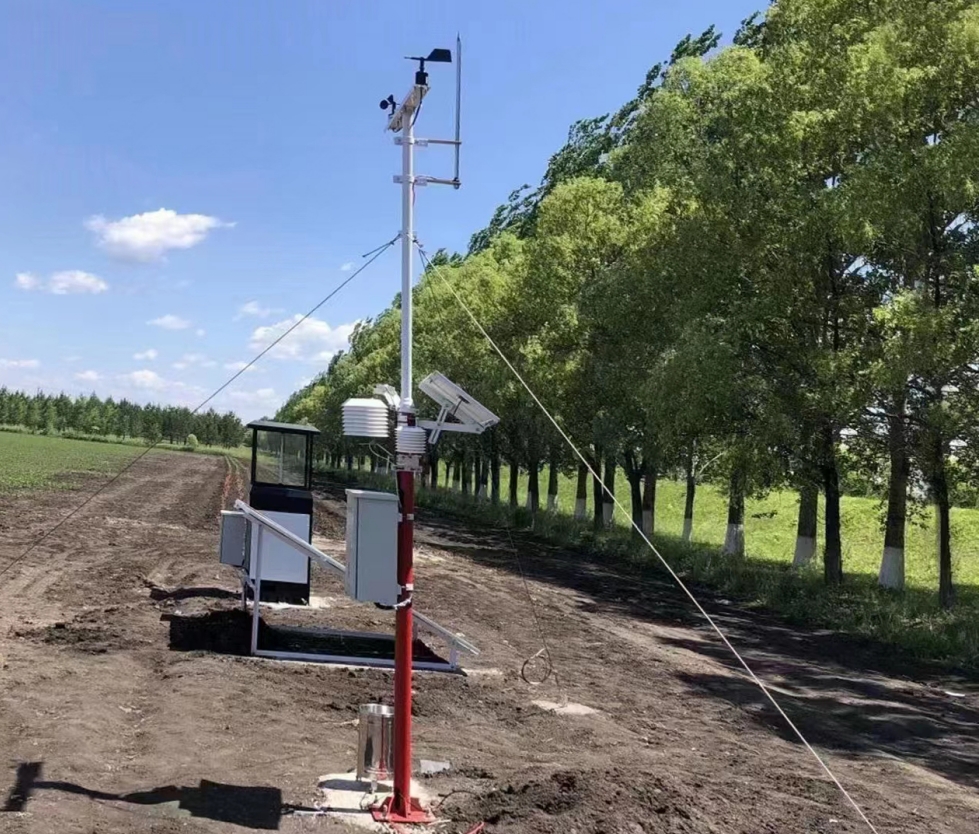
A soil profile can show the sequence of wetting after rain. A shallow response followed by a deeper response is useful evidence at those installed locations. It is not a direct measurement of water movement throughout the whole field, and an apparent absence of change can arise from placement outside the wetted region as well as insufficient infiltration.
Consider this illustrative calculation, not a measured NiuBoL project result: an assumed average VWC increase from 25% to 31% across a 0.30 m soil layer represents 0.06 x 0.30 m = 0.018 m, or 18 mm of additional stored water. A single point reading does not establish that layer average. The calculation also does not account for runoff, evaporation or drainage outside the layer.
Where standing water is the management concern, add a suitable level observation rather than converting a saturated soil reading into ponding depth. Where drainage performance is the concern, observe the relevant outlet or flow. These additions should answer the actual field question, not simply increase the parameter count.
RS485 Modbus RTU is a local acquisition interface for the selected digital sensors. The data logger collects and stores the values. Ethernet, cellular transmission and application protocols belong to the specified communication equipment and software. A serial sensor does not itself provide Modbus TCP, MQTT or a cellular connection merely because those options exist elsewhere in the system.
Bench-test the exact sensor list before field installation. Verify that all required addresses, units and scale factors are handled correctly and that the selected output versions match the logger inputs. For pulse rainfall, confirm counting behavior through a power interruption. For shared RS485, test with the intended cable arrangement rather than only a short bench lead.
Size solar power from the complete load and the site's unfavorable season. Logger operation, modem transmissions and battery losses are separate from probe consumption. Keep charging access and safe maintenance practical; a panel placed deep beneath orchard foliage may not deliver the energy assumed in a clear-sky calculation.
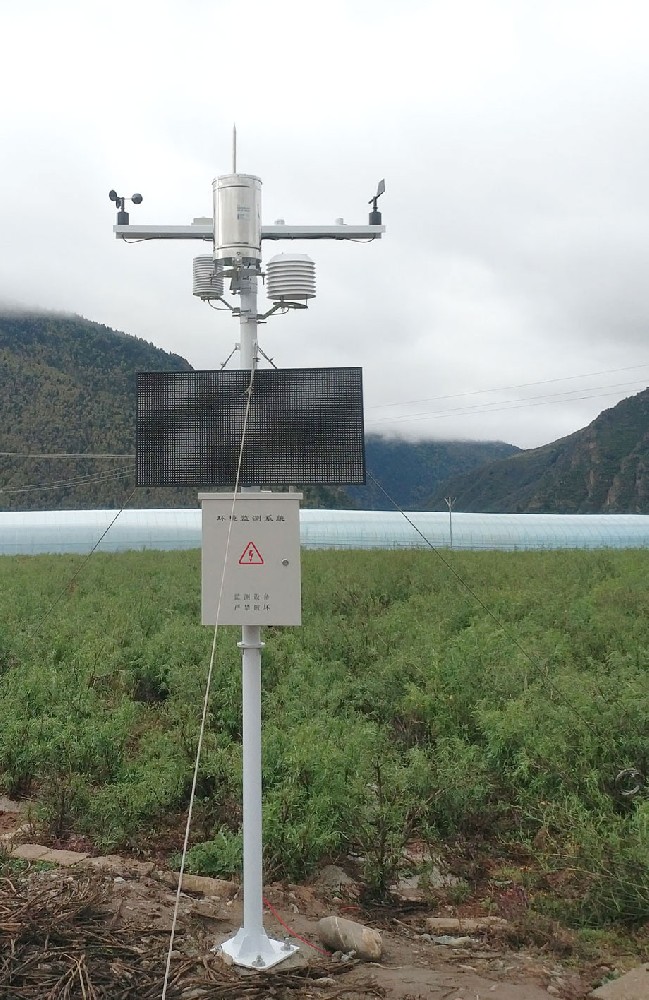
Commissioning should follow an observation from the instrument to its final use. Check rain accumulation periods, soil-depth labels and the time alignment of irrigation events. A successfully updated screen can still show the wrong block or an incorrectly scaled value. Record the configuration so changes remain traceable when a probe is moved or replaced.
During an initial rain or controlled irrigation event, inspect whether the observed sequence is physically credible at the installed locations. Investigate a soil response before irrigation begins, rainfall recorded during sprinkler operation or identical traces assigned to supposedly different depths. These are reasons to check placement or data mapping before changing agronomic thresholds.
To configure a farmland weather station, provide NiuBoL with a field layout, crop and rooting information, required observations, existing irrigation control interface and available power. Indicate which blocks require independent decisions. That gives the sensor and acquisition design a practical basis without promising a particular yield increase or water-saving percentage.
Not necessarily. A suitable reference station can be combined with distributed soil points. Add weather observations where rainfall or exposure differs enough to affect the decisions; do not duplicate every channel merely to add soil coverage.
Not in every case. Rain collected at one location is not the same as water stored in the root zone. Interpret it with soil response and the chosen water-balance method, accounting for the field's drainage and irrigation arrangement.
No. It records a surface-wetting response at the installed sensor. Crop susceptibility, temperature, pathogen presence and a suitable risk model remain separate requirements. Avoid treating wetness alone as a pesticide instruction.
It depends on the question. A single depth can track a defined point; it cannot show the vertical wetting sequence. Select depths around the active root zone and drainage question, keeping each channel identifiable.
No. Conductivity reflects several dissolved ions and is affected by water and temperature conditions. Nutrient-specific loss assessment needs appropriate sampling or analysis and, where mass loss is required, a valid water-flow estimate.
A compatible RS485 Modbus RTU master can read the selected versions when the serial settings and register interpretation match. Remote viewing and irrigation control require the corresponding acquisition and application functions.
Agree the measurement purpose, point locations and depths, output versions, logger inputs, communication route and power scope. Keep crop-reference weather, canopy observations and root-zone measurements distinct in the point list.
A farmland weather station supports precision agriculture when its observations explain a field decision. Combine representative weather with the right soil and crop-surface points, preserve their different units and exposure conditions, and verify how an actual rain or irrigation event appears in the records. More channels are useful only when they resolve a question the project needs to answer.
Prev:Farm Weather Station Irrigation Integration: Check Water Delivery
Next:Ultrasonic Wind Sensor Data: Decode and Average NBL-W-21GUWS
Related recommendations
Sensors & Weather Stations Catalog
 Agriculture Sensors and Weather Stations Catalog-NiuBoL.pdf
Weather Stations Catalog-NiuBoL.pdf
Agriculture Sensors Catalog-NiuBoL.pdf
Water Quality Sensor Catalog-NiuBoL.pdf
Related products
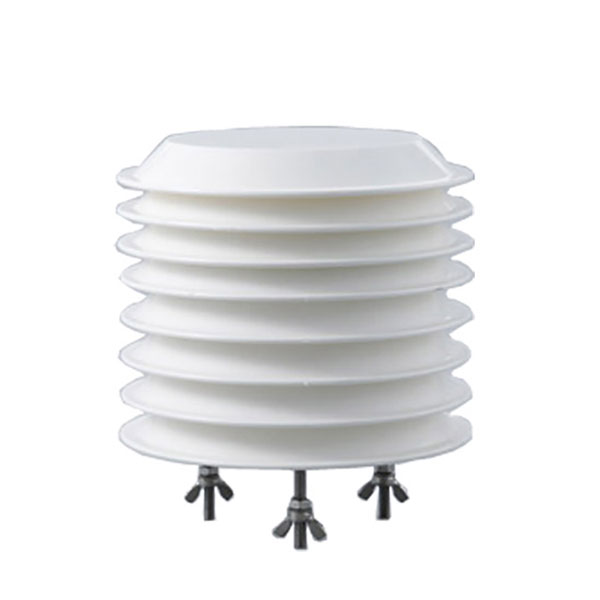 Combined air temperature and relative humidity sensor
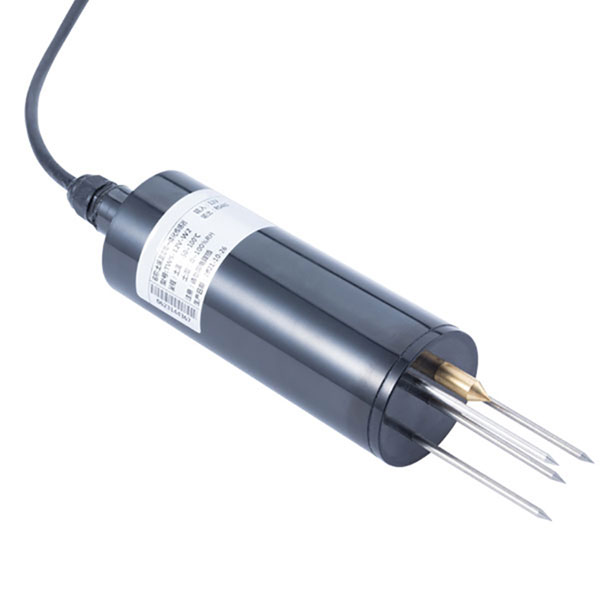 TDR Soil Moisture & Temperature Sensor for irrigation| RS485 |4-20mA| NBL-S-THR
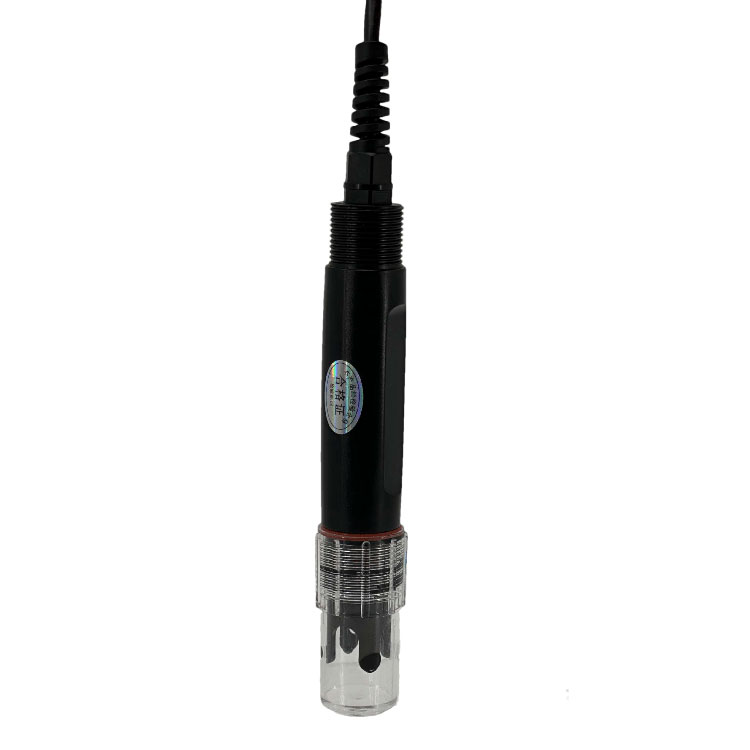 Soil pH sensor RS485 soil Testing instrument soil ph meter for agriculture |NBL-S-PH
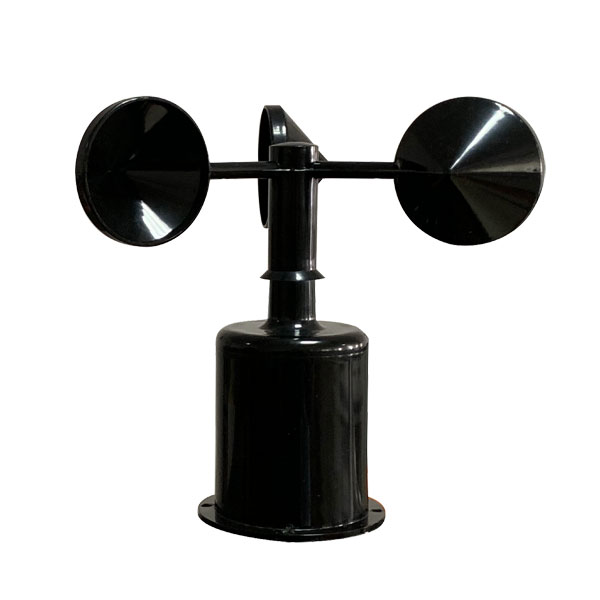 Wind Speed sensor Output Modbus/RS485/Analog/0-5V/4-20mA
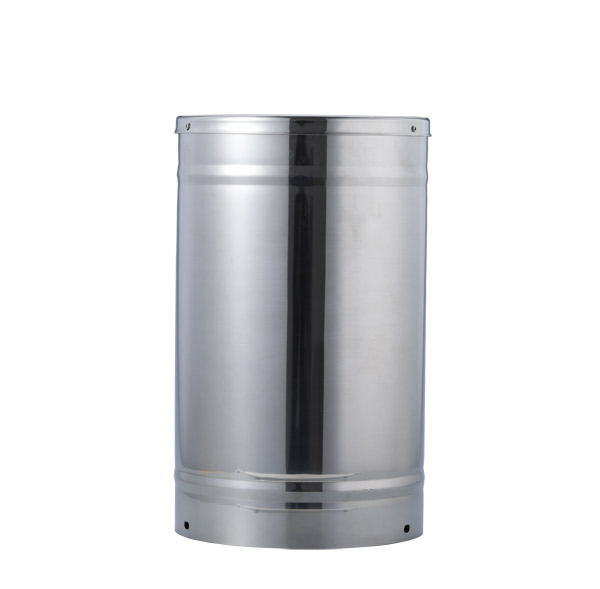 Tipping bucket rain gauge for weather monitoring auto rainfall sensor RS485/Outdoor/stainless steel
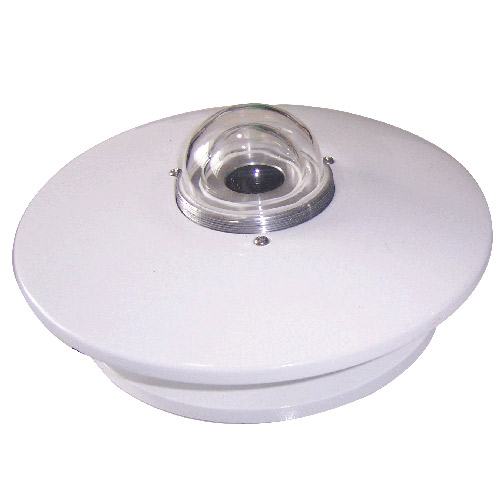 Pyranometer Solar Radiation Sensor 4-20mA/RS485


Screenshot, WhatsApp to identify the QR code
WhatsApp number:+8615367865107
(Click on WhatsApp to copy and add friends)