





— Blogs —
—Products—
 Consumer hotline +8618073152920
WhatsApp:+8615367865107
Address:Room 102, District D, Houhu Industrial Park, Yuelu District, Changsha City, Hunan Province, China
Product knowledge
Time:2025-04-17 17:11:17 Popularity:2096
A leaf temperature sensor must be selected by what its temperature channel actually measures. The NiuBoL NBL-W-LM measures temperature and moisture conditions on a leaf-shaped sensing surface placed near the crop. It is useful for observing wetting, drying and cold-surface conditions. It should not be specified as a direct measurement of a living leaf's tissue temperature or as a stand-alone plant-disease detector.
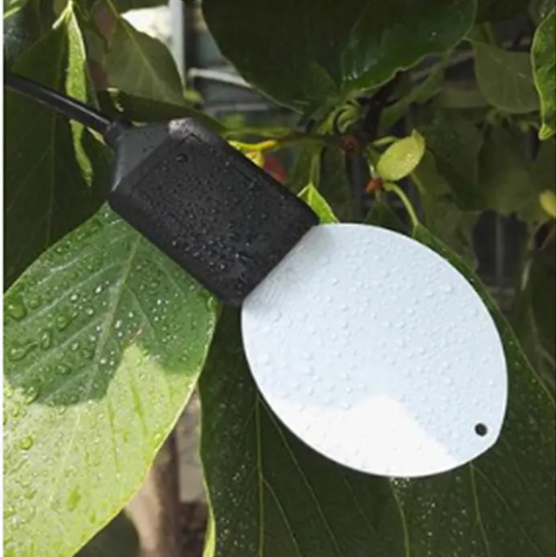
An orchard disease-risk project may need to know how long a representative surface stays wet after dew, rain or spraying. A plant-physiology study may instead need the temperature of a particular living leaf. Those are different measurement tasks, even if both procurement lists use the phrase leaf temperature sensor.
The NBL-W-LM has its own exposed sensing surface. Water or ice on that surface changes its dielectric response, and an integrated temperature channel helps interpret the surface condition. The instrument is installed near representative foliage; it does not need to be pressed against a real leaf. Its data describe the sensor surface's response in that crop microclimate.
A real leaf can differ from the sensor in orientation, shading, size and thermal behavior. Do not use the simulated surface as proof that every leaf in the canopy has the same temperature. For work requiring actual plant-surface temperature, specify an appropriate measurement method and reference procedure separately. The NBL-W-LM can remain useful as a companion wetness observation, but it should not be assigned a quantity it does not directly measure.
| Observation | What it can support | What it does not establish |
|---|---|---|
| Surface moisture increases after rain | A wetting event at the monitored sensing surface | Rainfall amount, canopy-wide coverage or disease infection |
| Surface moisture remains elevated while air humidity changes | Investigation of local drying conditions | An interchangeable air relative-humidity reading |
| A wet surface is also cold | Closer review of possible freezing or frost conditions | Automatic identification of ice, or a guaranteed frost-warning threshold for the crop |
| Two canopy positions dry at different times | A location-specific microclimate comparison | A reason to average the difference away without checking exposure |
The moisture channel is specified using a 0-100%RH scale, but its measurement object is the leaf-like surface. Keep that channel labelled as surface wetness or surface humidity in the application. Relabelling it as ambient RH would make it easy to apply an unsuitable greenhouse air-humidity rule. Use a separate air temperature and humidity instrument when atmospheric conditions are required.
| Item | Specification | Selection note |
|---|---|---|
| Surface temperature | -40°C to 80°C; ±0.5°C accuracy | Temperature of the sensor's sensing surface, not automatically that of living tissue |
| Surface moisture / humidity | 0-100%RH; ±5%RH stated accuracy | Retain the defined surface-measurement meaning in data labels. |
| Supply voltage | DC 12-24 V | Do not connect the sensor directly to an AC supply. |
| Power consumption | 120 mW peak; 72 mW standby | Budget the logger and transmission equipment separately. |
| Communication | RS485 Modbus RTU; default 9600 bps | Confirm the delivered serial settings before integration. |
| Communication interval | 1000 ms or longer | Use a compatible polling schedule. |
| Operating environment | -40°C to 85°C | The operating limit is distinct from the temperature measurement range. |
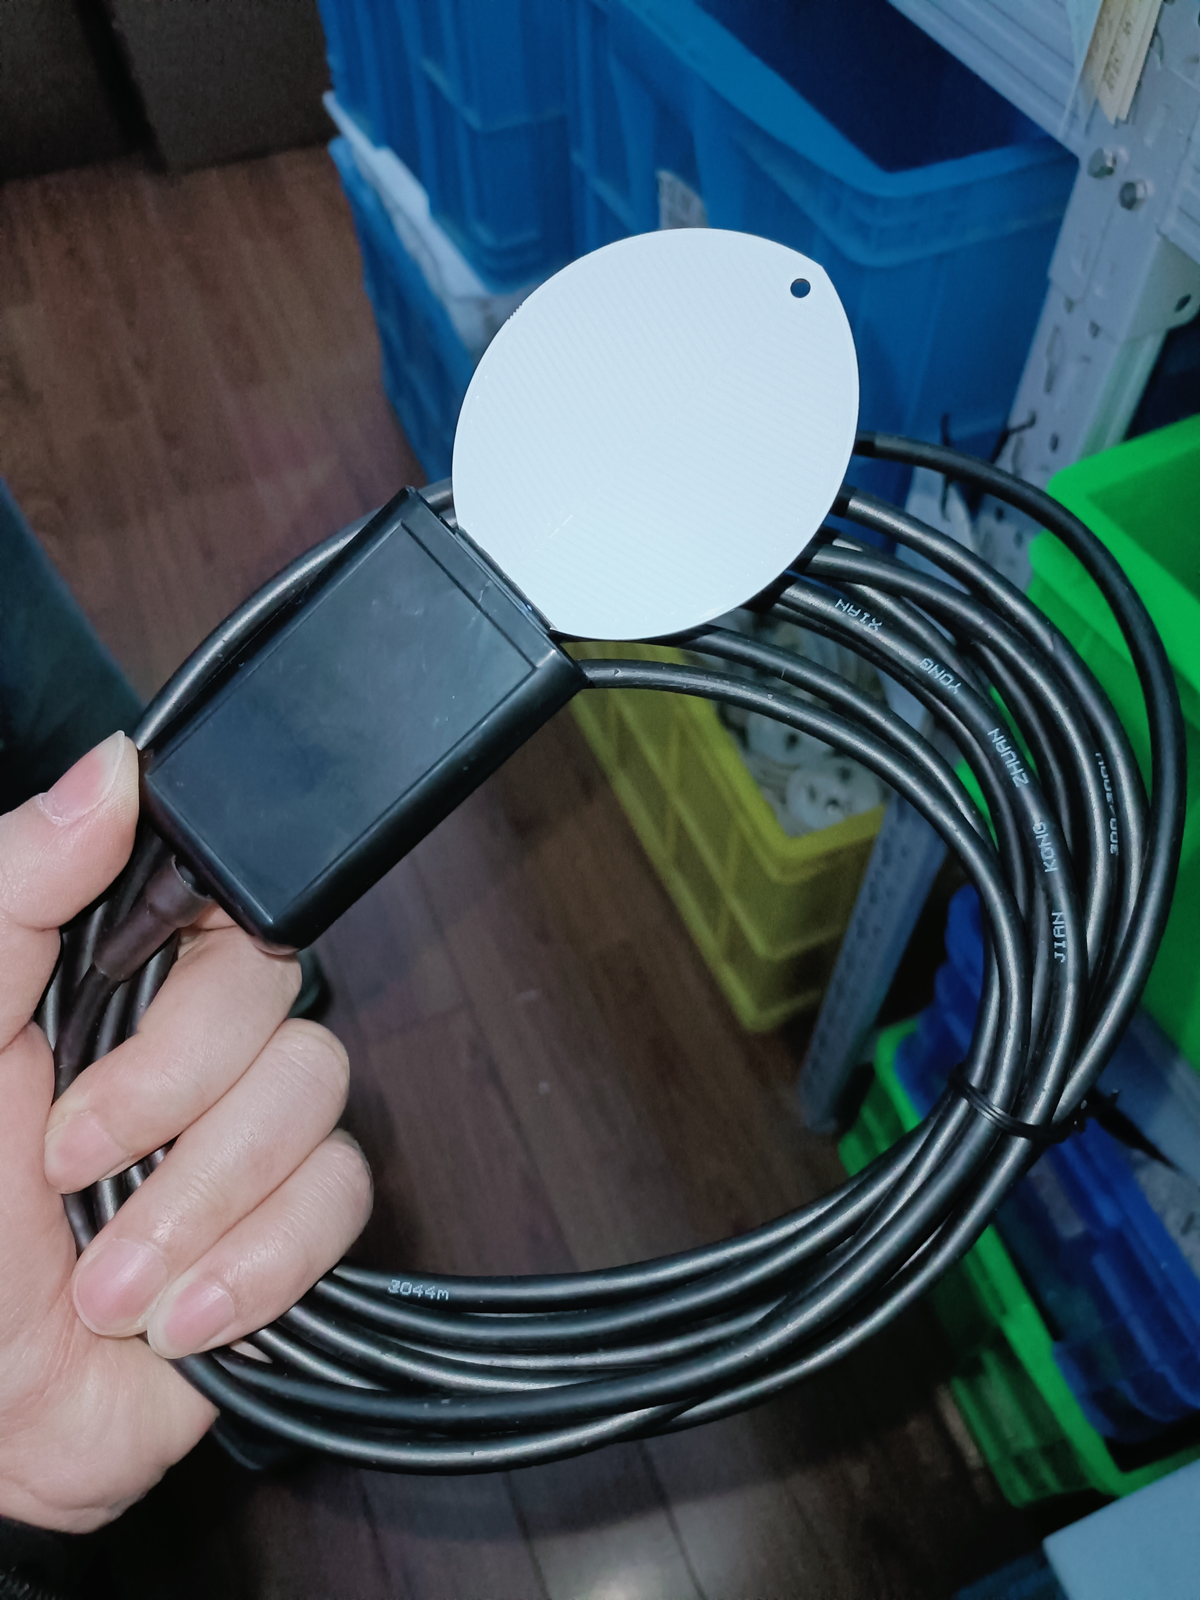
Install the sensor near the foliage that the project intends to represent. A head under a roof edge may miss rain that reaches the crop. One beside an irrigation nozzle may receive spray that nearby leaves do not. In a dense canopy, an upper exposed point and a lower sheltered point can have different drying histories. Decide which condition is relevant before choosing the mounting location.
The mounting hole allows a non-metallic tie or line to secure the sensor near a branch, stalk or suitable support. Keep the selected position stable and avoid sheltering the sensing surface with the fastening arrangement. Record orientation and canopy height with a photograph so that a replacement or a seasonal move can be reproduced. Select the angle for the crop and observation method rather than assuming that one orientation represents every canopy.
Inspect contamination when a surface remains unexpectedly wet or becomes slow to respond. Dust, spray residue and biological deposits can change wetting and drying behavior. Record a cleaning intervention before comparing the before-and-after trend. A change after cleaning may reflect the surface condition, not a sudden change in the crop environment.
For the defined digital format, both temperature and surface-humidity values are decoded with a divisor of ten. For example, decimal 180 represents 18.0°C, and decimal 272 represents 27.2% on the surface-humidity scale. These are protocol examples, not readings from a customer installation.
The value 0x7FFF identifies invalid or disconnected data for the relevant channel. Test that condition before applying the normal scale factor. Otherwise, invalid data could appear as a very large number and trigger a false wetness classification. A communication timeout also needs its own status; it should not be silently stored as either zero wetness or continuous wetness.
If the application calculates wetness duration, define its threshold, sampling interval and treatment of gaps. The head provides observations, while the logger or software performs that duration calculation. A missing half-hour is an unknown period, not evidence that the surface stayed dry. Crop- and pathogen-specific risk assessment requires a suitable model and local validation beyond the sensor connection.
Commission the installed system with a dry observation and a controlled water-response check that does not damage the sensing surface. Verify both channels at the local logger and final display. Retain the location and maintenance notes with the test, so a later trend can be interpreted against a known installation rather than a generic device name.
A leaf-shaped plate is a proxy for a crop surface, so a commissioning visit should test the intended inference rather than merely confirm that a Modbus value appears. In an orchard, place the plate where the operator expects dew or rain persistence to matter, photograph its orientation and note whether spray irrigation can wet it directly. Compare several actual wetting and drying events with observations of nearby foliage. If the instrument dries much faster than the relevant leaves, changing an alarm threshold will not repair the exposure mismatch.
Agree the analytical rule with the crop specialist before enabling notifications. Specify when a wetness period begins, how short dry interruptions are handled and what happens during missing or invalid samples. The sensor supplies a surface condition and a temperature reading; it does not identify a pathogen or determine a treatment. A practical pilot report should show the raw sequence alongside the derived wetness hours so another team can reproduce the alert decision.
For a physiology project, the same plate should not be presented as a measurement of a chosen living leaf. That requirement calls for an instrument and installation method designed for the actual tissue or surface temperature of interest. If both decisions are needed, quote them as separate measurement tasks. This distinction avoids buying a stable, correctly connected sensor that answers the wrong biological question.
For repeat installations, give the distributor a drawing of the intended plate orientation and a photo from the pilot plot. This is more useful than promising that the same bracket position suits every crop architecture; the acceptance rule should travel with the installation instruction.
Keep the pilot observations with that instruction so a later operator can see why the location was selected.
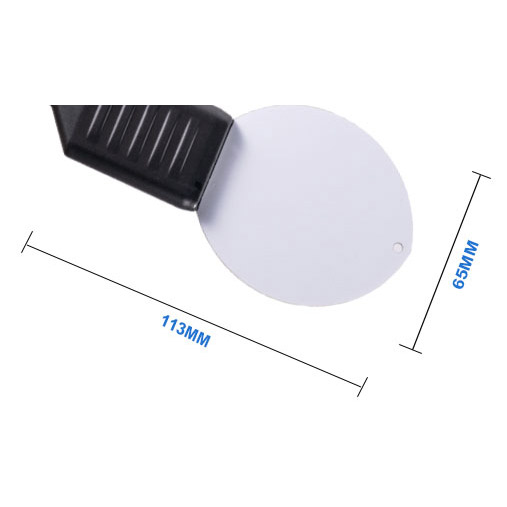
Not directly. It measures its own leaf-shaped sensing surface near the crop. If a study requires the temperature of a particular plant leaf, specify a suitable plant-surface measurement method. Use the NBL-W-LM for the representative surface-wetness and temperature observation it is designed to provide.
No. Its surface-moisture response and atmospheric relative humidity describe different conditions. Retain a separate air sensor when the project needs ambient RH, and label both channels so the control software does not confuse them.
No. It indicates the condition of the sensing surface. Disease-risk assessment needs wetness duration, temperature and an appropriate crop- or pathogen-specific method; it is not a direct detection of infection.
Confirm the delivered serial settings, read both channels with the correct scaling, and treat 0x7FFF as invalid rather than as a measured value. Maintain a polling interval of at least 1000 ms and test the display's response to communication loss.
Its moisture response and temperature can support interpretation of freezing conditions. Do not assume that the system supplies a validated water-versus-ice classification or a crop frost alarm unless that function is explicitly included and tested.
Describe the crop, canopy position, wetting source and intended decision: wetness duration, drying comparison or cold-surface observation. Include the receiving logger and whether actual living-leaf temperature is also required. This establishes whether the proposed sensor measures the quantities the project needs.
Place it where the wetting and drying pattern represents the crop zone under study, not simply where cable routing is easiest. Record canopy position, orientation and nearby irrigation or spray exposure. A trial installation should compare the plate with observed wetting after rain or dew before its hours are used in a disease-risk workflow.
Record the selected mounting position, logger scaling, dry and deliberately wetted responses, timestamps and the rule that turns observations into wetness duration. Keep invalid or missing values out of the duration calculation. If the project changes the plate position later, mark that date because the measurement context has changed.
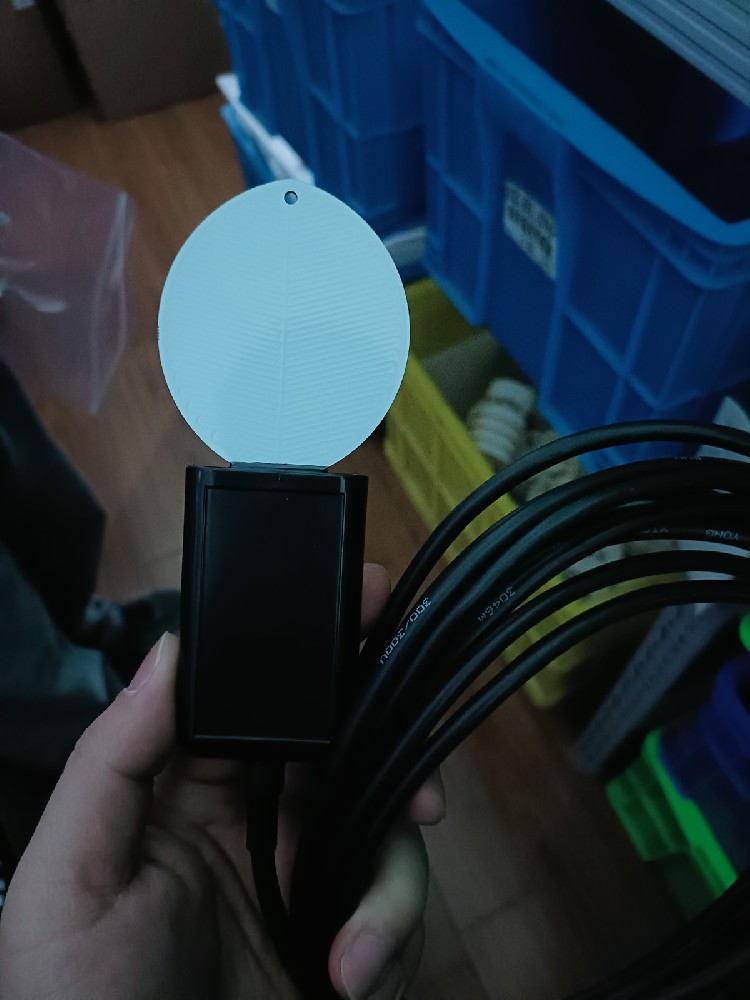
The useful distinction in leaf temperature sensor selection is between a representative sensing surface and direct measurement of the plant. NBL-W-LM combines simulated-leaf moisture and temperature observations for crop microclimate monitoring. Correct placement, clear channel labels and invalid-data handling make those observations usable without overstating what they establish about the crop.
 NBL-W-LM-Leaf-Temperature-and-Humidity-Sensor-Instruction-Manual.pdf
Prev:Weather Station Barometric Pressure Sensor: What to Specify
Next:PAR Sensor vs Quantum Sensor: Confirm Units Before System Integration
Related recommendations
Sensors & Weather Stations Catalog
Agriculture Sensors and Weather Stations Catalog-NiuBoL.pdf
Weather Stations Catalog-NiuBoL.pdf
Agriculture Sensors Catalog-NiuBoL.pdf
Water Quality Sensor Catalog-NiuBoL.pdf
Related products
 Combined air temperature and relative humidity sensor
 TDR Soil Moisture & Temperature Sensor for irrigation| RS485 |4-20mA| NBL-S-THR
 Soil pH sensor RS485 soil Testing instrument soil ph meter for agriculture |NBL-S-PH
 Wind Speed sensor Output Modbus/RS485/Analog/0-5V/4-20mA
 Tipping bucket rain gauge for weather monitoring auto rainfall sensor RS485/Outdoor/stainless steel
 Pyranometer Solar Radiation Sensor 4-20mA/RS485


Screenshot, WhatsApp to identify the QR code
WhatsApp number:+8615367865107
(Click on WhatsApp to copy and add friends)

