





— Blogs —
—Products—
 Consumer hotline +8618073152920
WhatsApp:+8615367865107
Address:Room 102, District D, Houhu Industrial Park, Yuelu District, Changsha City, Hunan Province, China
Product knowledge
Time:2025-11-22 15:34:23 Popularity:1029
A weather station data mismatch between a local display and cloud software does not automatically mean the sensor has drifted. First compare the same channel, units and observation time. Then check scaling, averaging, stored-record selection and communication delay. A NiuBoL outdoor system can contain sensors, a data logger and separate receiving software; each stage must preserve the meaning of the value rather than only show that the station is online.
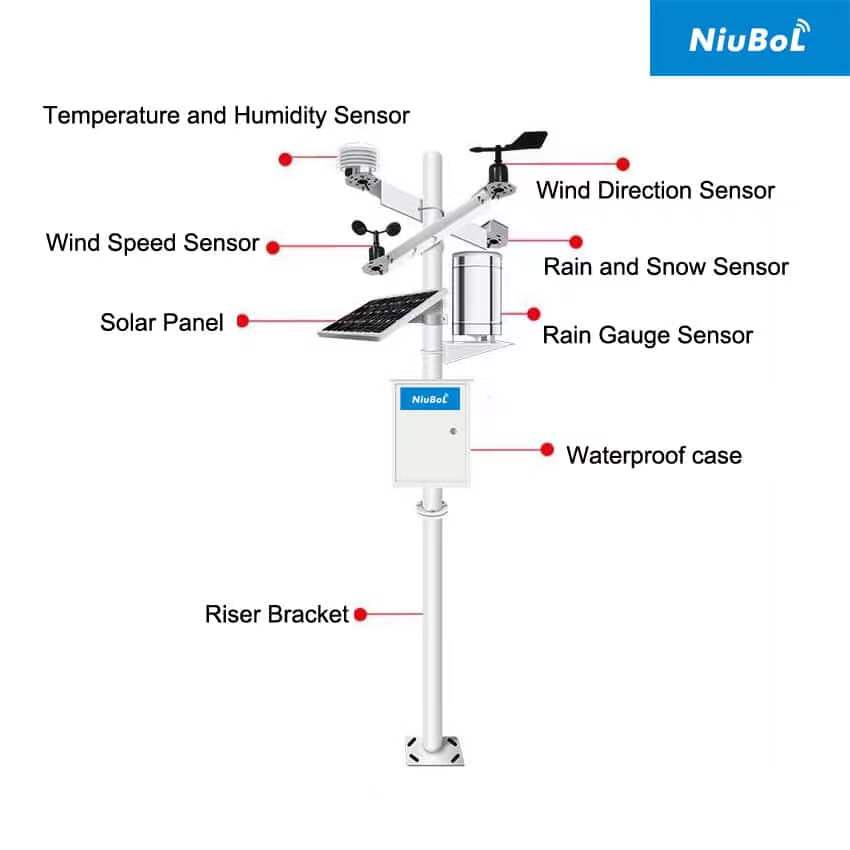
Record the site, sensor identity, quantity, displayed value and observation time at each end. A screen labeled temperature may refer to outdoor air, another air node or soil. A remote chart may show yesterday's period while the local LCD shows a current reading. Confirm identity and time before changing the sensor or recalibrating anything.
Preserve a small set of original records for the event. Include the local reading, decoded acquisition value and exported remote record where available. Screenshots are useful context but often omit channel identity, units or time-zone information. The underlying records make it possible to locate the first stage where the values stop agreeing.
| Comparison | Check | Likely explanation to investigate |
|---|---|---|
| Instrument versus logger | Register, scale, sign and units | Input configuration or decoding |
| Logger versus saved history | Saving interval and selected record time | Current value compared with an older record |
| Sent versus received record | Payload, device identity and timestamps | Mapping or delivery delay |
| Received record versus chart | Averaging, filtering and selected period | Different presentation of valid observations |
Test one channel before changing the entire station configuration. If the same source value decodes correctly at the logger but not at the receiver, concentrate on the transfer and application mapping. Replacing a temperature probe will not correct a server applying the wrong scale.
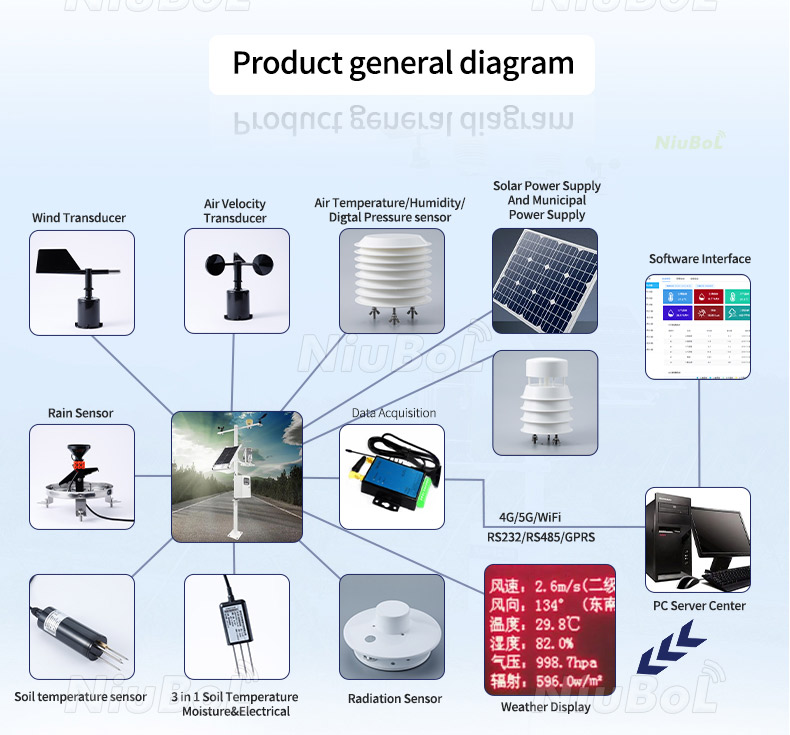
The NBL-W-LBTH provides air temperature, relative humidity and pressure through its selected output. Its Modbus example represents 18.0 C using an integer value of 180. This is a decoding example, not a field observation. A receiver showing 180 C for that record has not applied the required scale.
Check the actual register map for each instrument rather than applying that scale to every channel. Pressure, wind, rainfall and light can have different units and factors. Negative values also need the correct signed interpretation. A plausible-looking positive value is not sufficient to prove that a decoder handles the full measurement range.
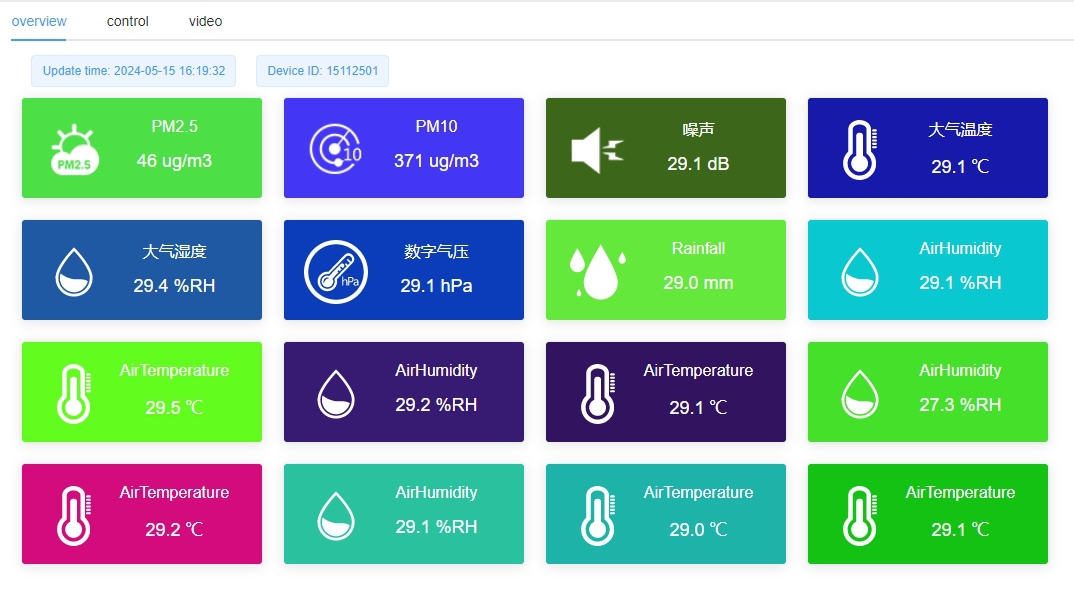
The NBL-PH-1 offers a configurable saving interval of 1-240 minutes and non-volatile FLASH history. That saving interval does not establish the polling, upload or chart-refresh interval. Identify each setting separately. A local live value can change between stored observations without either value being wrong.
A cloud chart may also show an average, minimum or maximum rather than the latest observation. Compare the same statistic and period. If one system uses a different time zone or defines a day differently, daily rainfall or temperature summaries can disagree even when the individual records match. Correct the period definition rather than adjusting the sensor.
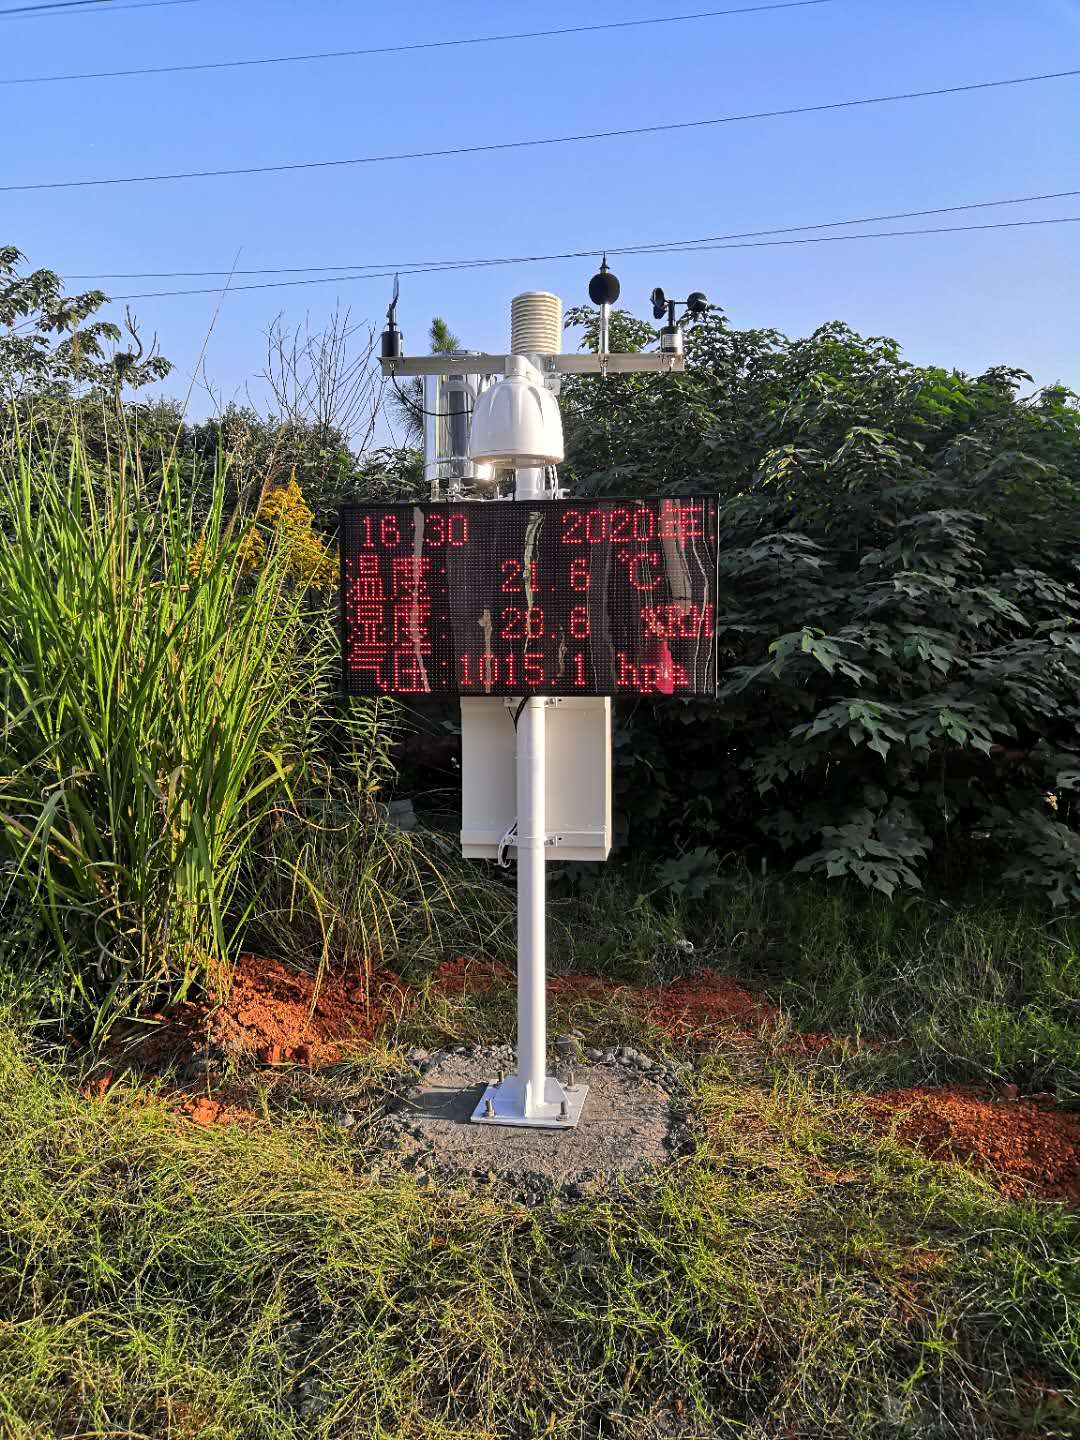
Rainfall can be represented as increments, a cumulative amount or a rate. These are not interchangeable. Check the interval and any reset before comparing local and cloud totals. A restarted counter can create a discontinuity that must be handled explicitly. It is not evidence of negative rainfall, and unavailable intervals should remain identified as missing.
Wind direction is circular. A simple numerical average of readings near north can give a misleading result if the software treats direction like an ordinary linear quantity. Agree on the intended aggregation method and compare equivalent records. Also confirm the installed direction reference before attributing every offset to a cloud-processing error.
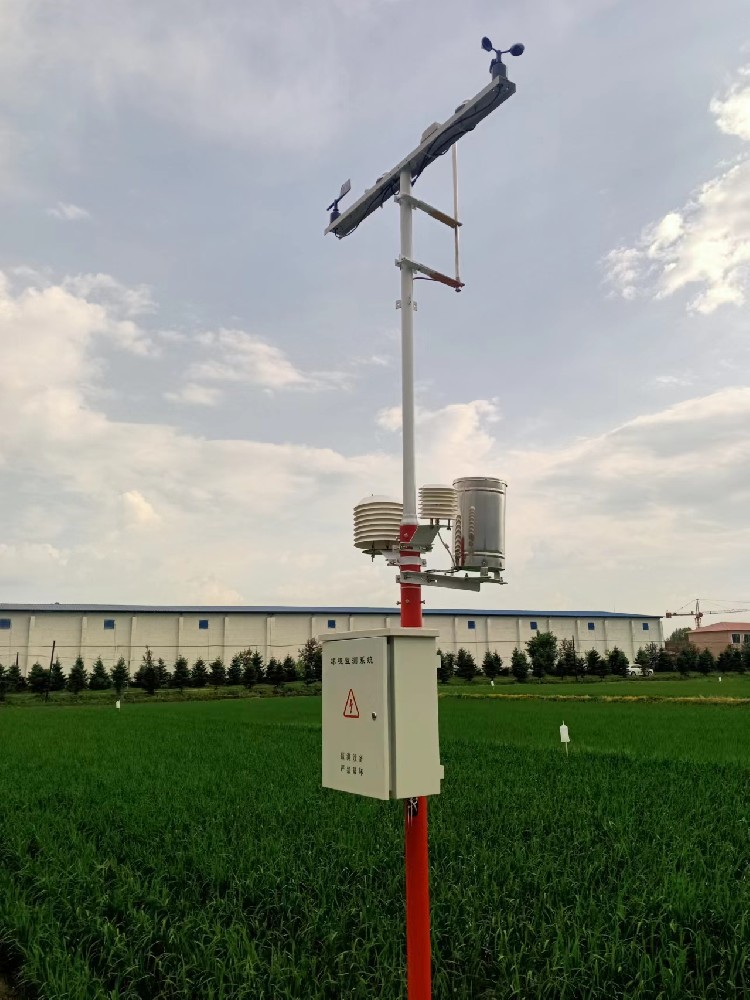
| Equipment | Relevant specification | Data check |
|---|---|---|
| NBL-W-LBTH | Temperature -40 to 80 C; 0.1 C resolution; RS485 Modbus RTU option | Check the temperature register, scaling and signed values |
| NBL-PH-1 | 4G collection; FLASH history; saving interval 1-240 minutes | Identify the saved time and onward transmission configuration |
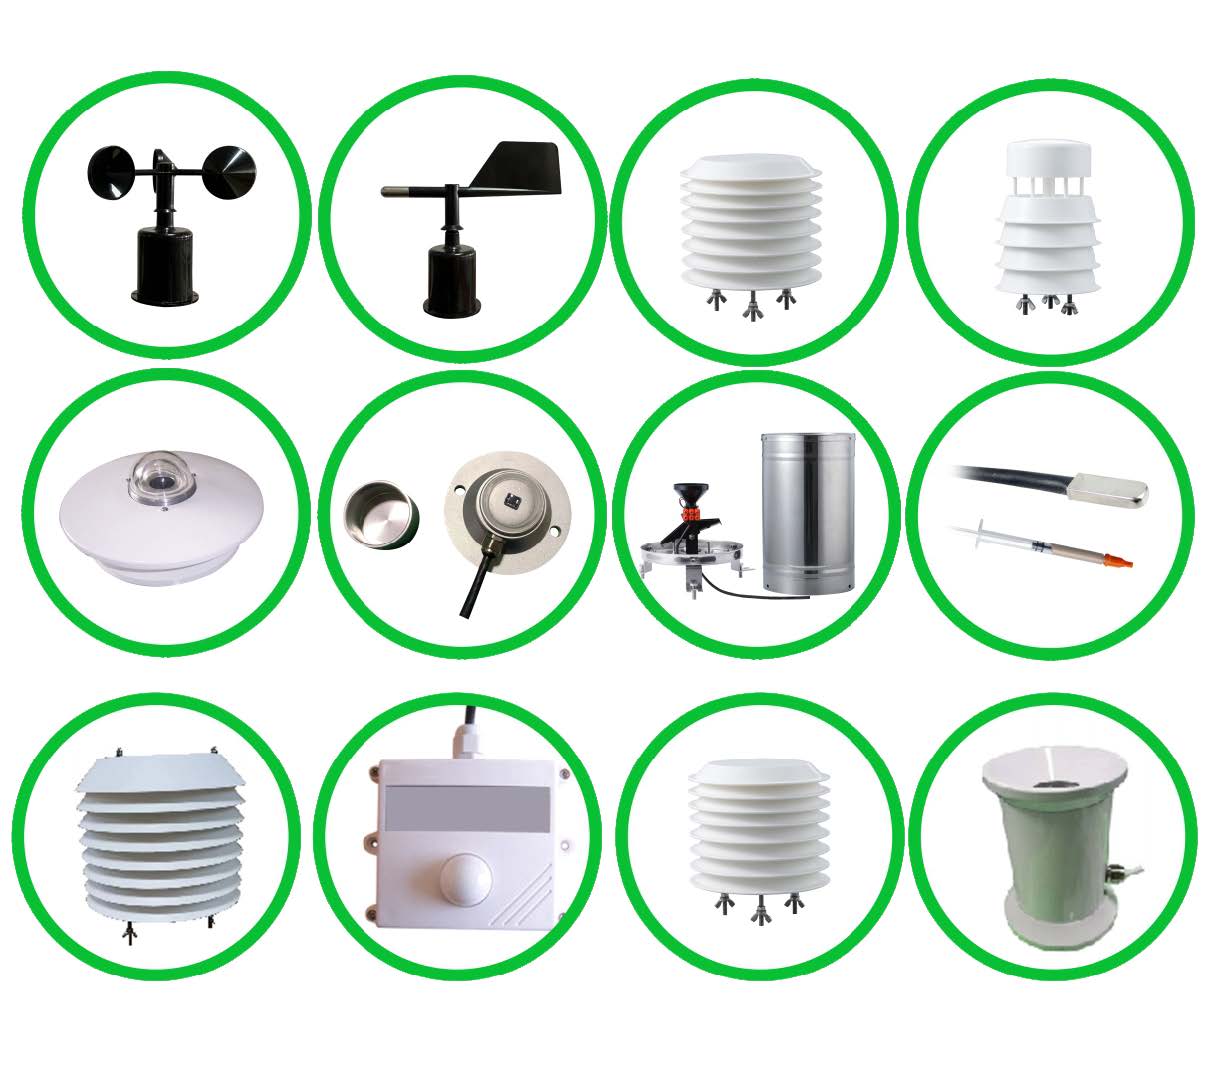
| NBL-W-SS / NBL-W-DS | Separate wind speed and direction instruments; IP65 | Keep quantity, units, reference and aggregation distinct |
Communication compatibility is necessary but not sufficient. An RS485 connection can deliver a valid frame to a PLC or RTU while the application decodes the wrong register. Likewise, an online 4G link does not establish that every sensor channel is current. Include channel-level times and quality information in the comparison wherever the selected system supports them.
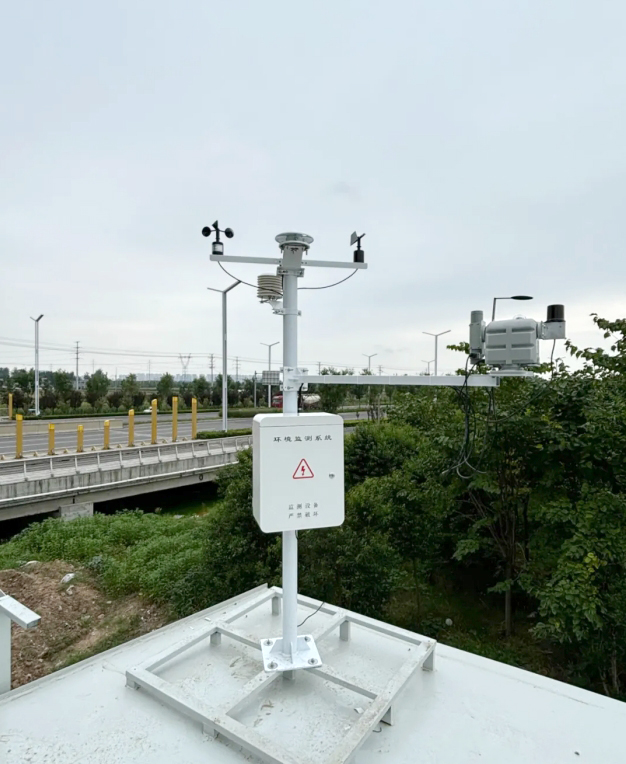
After changing a mapping or display rule, compare new local, recorded and remote values over a defined test period. Include a negative-temperature decoding test or a rainfall reset case where relevant, using an approved method that does not contaminate live observations. Keep the original event and document when the configuration changed.
Do not assume stored history is automatically repaired by correcting the current display. Review affected records separately and label any reprocessed dataset. For NiuBoL support, provide sensor and logger models, the two values being compared, units, observation times, raw or exported records and the receiving-system configuration. That information helps resolve the mismatch without unnecessary hardware replacement.
No. Check channel identity, time, units and processing first. Drift requires an appropriate measurement comparison, not merely disagreement between two displays.
Not without checking the actual configuration. Acquisition, saving, transfer and display refresh are separate functions and may run at different intervals.
Check day boundaries, time zones, increments versus counters, resets and unavailable periods. Compare the same underlying observations before judging the totals.
Not necessarily. Determine whether the stored values were raw, decoded or aggregated. Keep the originals and identify any separately reprocessed history.
Show one identified measurement at the instrument, logger, saved record and receiving application with matching units and observation time. Then check the relevant gap, reset or aggregation case.
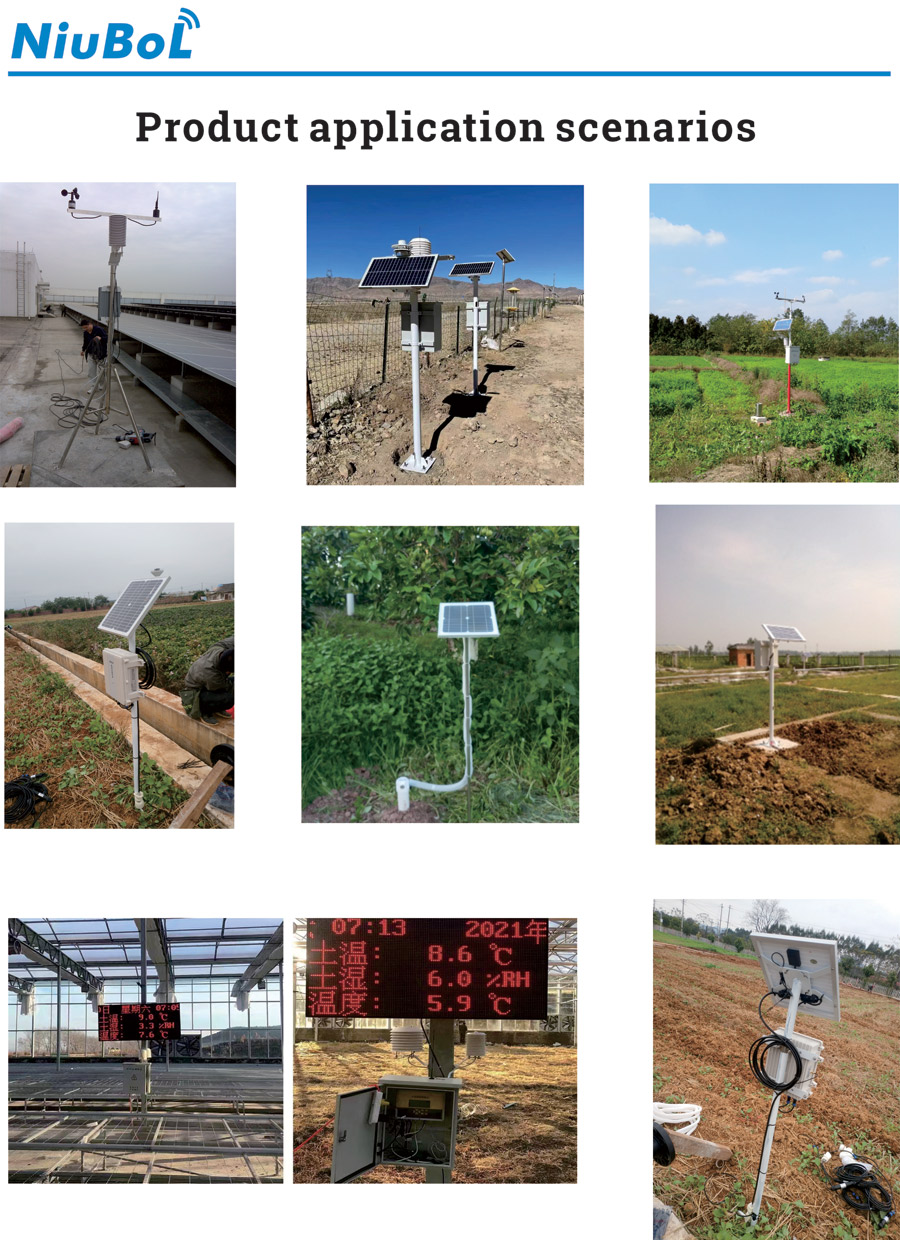
Resolve a weather station data mismatch by locating the first disagreement in the measurement chain. Match identity and time, verify decoding, then compare equivalent records and statistics. Documenting the correction protects the dataset and gives NiuBoL and the system integrator a clear basis for technical support.
Prev:Compact Weather Station for Multi-Parameter Monitoring
Next:Compact Ultrasonic Weather Station Installation and Exposure
Related recommendations
Sensors & Weather Stations Catalog
 Agriculture Sensors and Weather Stations Catalog-NiuBoL.pdf
Weather Stations Catalog-NiuBoL.pdf
Agriculture Sensors Catalog-NiuBoL.pdf
Water Quality Sensor Catalog-NiuBoL.pdf
Related products
 Combined air temperature and relative humidity sensor
 TDR Soil Moisture & Temperature Sensor for irrigation| RS485 |4-20mA| NBL-S-THR
 Soil pH sensor RS485 soil Testing instrument soil ph meter for agriculture |NBL-S-PH
 Wind Speed sensor Output Modbus/RS485/Analog/0-5V/4-20mA
 Tipping bucket rain gauge for weather monitoring auto rainfall sensor RS485/Outdoor/stainless steel
 Pyranometer Solar Radiation Sensor 4-20mA/RS485


Screenshot, WhatsApp to identify the QR code
WhatsApp number:+8615367865107
(Click on WhatsApp to copy and add friends)

