





— Blogs —
—Products—
 Consumer hotline +8618073152920
WhatsApp:+8615367865107
Address:Room 102, District D, Houhu Industrial Park, Yuelu District, Changsha City, Hunan Province, China
Product knowledge
Time:2025-04-20 16:53:16 Popularity:1807
A PV soiling station reading that improves after rain is a reason to inspect the trend, not automatic permission to cancel module cleaning. Check whether the optical surfaces are dry, both channels have recovered consistently and the station represents the affected array. The NiuBoL NBL-W-PSS measures local optical cleanliness; it does not directly measure the plant's recovered electrical output.
Rain may remove loose contamination, redistribute it or leave residue after drying. The result depends on the surface, tilt, deposited material and event conditions. A rainfall total alone cannot establish how much contamination remains across a PV site. Nor does a short-term change on one optical head establish that distant module rows are equally clean.
For an operations team, the practical question is whether the planned cleaning work can be postponed without overlooking persistent contamination. That requires a dry-surface assessment and a comparison with the station's previous condition. It does not require an invented universal rainfall threshold. A project can establish its own decision criteria from local observations, but should not transfer them unchanged from a different climate or mounting arrangement.
The NBL-W-PSS provides two cleanliness channels through RS485 Modbus RTU. The channels give local optical observations that can be trended alongside a separate rain gauge, maintenance records and plant operating data. A backplane-temperature measurement is optional. Rainfall, airborne particulate concentration and electrical energy are not measurements supplied by the cleanliness channels themselves.
| Item | NBL-W-PSS specification | Use in the project |
|---|---|---|
| Cleanliness measurement | Two channels, 50-100% | Read and retain both channels rather than discarding one without a reason. |
| Stated accuracy bands | ±1% at 90-100%; ±3% at 80-90%; ±5% at 50-80% | Use the applicable band when assessing a change; small movements are not automatically a meaningful recovery. |
| Supply | DC 12 V | Include the sensor in the field supply design. |
| Average power | 1 W | Allow for the logger and communications separately. |
| Output | RS485, standard Modbus protocol; 9600 bps | Confirm the complete serial settings and register map for the delivered unit. |
| Communication interval | More than 1000 ms between communications | Configure the polling schedule accordingly. |
| Optional backplane temperature | -50°C to 100°C; ±0.5°C at 25°C | Order explicitly if this channel is required. |
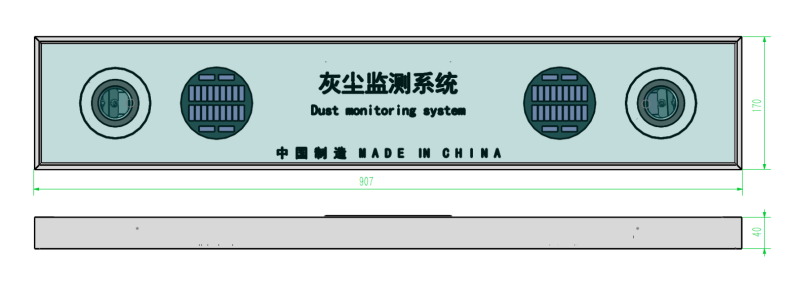
| Dimensions | 907 × 170 × 40 mm | Check the frame mounting space and service access. |
The register example 965 represents 96.5% cleanliness, not 965%, and not a directly measured 3.5% electrical power loss. The difference between a cleanliness indication and 100% must not simply be renamed a plant energy-loss percentage. The measurement method and the plant's electrical response are different quantities.

Before a rain event, retain the recent cleanliness trend, any known surface condition and the most recent cleaning or calibration date. If a channel had already become unreliable, a subsequent rise does not repair its baseline. Do not delete the earlier measurements or replace them with a new reference simply to make the plot appear consistent.
During and immediately after rain, annotate the event in the monitoring system using a separate rainfall source or an operator record. Treat wet-surface observations cautiously. The project should verify how its installed sensor behaves while wet; there is no assumed wetness flag or automatic dry-surface classification unless the ordered system actually provides one.
After the surfaces have dried, review both channels again. Compare observations made under reasonably comparable conditions, and inspect nearby module surfaces when practical. If the trend changes markedly after drying, retain both stages of the event. An instant post-rain reading and a later dry assessment answer different questions and should not be substituted for one another.
| Observed outcome | Next check | Cleaning implication |
|---|---|---|
| Both channels recover after drying and nearby modules appear similarly clean | Check whether the monitored point represents the rows included in the planned work. | A postponement may be considered under the site's operating criteria; record the basis. |
| One channel recovers while the other remains low | Inspect local deposits, shading, surface condition and the two channel records. | Do not average away unexplained disagreement to justify cancelling cleaning. |
| Both channels remain low after drying | Check persistent residue and compare with a documented clean condition. | Rain has not established sufficient recovery at that point; inspect the planned cleaning area. |
| The sensor improves but module rows remain visibly contaminated | Review location, exposure and whether the sensor was cleaned separately. | The sensor is not currently a sufficient basis for a site-wide decision. |
These are review paths, not factory-set cleaning thresholds. The action limit should reflect the site's measurement uncertainty, cleaning economics and operating responsibility. A small numerical improvement within the relevant accuracy band is weak evidence on its own. Conversely, a conspicuous deposit on modules should not be ignored because a distant sensor gives a high reading.
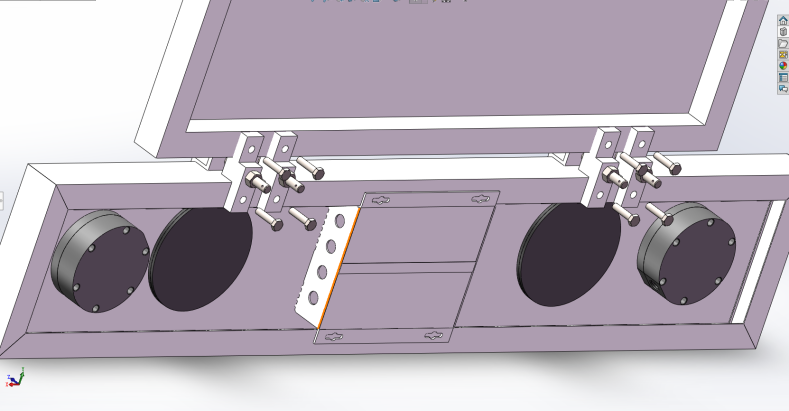
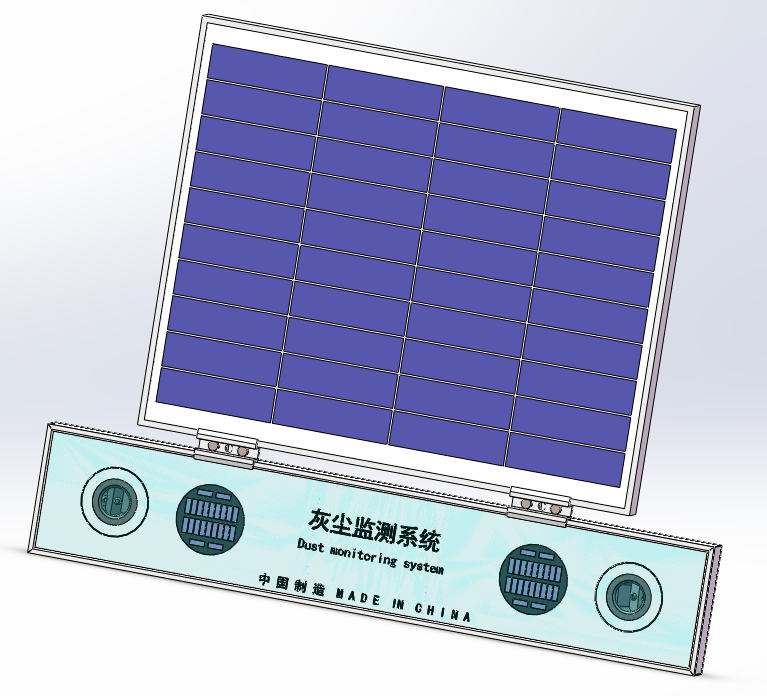
Install the optical surfaces in a representative relationship to the modules, including their plane and exposure, using the appropriate top or side frame mounting arrangement. A head sheltered from rain, placed near an unusual runoff path or affected by local shading may behave differently from the array. Check access before finalizing brackets: a surface that cannot be inspected is difficult to investigate after a disputed reading.
Coordinate cleaning of both sensor heads with the surrounding modules. If the heads are wiped but the modules are not, label that intervention in the record; the resulting increase describes sensor cleaning, not array recovery. If calibration is required, follow the ordered unit's procedure under appropriate conditions. Calibration should not be used to erase an unexplained post-rain difference.
For several monitoring points, retain each location separately. Different tilt, dust exposure or runoff can justify different responses within the same plant. Selecting one convenient station and applying its result to all blocks is a representativeness decision, not a feature of Modbus communication. A site survey should define which array section each point is intended to describe.
A PLC, RTU or data logger should retain channel identity, scaled value, timestamp and communication status. Coordinate the serial polling interval with the other instruments on the bus. If data is forwarded through a gateway, verify the scaling again at the receiving application: a correctly received register can still be displayed in the wrong unit.
Store rainfall and maintenance events as separate records that can be compared with cleanliness. If the site needs an electrical loss assessment, define the additional reference measurements and calculation method separately. The gateway transporting the readings does not turn optical cleanliness into a calibrated energy-loss measurement. Likewise, a weather station fitted with a rain gauge does not automatically include a soiling station.
There is no single rainfall amount that establishes sufficient cleaning for every site. Assess the dry optical trend, module condition and monitored area. A local threshold is useful only after its relationship to the site's contamination and operating criteria has been checked.
No. It is an optical cleanliness reading. Electrical loss depends on the modules, contamination distribution and operating conditions. A separate validated method is needed before using that number in an energy-loss or financial calculation.
Not before unexplained disagreement is investigated. Inspect both surfaces and check their individual histories. An average can conceal a local deposit or channel issue that matters to the decision.
It needs a compatible RS485 Modbus RTU interface, correct register interpretation and suitable polling timing. Verify both cleanliness channels and any ordered temperature channel through the complete acquisition path before accepting the installation.
Provide module tilt, proposed mounting location, number of representative array sections, available 12 V supply and logger interface. State whether backplane temperature, a separate rain gauge and remote data transmission are required. This separates the optical instrument from the additional equipment needed for an event-based review.
A useful PV soiling station supports a traceable cleaning decision after rain: compare both channels, wait for a credible dry assessment and confirm that the location represents the planned work area. NBL-W-PSS supplies local cleanliness data; rainfall interpretation, electrical loss assessment and cleaning authorization remain distinct parts of the project.
 NBL-W-PSS Soiling Sensor Photovoltaic Dust Monitoring Instrument Data Sheet.pdf
Related recommendations
Sensors & Weather Stations Catalog
Agriculture Sensors and Weather Stations Catalog-NiuBoL.pdf
Weather Stations Catalog-NiuBoL.pdf
Agriculture Sensors Catalog-NiuBoL.pdf
Water Quality Sensor Catalog-NiuBoL.pdf
Related products
 Combined air temperature and relative humidity sensor
 TDR Soil Moisture & Temperature Sensor for irrigation| RS485 |4-20mA| NBL-S-THR
 Soil pH sensor RS485 soil Testing instrument soil ph meter for agriculture |NBL-S-PH
 Wind Speed sensor Output Modbus/RS485/Analog/0-5V/4-20mA
 Tipping bucket rain gauge for weather monitoring auto rainfall sensor RS485/Outdoor/stainless steel
 Pyranometer Solar Radiation Sensor 4-20mA/RS485


Screenshot, WhatsApp to identify the QR code
WhatsApp number:+8615367865107
(Click on WhatsApp to copy and add friends)

