





— Blogs —
—Products—
 Consumer hotline +8618073152920
WhatsApp:+8615367865107
Address:Room 102, District D, Houhu Industrial Park, Yuelu District, Changsha City, Hunan Province, China
Product knowledge
Time:2024-09-22 17:14:58 Popularity:2074
Weather stations for agriculture provide observations at installed measurement points; a forecast estimates conditions for a future period and defined location. When the two differ, first compare quantity, time, place and data quality. Do not recalibrate a working sensor to match a forecast or assume that a different reading means the station has failed.

A grower may compare a live air-temperature value with the day's forecast maximum, or a rain-gauge total with a percentage chance of rain. Those comparisons cannot establish accuracy because the quantities differ. A forecast application may also show a nearby station's latest observation alongside its forecast, with different source and time information.
For a useful comparison, identify the measured quantity, its unit, the observation or averaging period and the timestamp. Identify the forecast's issue time and valid period separately. Forecasts issued before an operation should remain distinguishable from a later update when reviewing why the farm made a particular decision.
| Apparent disagreement | Compare first | Why it matters |
|---|---|---|
| Live temperature below the forecast high | Current value versus daily maximum and the day's remaining hours. | A present observation is not the expected maximum over the whole day. |
| No measured rain despite a chance-of-rain forecast | Probability versus accumulated depth and the forecast period. | A probability is not a promised rainfall amount. |
| Farm wind differs from the app | Location, exposure, height and mean versus gust. | Different wind quantities and exposures need not agree. |
| Daily rainfall totals differ | Accumulation boundaries, time zone, resets and valid coverage. | Different daily periods can divide the same event differently. |
Retain source labels in the farm system. A single field named weather can conceal a mixture of measured observations, forecast values and calculated quantities. That ambiguity becomes important when staff use the display to plan irrigation, planting or harvesting.
Forecast products can use model grids and location-specific processing rather than a sensor installed on the property. The Met Office explanation of local forecasts describes deriving local forecasts from surrounding model grid points. This differs from recording an instrument at one mast.
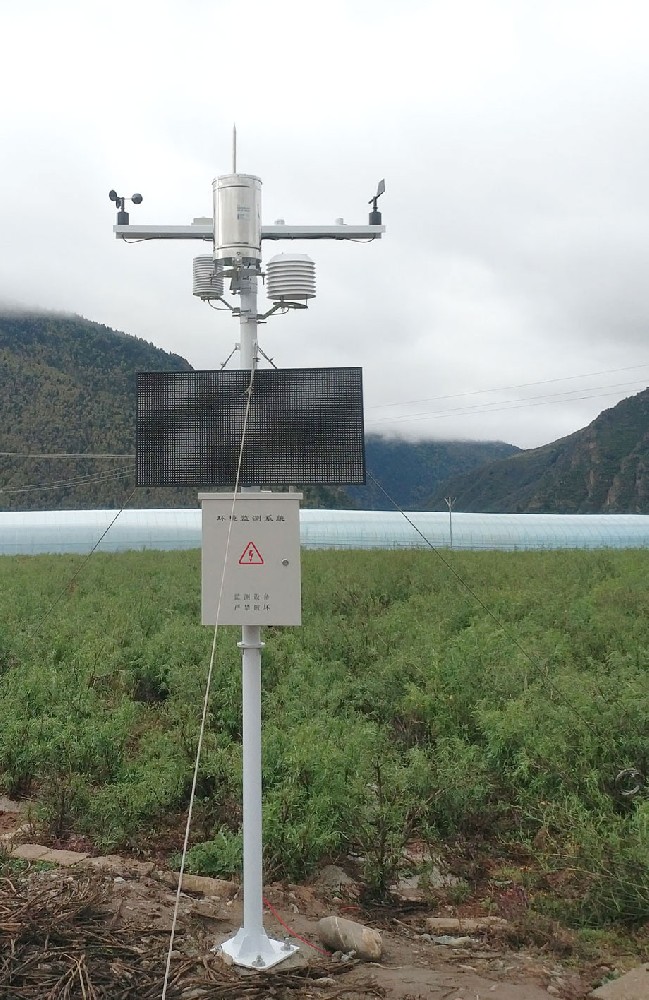
A field sheltered by trees, a low-lying crop block or a greenhouse may experience conditions that differ from the forecast location's represented environment. Conversely, a sensor beside a heated wall may be measuring an installation influence rather than representative field air. Do not automatically accept either explanation without inspecting the actual location and exposure.
Choose the farm observation for the question it must answer. An outdoor reference supports comparisons over time; a crop-zone point observes a more local environment. They can both be useful without being interchangeable. For seasonal changes in soil and crop measurements, see reviewing farm measurements after a crop change.
The National Weather Service explanation of precipitation probability distinguishes the chance of measurable precipitation from an observed rainfall amount. A probability is not the proportion of the day that rain must fall, and it is not a depth that can be subtracted from an irrigation requirement.
Keep forecast probability, forecast precipitation amount and measured rainfall in separate fields. Review their valid periods. Once an event occurs, inspect the gauge and root-zone observations relevant to the irrigation decision. Rainfall that runs off or drains away is not necessarily retained water available to the crop.
A gauge stuck at zero may be blocked, frozen, disconnected or genuinely observing no rain. Compare the local acquisition record, instrument condition and event timing before declaring the forecast wrong. A stale database value must not be treated as a fresh dry-weather observation.
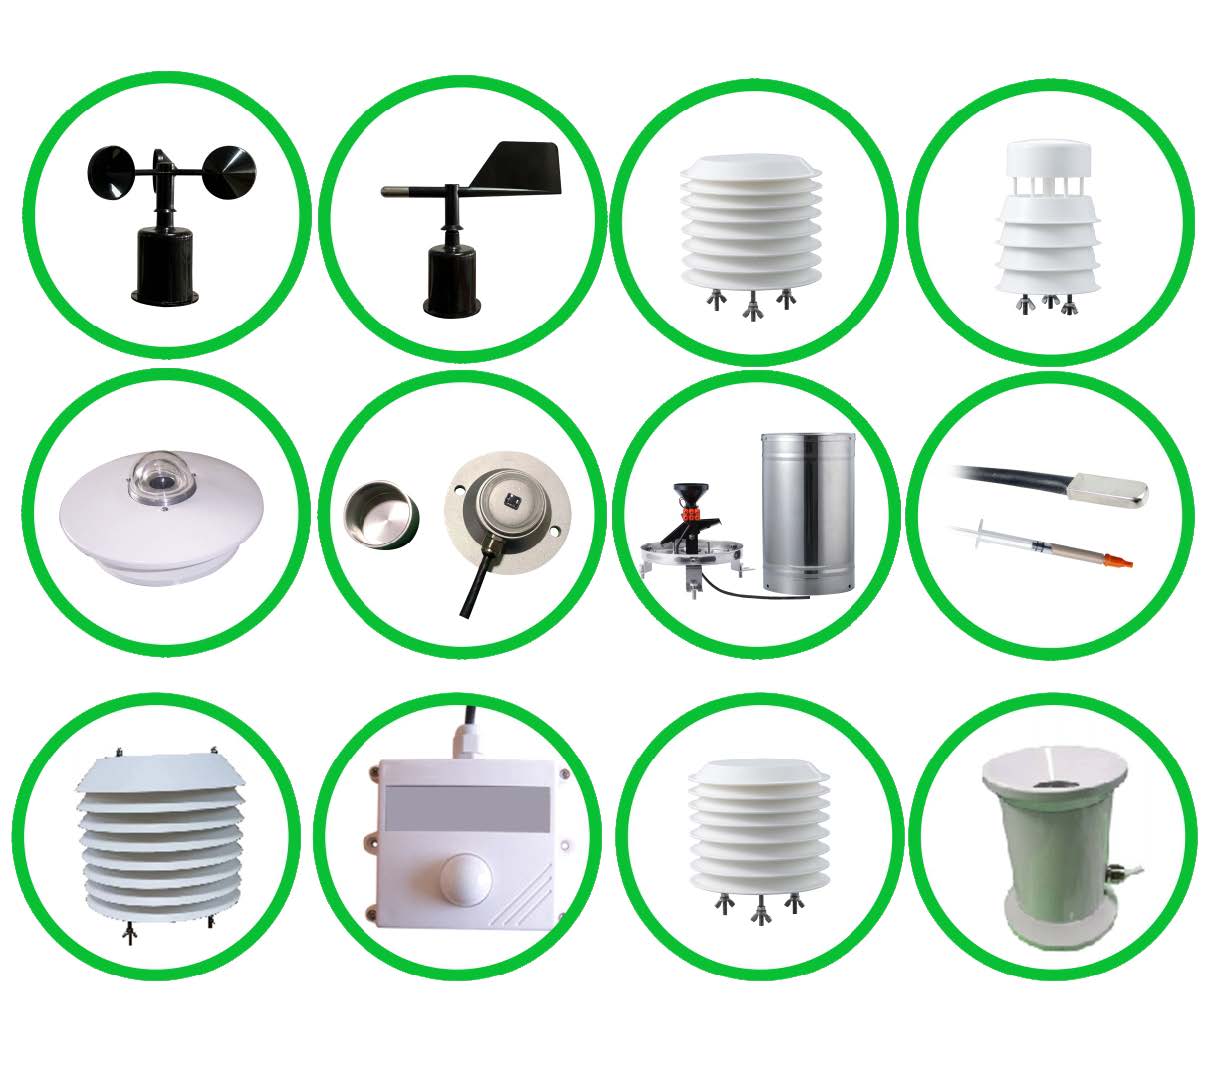
The NBL-W-LBTH provides air temperature, relative humidity and pressure. Its selected RS485 Modbus RTU version can connect to compatible acquisition equipment, but the receiving software must still interpret units, scaling and timestamps correctly. A correct sensor can appear wrong when a receiver decodes it incorrectly.
| Measurement | Relevant instrument detail | Comparison check |
|---|---|---|
| NBL-W-LBTH air temperature | -40 to 80 C; accuracy +/-0.5 C; resolution 0.1 C. | Compare the same time and exposure, not a forecast daily high or a greenhouse value. |
| NBL-W-LBTH relative humidity | 0-100% RH; accuracy +/-5% RH; resolution 0.1% RH. | Keep air relative humidity separate from soil water content. |
| NBL-W-LBTH pressure | 10-1200 hPa; accuracy +/-1.5 hPa. | Distinguish local station pressure from a sea-level-corrected product. |
| Selected wind instruments | NBL-W-SS wind speed and NBL-W-DS direction; IP65. | Check reference, exposure and the averaging or gust definition used by the receiver. |
Where accuracy is questioned, use an appropriate reference instrument and comparison method. Agreement with a forecast is not a calibration procedure. Avoid applying an offset merely to remove a difference that actually reflects location, time or calculation method.
For irrigation planning, a forecast can inform preparation for a possible rainfall event, while measured rain and root-zone conditions help assess what occurred locally. For a planned field operation, future weather information and current conditions answer different questions. Use the equipment and agronomic operating requirements rather than a generic threshold from a station article.
For cold-event review, an air observation does not establish the temperature of every flower, leaf or fruit. Crop stage and local exposure remain important. A favorable forecast does not certify that the current crop block has no risk, and a station alarm is not automatically a forecast or an official warning.
Station data can also support agronomic research or an incident review, but it does not independently prove a crop-loss cause, yield response or eligibility for an insurance payment. State the measurement location, missing periods and processing used. Any contractual evidence requirements must be established separately.
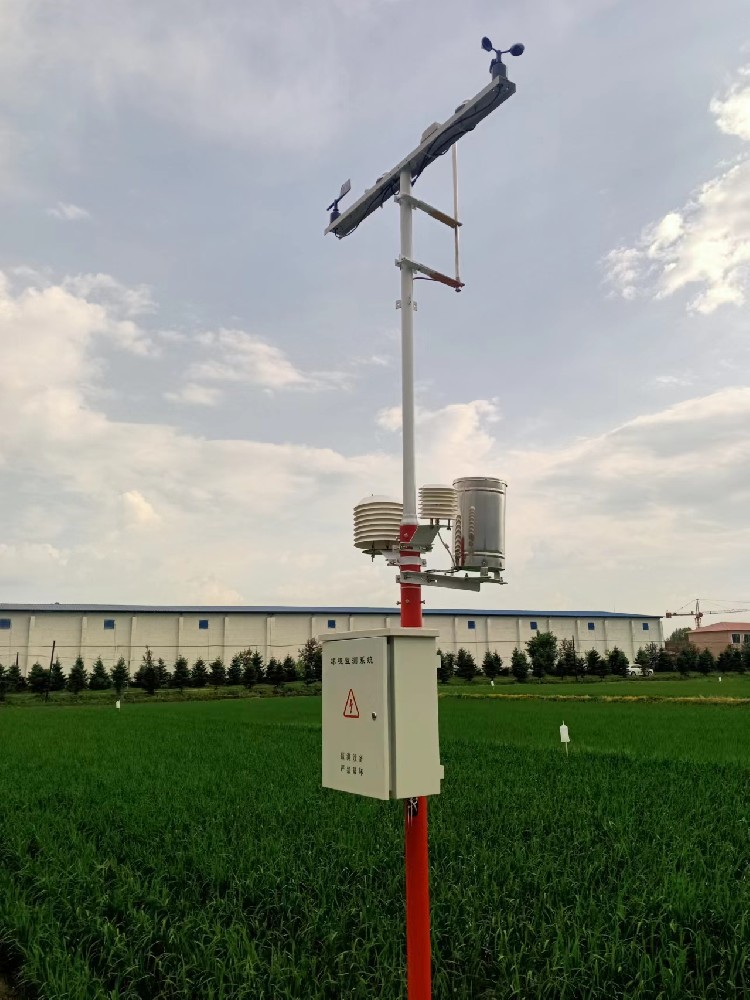
Ask for separate display fields for observations, forecast issue and valid times, and unavailable data. Confirm the acquisition interval and destination time zone. A network gateway should not silently replace a missing sensor value with a forecast value while leaving the same label.
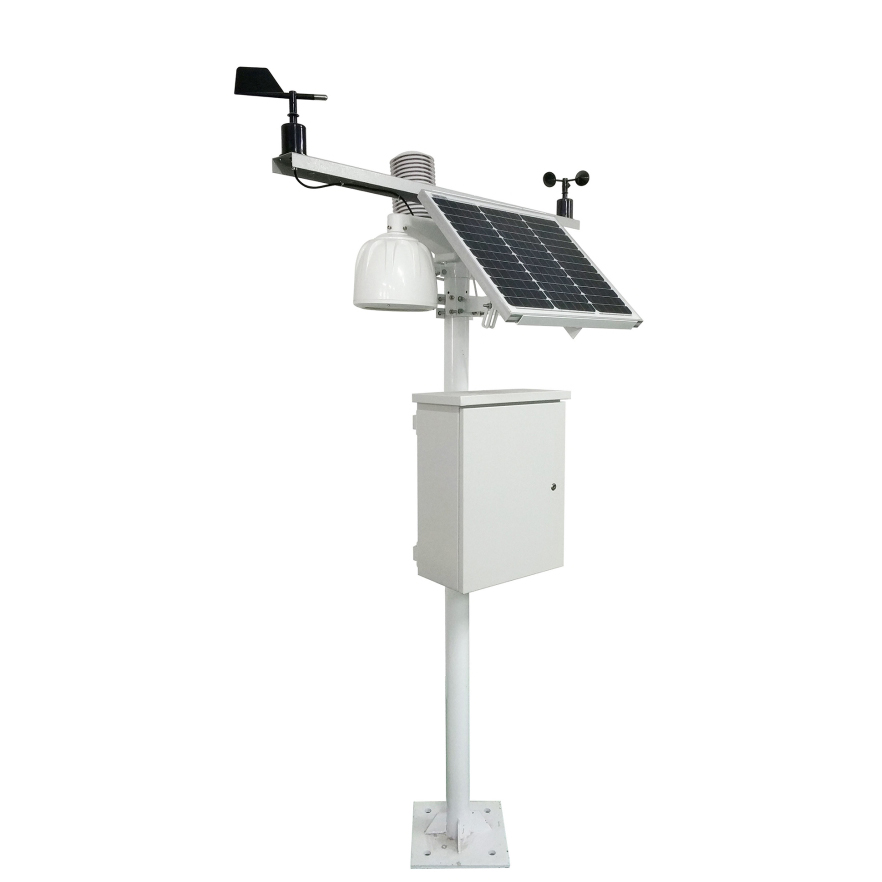
For an enquiry about weather stations for agriculture, describe the field decisions, existing forecast service, measurement locations and receiving system. NiuBoL can configure the observations and acquisition path; external forecast access, calculation and any control function need explicit scope. A station purchase does not automatically include a forecasting engine.
No. First compare quantities, periods, location, exposure and the data path. Calibration requires a suitable reference and method, not a forecast. An adjustment can conceal the real cause of the difference.
No. Probability and rainfall depth are separate forecast quantities. Keep them distinct from measured gauge accumulation and from water retained in the crop root zone.
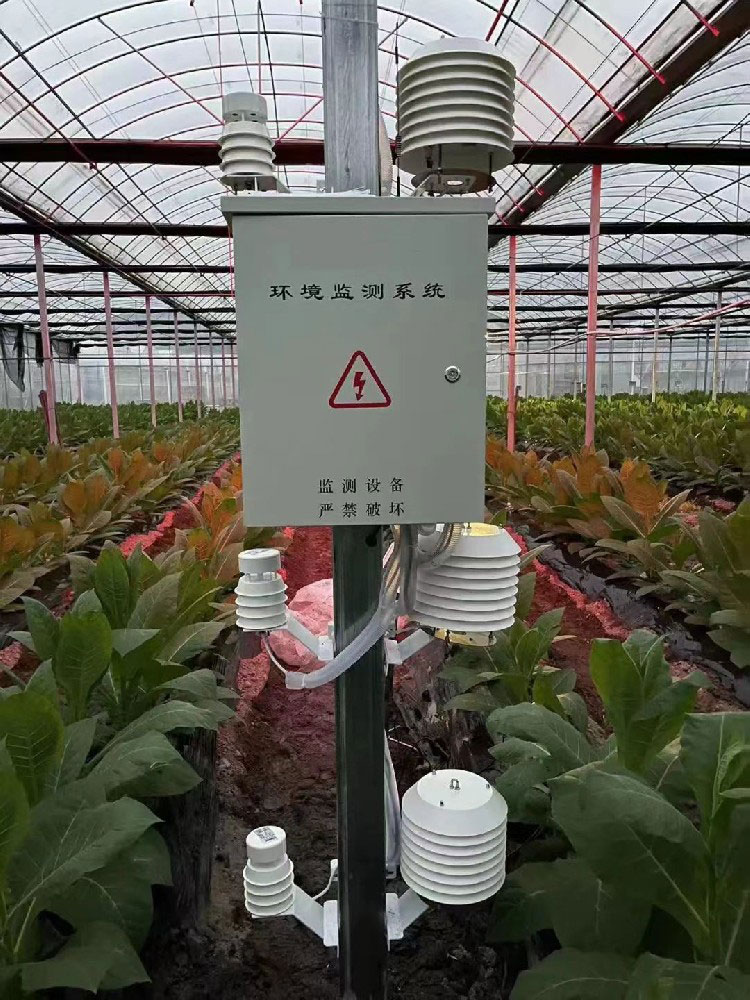
Not as the same observation. The greenhouse has different ventilation, radiation and moisture conditions. Use it for the internal crop environment and retain a separate outdoor reference where that comparison is needed.
They may report local station pressure and sea-level-corrected pressure respectively. Check the defined quantity, units and any correction before interpreting the difference as sensor error.
Not merely because it measures weather. Observation, forecasting and official warning functions are different. Retain the appropriate services and farm operating procedures rather than treating a local threshold alarm as an equivalent replacement.
Check actual observations against source channels, forecast source and valid periods, time-zone conversion and missing-data labels. Verify that measured, forecast and calculated values cannot be mistaken for one another on the operating screen.
Weather stations for agriculture add local observations to the farm's information, not a promise that every forecast will match the mast. Investigate differences by quantity, time, location and measurement quality. Keep observed, forecast and calculated fields distinct so staff can use each for the decision it actually supports.
Prev:Precision Agriculture Sensors for PLC Integration: Map Units and Outputs
Next:5-Acre Farm Sensor Configuration: Plan Points by Management Zone
Related recommendations
Sensors & Weather Stations Catalog
 Agriculture Sensors and Weather Stations Catalog-NiuBoL.pdf
Weather Stations Catalog-NiuBoL.pdf
Agriculture Sensors Catalog-NiuBoL.pdf
Water Quality Sensor Catalog-NiuBoL.pdf
Related products
 Combined air temperature and relative humidity sensor
 TDR Soil Moisture & Temperature Sensor for irrigation| RS485 |4-20mA| NBL-S-THR
 Soil pH sensor RS485 soil Testing instrument soil ph meter for agriculture |NBL-S-PH
 Wind Speed sensor Output Modbus/RS485/Analog/0-5V/4-20mA
 Tipping bucket rain gauge for weather monitoring auto rainfall sensor RS485/Outdoor/stainless steel
 Pyranometer Solar Radiation Sensor 4-20mA/RS485


Screenshot, WhatsApp to identify the QR code
WhatsApp number:+8615367865107
(Click on WhatsApp to copy and add friends)

