





— Blogs —
—Products—
 Consumer hotline +8618073152920
WhatsApp:+8615367865107
Address:Room 102, District D, Houhu Industrial Park, Yuelu District, Changsha City, Hunan Province, China
Product knowledge
Time:2024-11-21 14:06:10 Popularity:2393
A PM10 sensor reports an estimate of airborne particle mass concentration for the PM10 size fraction, usually in ug/m3. In an optical device, scattered light is converted into the reported concentration through the instrument's measurement and conversion method. The NiuBoL NBL-W-PM provides PM2.5 and PM10 channels using laser scattering. It does not identify particle chemistry, measure every airborne pollutant or establish regulatory compliance simply by returning a concentration value.

PM10 refers to an airborne particle fraction defined around a nominal aerodynamic diameter of 10 micrometres and below. The EPA explanation of particulate size fractions uses aerodynamic diameter to distinguish PM10 and PM2.5. Aerodynamic size concerns particle behaviour in air, not only geometric width. The fraction can contain particles from several sources. A PM10 concentration therefore does not tell the operator which chemical substances are present or which source caused a change.
PM2.5 is included within PM10; they are not independent mass categories to add together. TSP, or total suspended particulate matter, is a different measurement category. A sensor supplying PM10 and PM2.5 does not automatically supply TSP, particle number concentration, silica concentration or a complete air-quality index.

A fan moves sampled air through the NBL-W-PM's optical sensing arrangement. Particles scatter the emitted laser light, and the device converts its response into concentration channels. The result depends on the sample reaching the sensor and the assumptions relating optical response to particle size and mass. It is not direct weighing of every particle passing through the housing.
Gravimetric and beta-attenuation instruments use different measurement approaches and complete sampling arrangements. They should not be presented as selectable operating modes of this laser sensor. For a project requiring a particular reference or accepted method, specify that method explicitly rather than assuming any device labelled PM10 can replace it.
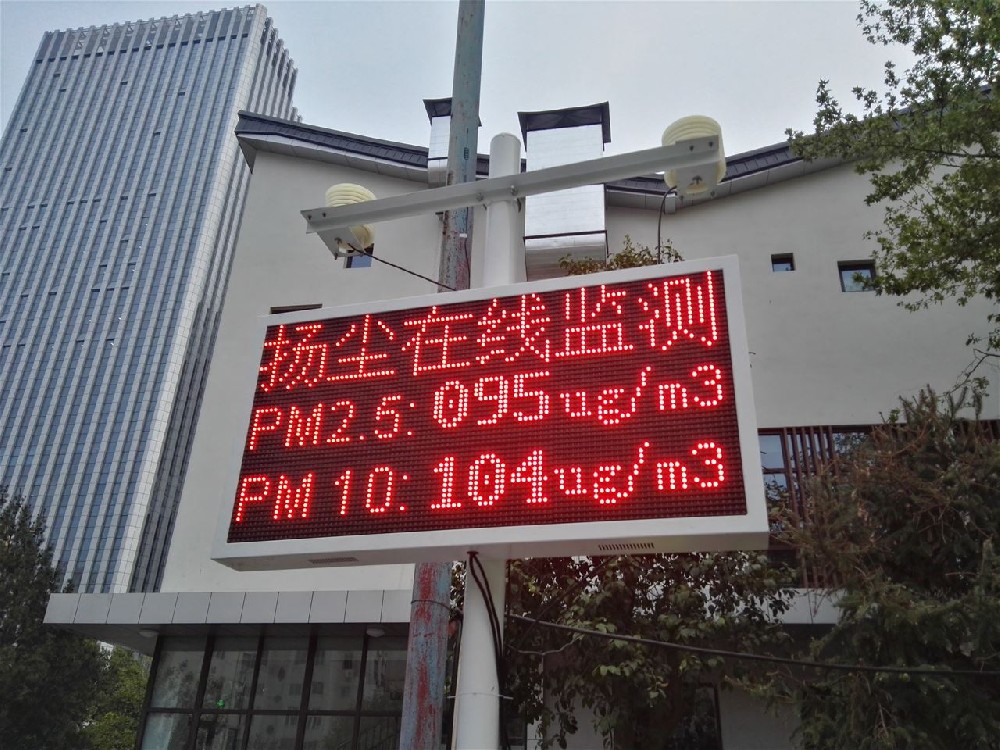
| Parameter | NBL-W-PM specification | Integration consequence |
|---|---|---|
| PM10 range | 0-2000 ug/m3 | Mass concentration, not particle count or a visibility distance |
| PM2.5 range | 0-1000 ug/m3 | A separate field within the same particulate fraction system |
| Error terms | +/-15% and +/-10 ug/m3 at 25 C, 50% RH | Retain both terms and their conditions when defining acceptance. |
| Minimum detectable particle | 0.3 um diameter | Not a separate PM0.3 concentration channel or the PM10 size definition |
| Supply and consumption | DC 12-24 V; 350 mW | Include the logger and communications separately in a station power budget. |
| Output | RS485; Modbus RTU for the specified standalone RS485 version | Verify the actual device version and map both concentration fields. |
| Serial settings | 9600 bps, 8 data bits, no parity, 1 stop bit; communication interval at least 1000 ms | Match the acquisition port before interpreting a missing response. |
| Environment and cable | -20 to 60 C; 0-99% RH; standard cable 2.5 m | Humidity range is not permission for wetting or condensation. |
The NBL-W-PM PM2.5/PM10 integrated sensor is a component of a monitoring system, not the entire outdoor station. Its selected supply, sampling arrangement, acquisition configuration and installation conditions must be considered together. Do not infer an enclosure rating, extra output or maintenance-free operation from the appearance of a louvered housing.
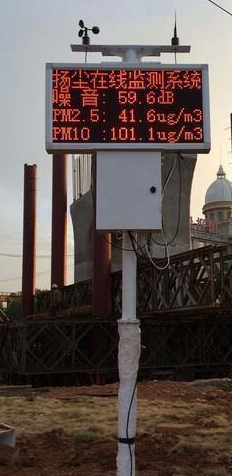
A PM10 value in ug/m3 is a mass-per-air-volume result. A particle count needs a count-per-volume unit and a defined size interval. Gas concentrations reported in ppm are another quantity again. There is no universal conversion from a particulate mass value to a gas ppm value or to the number of particles without additional information and assumptions.
Likewise, a larger PM10 channel than PM2.5 does not identify a particular dust source. Their difference can be examined as a coarse-fraction estimate only with compatible measurement conditions and attention to uncertainty. A subtraction is not a chemical analysis. Keep both original channels available instead of retaining only an unexplained derived number.
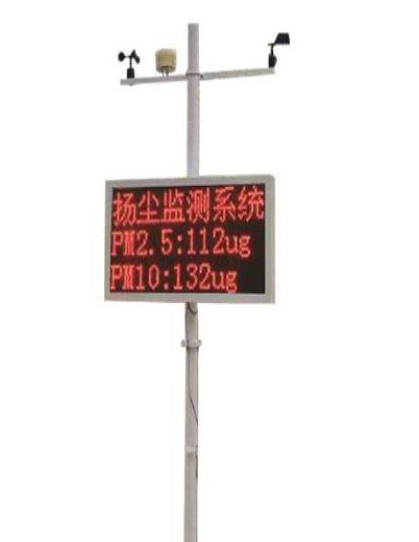
Install the NBL-W-PM vertically and avoid direct forced airflow from nearby fans. Keep the intended sampling path open; a sealed cabinet can prevent representative air reaching the sensor. Prevent wetting and sticky contamination from oil or similar deposits. Do not disassemble the precision optical assembly or use corrosive liquid on it as a routine cleaning method.
High moisture can affect optical particle readings. The EPA Enhanced Air Sensor Guidebook discusses moisture-related overestimation and other influences on sensor observations. A humid-period increase warrants checking conditions and the sample path; it should not be automatically deleted or treated as proof of a new dust source.
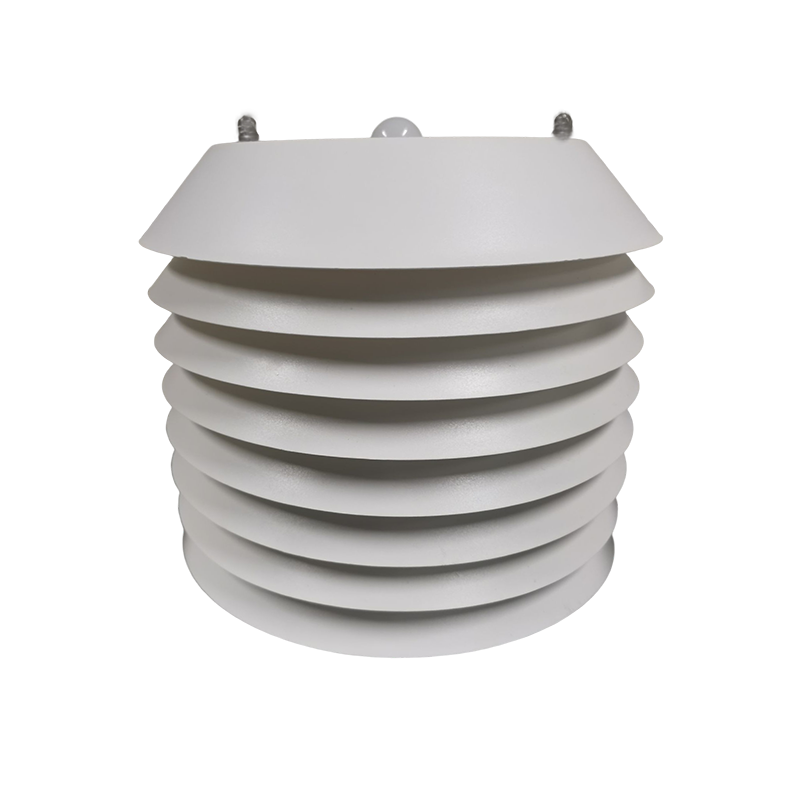
For the specified standalone RS485 version, the real-time read retrieves two registers starting at address 0x0000: PM2.5 first and PM10 second. The values use ug/m3. Check register order, units and acquisition time at the logger and final application. A valid Modbus RTU reply does not demonstrate that the receiving screen has labelled both fields correctly.
For construction-site trends, environmental displays or industrial area observations, define the location and reporting interval attached to each value. A fixed ambient point is not a personal exposure measurement. The EPA air-sensor performance guidance distinguishes non-regulatory sensor uses from regulatory monitoring requirements. It does not constitute approval of a particular NiuBoL configuration.
For an integration enquiry, provide NiuBoL the measurement purpose, expected concentration conditions, installation exposure, logger interface and intended use of alerts. If formal reporting or a specific accepted method is required, identify it before choosing the sensor. An attractive display and a broad range are not enough to resolve that requirement.
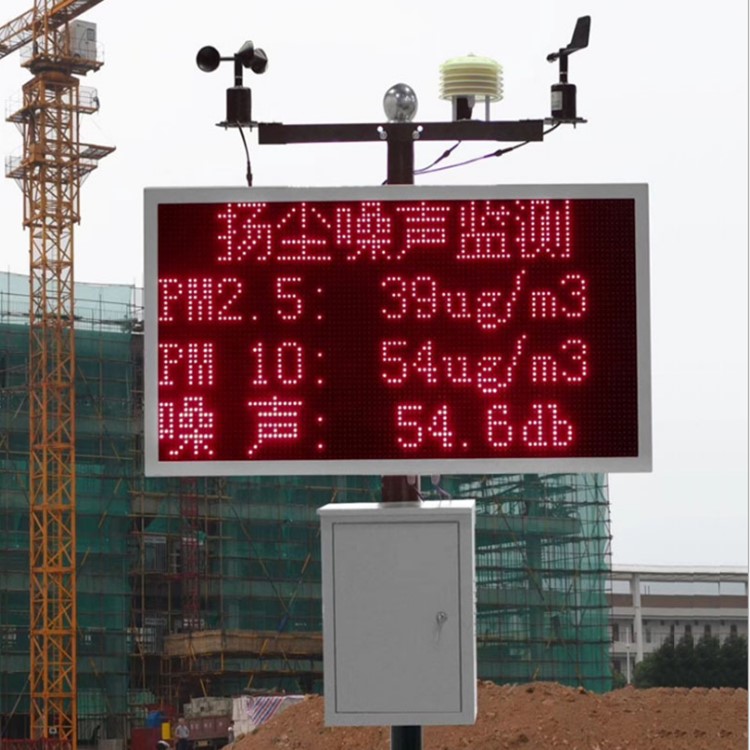
Not exactly. The PM10 fraction is defined in terms of aerodynamic size and a measurement method. An optical sensor converts its response into an estimate of that fraction; a geometric cutoff alone does not describe the complete measurement.
No. PM2.5 is included within PM10, so adding them double counts part of the fraction. Neither channel automatically supplies TSP or a complete particle-size distribution.
No. It is the minimum-detection particle specification, not a promise of response below that size or a separate concentration output. Use the actual PM2.5 and PM10 channels for the stated configuration.
No. The reported optical mass estimates do not identify chemical composition or uniquely determine the source. Those questions need an appropriate additional sampling and analysis method.
It can help interpret conditions affecting the optical observation. High moisture or wetting can influence the response, but humidity alone does not prove that every concentration increase is an artifact. Investigate the sample path and concurrent conditions.
No. RS485 describes the field interface. Suitability for a reporting requirement depends on the required method, instrument acceptance and measurement arrangement, not the existence of a digital concentration value.
Product document: NBL-W-PM PM2.5/PM10 Integrated Sensor Manual (PDF).
 NBL-W-PM25-PM10-Integrated-sensors-Manual.pdf
A PM10 sensor is useful when its measurement quantity and method fit the project's purpose. Keep PM10 distinct from particle count, gas concentration and chemical composition. The NiuBoL NBL-W-PM can supply two particulate channels to a compatible acquisition system, with installation and interpretation that respect the optical measurement's limits.
Prev:Multi-Sensor Weather Station: Measured Channels and Calculated Results
Next:Rain Gauge Weather Station: When Extra Measurements Add Useful Context
Related recommendations
Sensors & Weather Stations Catalog
 Agriculture Sensors and Weather Stations Catalog-NiuBoL.pdf
Weather Stations Catalog-NiuBoL.pdf
Agriculture Sensors Catalog-NiuBoL.pdf
Water Quality Sensor Catalog-NiuBoL.pdf
Related products
 Combined air temperature and relative humidity sensor
 TDR Soil Moisture & Temperature Sensor for irrigation| RS485 |4-20mA| NBL-S-THR
 Soil pH sensor RS485 soil Testing instrument soil ph meter for agriculture |NBL-S-PH
 Wind Speed sensor Output Modbus/RS485/Analog/0-5V/4-20mA
 Tipping bucket rain gauge for weather monitoring auto rainfall sensor RS485/Outdoor/stainless steel
 Pyranometer Solar Radiation Sensor 4-20mA/RS485


Screenshot, WhatsApp to identify the QR code
WhatsApp number:+8615367865107
(Click on WhatsApp to copy and add friends)

