


— Blogs —
—Products—
 Consumer hotline +8618073152920
 WhatsApp:+8615367865107
Address:Room 102, District D, Houhu Industrial Park, Yuelu District, Changsha City, Hunan Province, China
Product knowledge
Time:2026-06-27 11:40:05 Popularity:27
Field capacity is a key baseline for soil moisture analysis, irrigation scheduling and drought assessment. Without a reliable field-capacity value, relative soil moisture and drought evaluation can become inconsistent across sites.
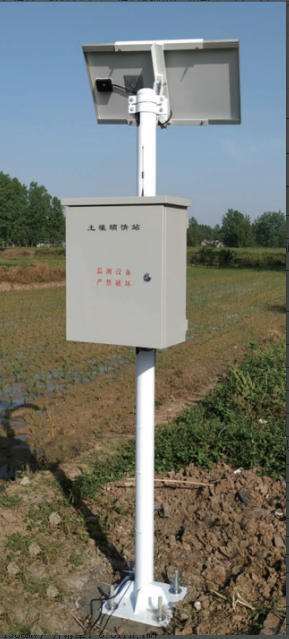
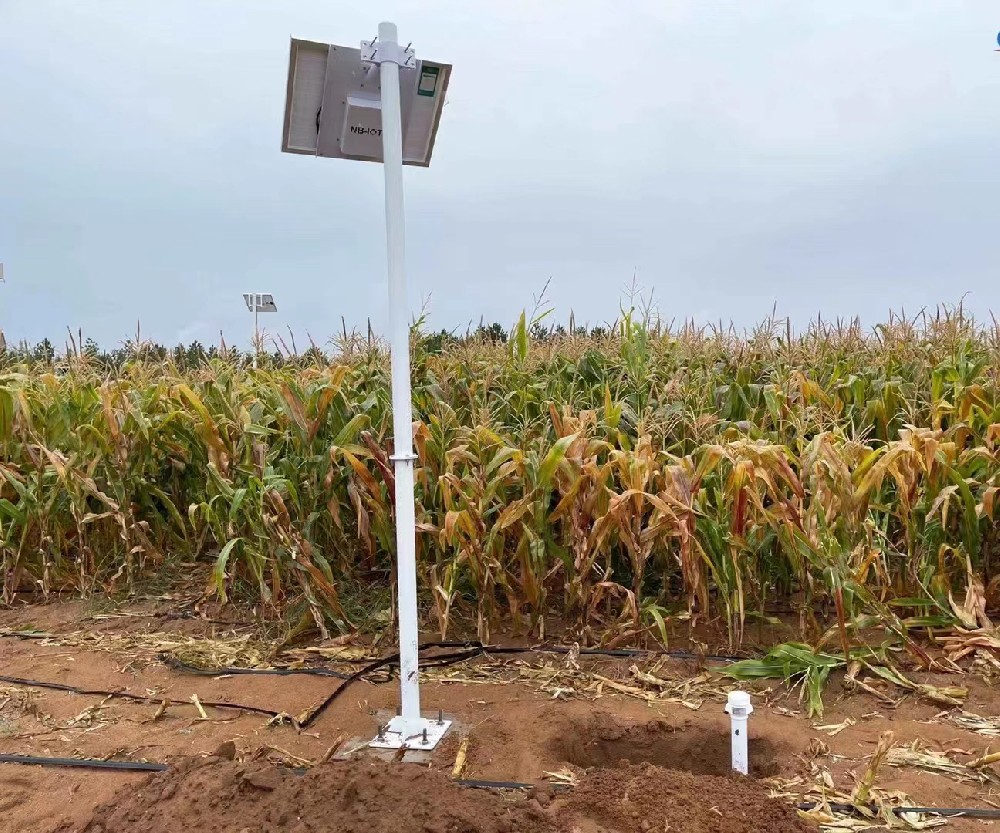
A practical method for using an automatic soil moisture monitoring station to determine field capacity follows this workflow: select a stable station, saturate the soil around the tube sensor, prevent evaporation, record hourly data and use the curvature method to determine the equilibrium moisture value.
Common methods include field measurement and laboratory measurement. Field methods include natural rainfall and frame flooding. Laboratory methods include sand box, Wilcox and pressure membrane methods. For automatic soil moisture stations, the referenced method is NY/T 3678-2020 soil field capacity determination by frame flooding instrument method.
| Item | Project Value From Field Capacity Method | Engineering Note |
|---|---|---|
| Measurement target | Field capacity after saturation, drainage and water redistribution | Baseline for drought and soil moisture analysis |
| Reference method | NY/T 3678-2020 soil field capacity determination by frame flooding instrument method | Use as a project method reference |
| Test area | 2 m x 2 m embankment around tube sensor probe; inner test area about 1 m² | Protects the measurement zone |
| Embankment height | About 30 cm high and 30 cm bottom width | Prevents water loss from the test zone |
| Wooden frame depth | About 20 cm into soil | Separates test area while protecting cables |
| Estimated irrigation volume | Sandy soil about 1.4 m³; loam and clay about 1.8 m³ | Saturates the target soil layer |
| Data interval | One reading per hour before and after flooding | Builds moisture-time curve |
| Calculation | Curvature method using soil moisture curve versus time | Identifies equilibrium point |
| Station requirement | Stable operation for more than one year; tube sensor after one freeze-thaw period where applicable | Reduces installation disturbance error |
Select a field that represents local soil texture, crop cultivation conditions and a certain planting scale. Avoid slope and ridge positions. Water access should be convenient because the flooding process requires enough water.
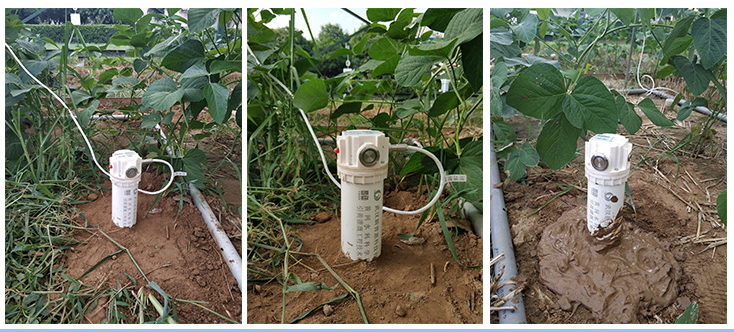
Build a square embankment around the tube sensor probe. A practical field setup uses a 2 m x 2 m embankment, about 30 cm high and 30 cm bottom width. A wooden frame is placed at the central sensor position to form the test area while avoiding cable damage.
Before irrigation, place dry grass, straw or other material on the surface to reduce soil structure disturbance. Estimated water volume is about 1.4 m³ for sandy soil and 1.8 m³ for loam or clay. After flooding, cover the area with straw and plastic film to reduce evaporation and rainfall intrusion.
Keep the monitoring station running before and after flooding. Hourly collection from the tube soil temperature and moisture sensor provides the data needed for calculation. Plot soil moisture versus time, calculate curvature and identify the point where curvature becomes nearly horizontal. The corresponding moisture value is taken as field capacity.
Field capacity is the relatively stable soil water content maintained after sufficient irrigation or precipitation, drainage and prevention of evaporation. It is important for drought indicators because it provides a local reference point for interpreting soil moisture data.
For a system integrator, field capacity is not only a laboratory value. It affects alarm thresholds, irrigation decisions and whether different monitoring stations can be compared.
Many soil moisture projects stop at displaying percentage values. Field capacity testing makes those values more meaningful because it creates a local soil-water baseline. Two fields may show the same volumetric water content but have different crop water availability if their texture and structure differ.
For irrigation districts, field capacity supports better threshold setting. For drought monitoring, it helps convert raw moisture into relative moisture indicators. For research stations, it provides a documented method that can be repeated or audited.
| Record Item | What to Record | Reason |
|---|---|---|
| Station ID | Collector ID, sensor ID and field block | Connects data to the right location |
| Soil condition | Texture, crop and field representativeness | Explains water redistribution behavior |
| Sensor information | Depth, installation date and calibration status | Supports later data interpretation |
| Flooding record | Start time, water volume and covering method | Links event to moisture curve |
| Data export | Hourly values and timestamps | Required for curvature calculation |
After field capacity is determined, the value should be written into the station file and used when setting alarm thresholds. For example, irrigation warning, drought warning and relative moisture calculation should refer to the local field-capacity baseline rather than a generic value copied from another soil type. This is especially important for irrigation districts, dryland farms and monitoring networks that include several soil textures.
The result should also be reviewed when crop root depth changes or when the sensor is moved. Field capacity belongs to a soil profile and installation condition, not only to a sensor model. If the station is relocated, the previous value should not be reused without verification.
After the field-capacity value is determined, irrigation thresholds can be written as project rules. For example, the operator may define a warning band below the crop’s working moisture range and an upper band after irrigation. The exact value should be set by crop, soil texture and growth stage, but field capacity provides the reference point for building those rules.
This is why a soil moisture station should not be accepted only by checking whether data appears online. The owner should confirm whether the data can support irrigation decisions, drought reports and later comparison between fields. If the project includes several stations, each representative soil type should have its own documented baseline.
Site challenge: Different stations require comparable local baselines.
System integration plan: Determine field capacity for representative soil types and apply it to station thresholds.
User value: Drought indicators become more consistent and defensible.
Site challenge: Irrigation decisions require soil water reference values.
System integration plan: Use automatic station data to define local field capacity and root-zone response.
User value: Water scheduling can be based on measured soil behavior.
Site challenge: Manual sampling cannot provide enough temporal detail.
System integration plan: Use hourly automatic records during drainage and redistribution.
User value: Researchers can identify equilibrium more clearly.
Site challenge: A station may be online but not calibrated to local soil.
System integration plan: Include field capacity test and sensor calibration in acceptance.
User value: The project delivers usable moisture interpretation, not only online data.
Testing too soon after sensor installation, before soil around the probe stabilizes.
Using a site that does not represent the farm soil texture.
Damaging the sensor cable or disturbing the test soil during frame setup.
Allowing evaporation or rainfall intrusion during redistribution.
Missing data during the period when the moisture curve approaches equilibrium.
A complete deliverable should include the station ID, installation depth, field photos, flooding record, hourly raw data, moisture curve, curvature calculation result and final field-capacity value. This turns the measurement into a traceable project document that can be reviewed later by the owner or a technical consultant.
Use stable stations with long installation time to reduce soil disturbance.
Prefer tube sensors where multi-depth profile data is required.
Confirm data export interval and time stamps before the flooding test.
Avoid measurement during soil freezing period.
Plan at least one calibration experiment for tube sensors.
The station must maintain communication during the whole test. If the network is unstable, local storage should be enabled. Sensor depth, field block, soil type, irrigation volume and covering time should be recorded in the project file.
A: Field capacity is the stable soil water content after sufficient wetting, drainage and evaporation prevention.
A: It provides a local reference for irrigation thresholds instead of relying on a generic moisture percentage.
A: NY/T 3678-2020 is referenced for soil field capacity determination by the frame flooding instrument method.
A: Hourly station data provides a moisture-time curve that is easier to analyze than scattered manual readings.
A: A square embankment around the tube sensor probe protects the test area and prevents water loss.
A: A practical estimate is about 1.4 m3 for sandy soil and 1.8 m3 for loam or clay, adjusted on site.
A: The curvature method identifies the point where the soil moisture curve approaches equilibrium after drainage.
A: Recent installation disturbance, poor site selection, cable damage, evaporation, rainfall intrusion or missing hourly data can reduce reliability.
A: Provide station ID, sensor depth, field photos, flooding record, raw data, curve analysis and final field-capacity value.
A: Retest when the sensor is moved, soil conditions change significantly or the monitoring station is rebuilt.
Field capacity measurement turns an automatic soil moisture station from a data display device into a soil-water decision tool. A controlled flooding method, hourly data and careful documentation help buyers build more reliable irrigation and drought assessment systems.
Related recommendations
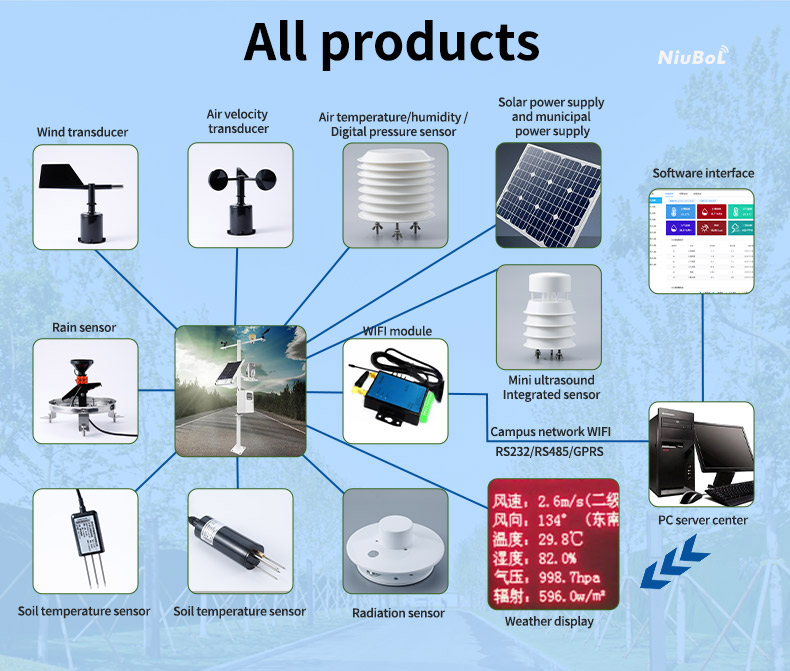
Sensors & Weather Stations Catalog
 Agriculture Sensors and Weather Stations Catalog-NiuBoL.pdf
Weather Stations Catalog-NiuBoL.pdf
Agriculture Sensors Catalog-NiuBoL.pdf
Water Quality Sensor Catalog-NiuBoL.pdf
Related products
 Combined air temperature and relative humidity sensor
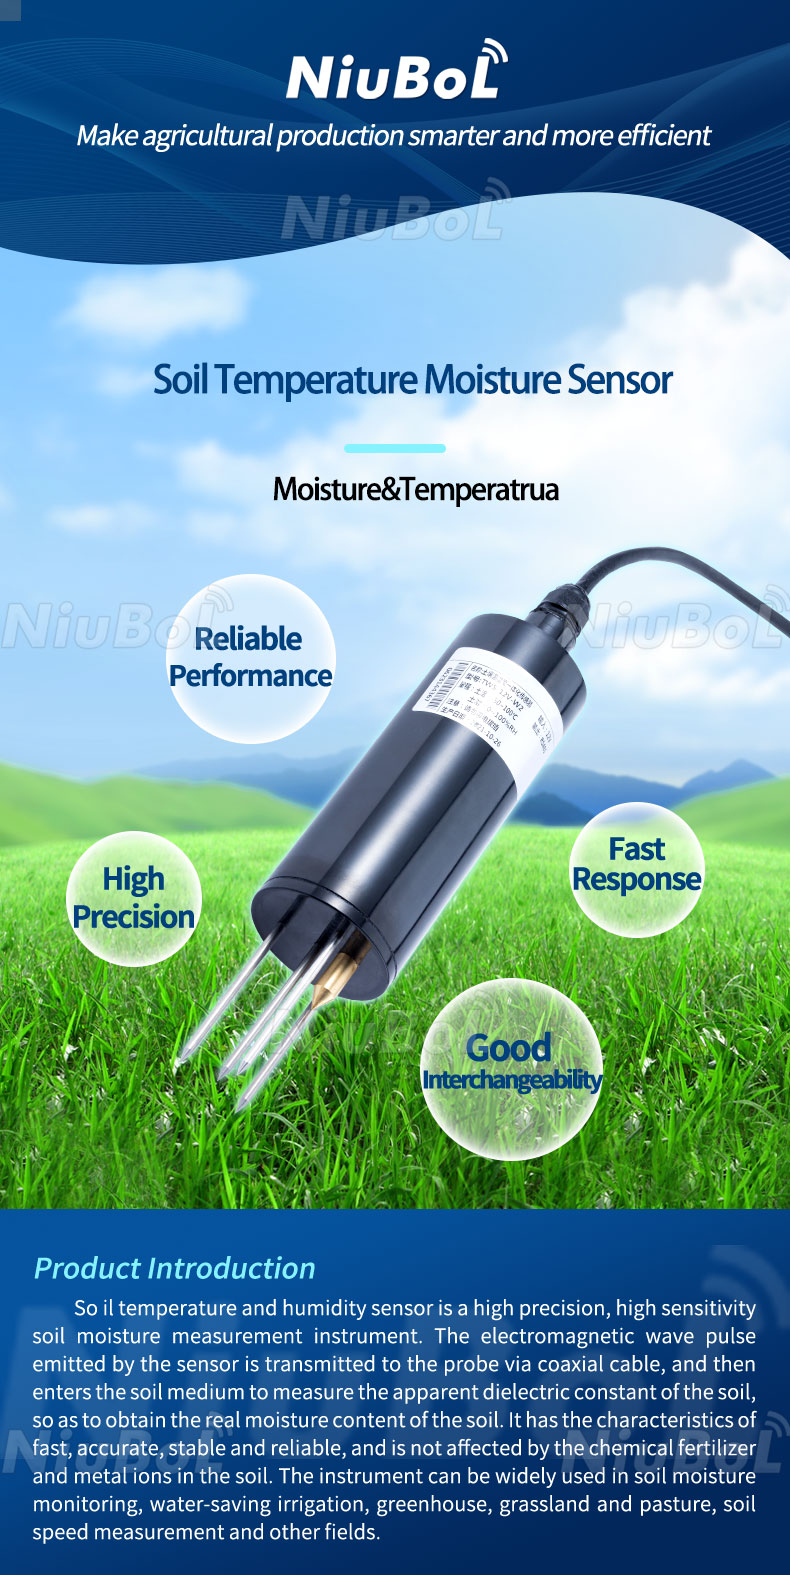
 Soil Moisture Temperature sensor for irrigation|NBL-S-THR
 Soil pH sensor RS485 soil Testing instrument soil ph meter for agriculture |NBL-S-PH
 Wind Speed sensor Output Modbus/RS485/Analog/0-5V/4-20mA
 Tipping bucket rain gauge for weather monitoring auto rainfall sensor RS485/Outdoor/stainless steel
 Pyranometer Solar Radiation Sensor 4-20mA/RS485

Screenshot, WhatsApp to identify the QR code
WhatsApp number:+8615367865107
(Click on WhatsApp to copy and add friends)
