


— Blogs —
—Products—
 Consumer hotline +8618073152920
 WhatsApp:+8615367865107
Address:Room 102, District D, Houhu Industrial Park, Yuelu District, Changsha City, Hunan Province, China
Product knowledge
Time:2026-06-20 15:45:19 Popularity:10
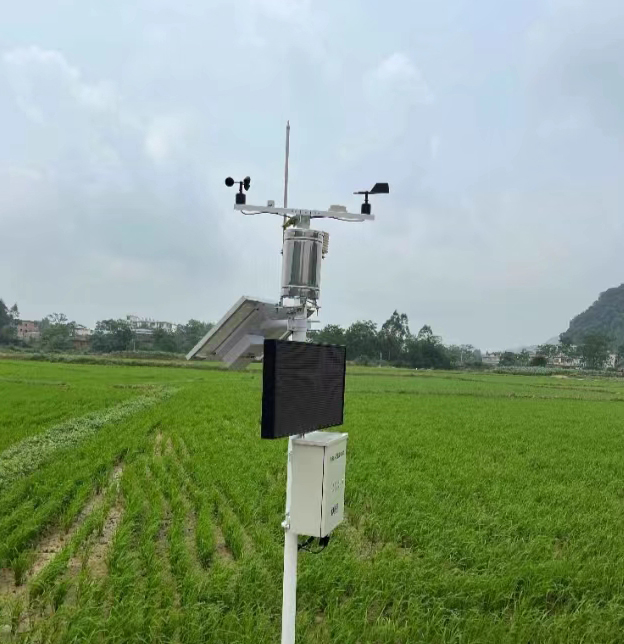
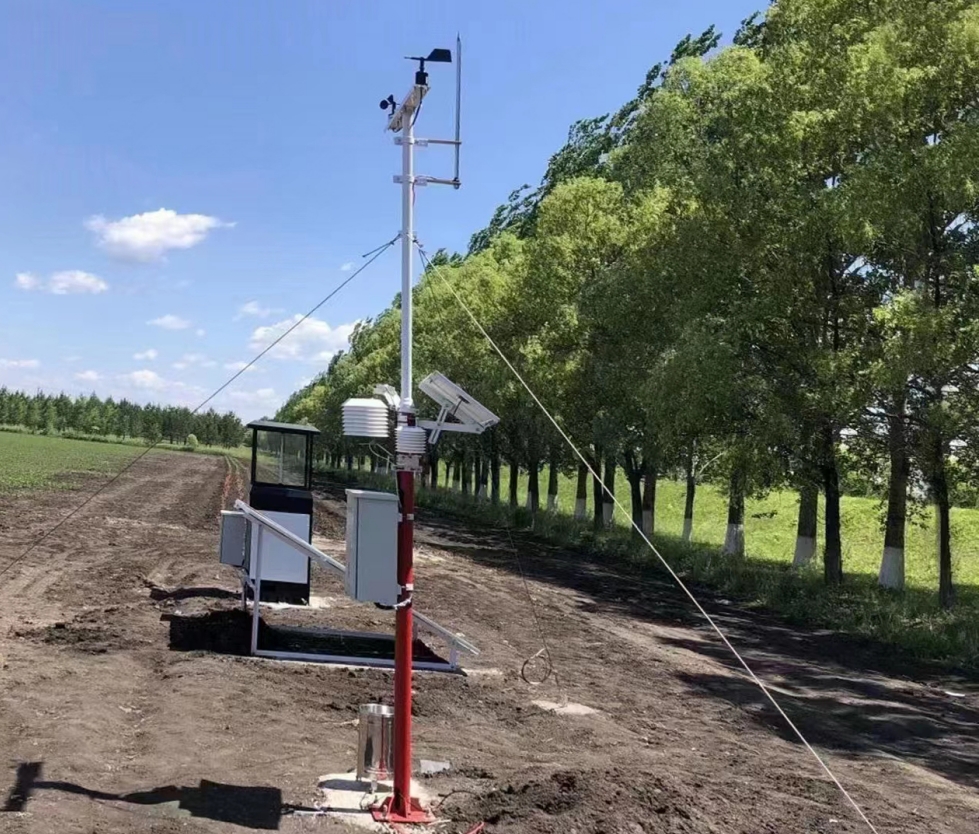
A farmland microclimate observation station focuses on the near-surface environment around crop canopies and soil layers. Unlike a general weather reference point, it records the local conditions that directly affect crop growth, field management, pest risk, irrigation timing, and environmental improvement measures. For integrators, the station is valuable because it can become a compact monitoring node for agriculture, forestry, environmental service, campus education, and field research projects.
Farmland microclimate refers to the physical and biological environment formed between the crop canopy, the near-ground air layer, and the soil. It includes radiation, air temperature, humidity, wind, carbon dioxide, soil temperature, and soil moisture. These conditions can differ greatly from a regional weather station, especially in orchards, greenhouses, dense planting areas, and protected cultivation zones.
For project planning, this means a microclimate station should be installed where it reflects the crop management question. A station placed only for easy access may produce clean data, but the data may not represent the crop zone that the owner actually needs to manage.
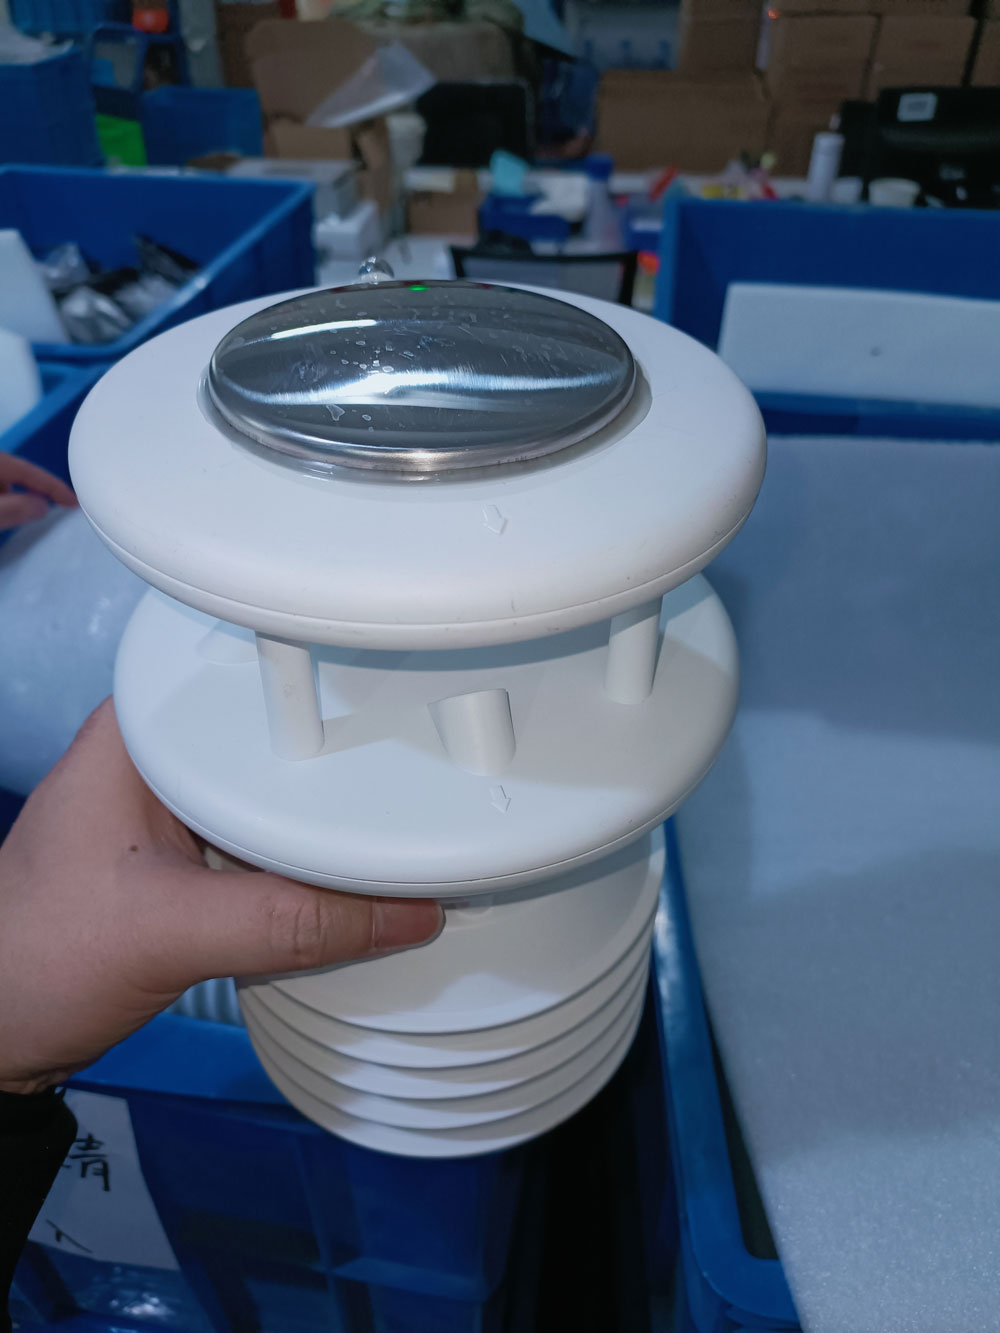
The NiuBoL farmland microclimate solution can use a ten-element integrated sensor to monitor wind speed, wind direction, air temperature, humidity, atmospheric pressure, light, optical rainfall, PM2.5, PM10, and noise. The integrated structure reduces wiring complexity and helps contractors install a complete outdoor monitoring node quickly.
Compared with traditional ultrasonic designs, the integrated approach is designed to reduce measurement issues related to startup delay, demodulation delay, and temperature change. The hidden ultrasonic probe cap helps reduce interference from rain, snow, and natural wind disturbance, while the ASA shell and IP65 protection support long-term outdoor deployment.
| Model / Component | Measured Parameter | Project Use |
|---|---|---|
| NBL-W-10GUWS ultrasonic weather station | Wind speed, wind direction, temperature, humidity, pressure, light, optical rainfall, PM2.5, PM10, noise | Compact multi-parameter node for farmland, forestry, and outdoor monitoring |
| Optical rainfall module | Rainfall event and intensity reference | Supports irrigation review and weather event records |
| PM2.5 and PM10 module | Particulate matter | Useful where farmland is near roads, construction, or dust sources |
| Noise monitoring | Environmental noise | Adds site environment evidence for mixed-use project areas |
| RS485 and 4G options | Digital data transmission | Supports platform integration, gateway upload, and remote operation |
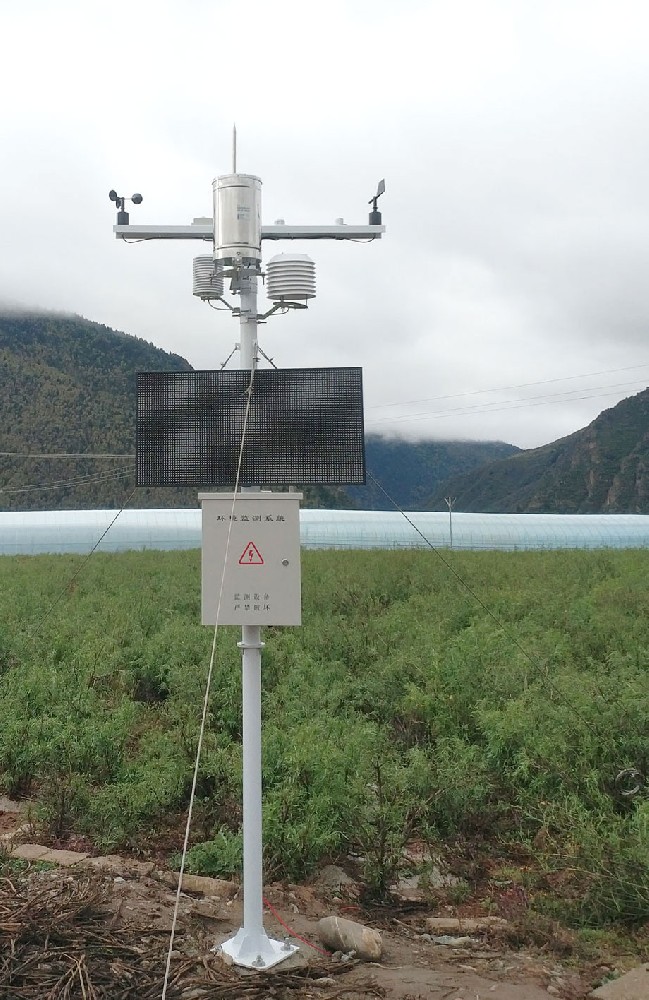
| 3m carbon steel support | Field mounting structure | Provides stable sensor height and outdoor installation convenience |
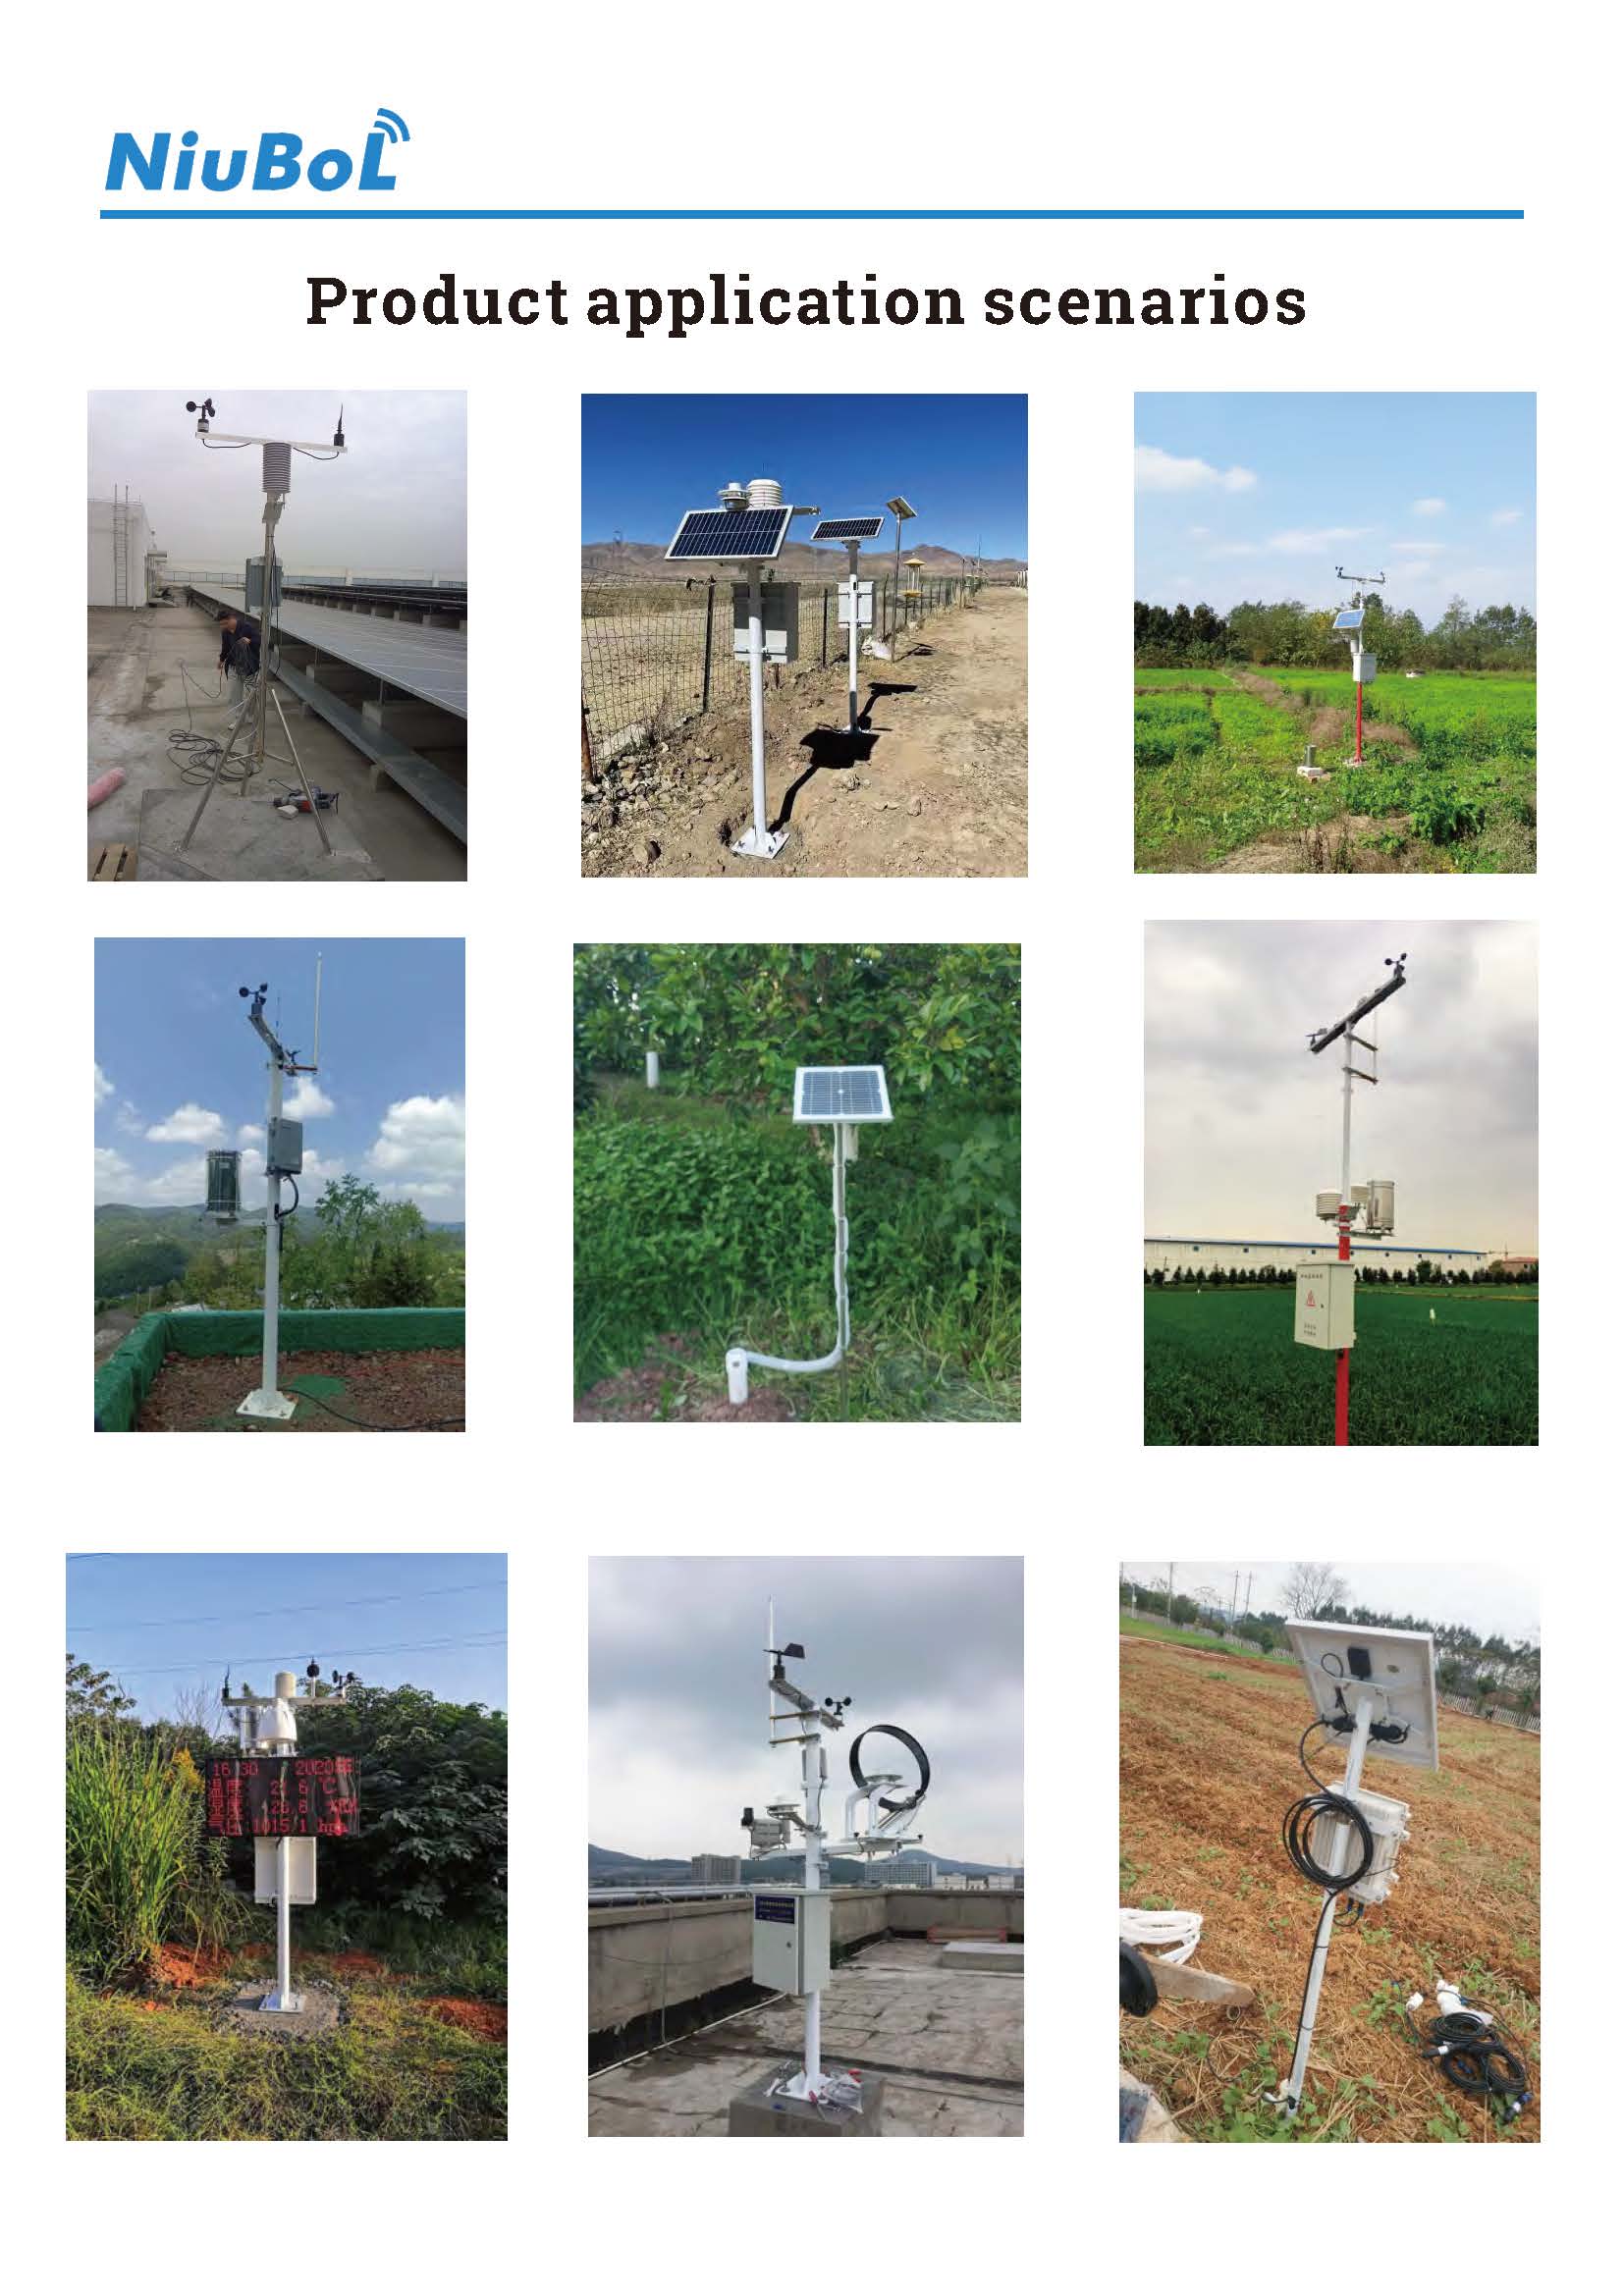
In agriculture, microclimate data supports crop climate assessment, field technique evaluation, pest and disease warning, disaster prevention, and farmland environmental improvement. In forestry, it can help compare shaded and open areas. In environmental projects, it provides local weather context for air quality or dust data.
For integrators, one advantage is repeatability. The same station architecture can be used in farms, research parks, campus education, forestry sites, and environmental monitoring points, while the platform can show different dashboards for different owners.
The station can output multiple parameters through digital communication. For RS485 systems, register mapping, device address planning, and polling frequency should be confirmed before installation. For 4G systems, platform compatibility, upload interval, and signal quality should be tested on site.
The most useful platform design shows live values, parameter curves, station status, alarm records, and historical export. It should also preserve units and sensor names clearly, because microclimate projects often involve several parameters that are reviewed together rather than separately.
Sensor height, obstruction clearance, support stability, solar panel direction, cable protection, and gateway placement all influence long-term performance. In crop areas, the station should be close enough to represent the field, but not so close that leaves, irrigation spray, or machinery disturb the sensors.
For multi-site projects, using consistent installation height and orientation makes comparison more meaningful. When stations are installed at different heights or near different obstructions, the platform should record those conditions so the data can be interpreted correctly.
Choose the parameter set according to project objectives. If the owner needs crop climate and irrigation context, temperature, humidity, wind, radiation, rainfall, and soil data should be prioritized. If the site also involves environmental supervision, PM2.5, PM10, and noise can add value.
For procurement, confirm protection level, sensor material, communication method, mounting structure, power plan, platform support, and maintenance requirements. A compact station can reduce installation labor, but the full project should still include commissioning records and data acceptance criteria.

A useful deployment starts with one representative station in each crop or management zone. The station records weather, rainfall, light, and local environmental data, while soil sensors can be placed where irrigation decisions are made. The platform then combines the station and soil data into one view for the farm manager or service provider.
After the first season, the owner can compare data against yield, disease events, irrigation records, and field observations. This makes the monitoring station part of a management process rather than a device that only displays current weather.
A service provider can use microclimate records to explain field differences that are not visible during a short site visit. For example, two plots may receive similar regional weather, but one may show higher humidity, lower wind, or lower light because of surrounding terrain or crop structure. This evidence helps guide agronomy recommendations.
The station also gives contractors a way to deliver ongoing service after installation. Monthly data summaries, abnormal weather records, and comparison charts can help the owner see the relationship between field management and local environmental changes.
Before confirming an integrated station, procurement teams should check each parameter range, shell material, protection rating, wind measurement principle, rainfall method, communication output, power consumption, support height, and platform compatibility. These details affect both installation cost and long-term service effort.
It is also useful to confirm whether replacement parts, wiring definitions, and protocol documents are available. Integrated equipment reduces wiring, but the project still needs clear documentation for troubleshooting, warranty communication, and future maintenance.
Microclimate projects are sometimes copied from one site to another without adjusting placement. This can weaken data value. A station for an orchard should consider canopy edge, irrigation influence, and wind exposure. A station for a greenhouse project may need soil and indoor environmental sensors rather than only outdoor weather data.
The better approach is to keep the device architecture consistent while adjusting placement and parameter emphasis by scenario. This gives integrators repeatable delivery without forcing every customer into the same monitoring layout.
A microclimate station should have a simple maintenance plan from the beginning. The plan can include visual inspection, bracket tightening, solar panel cleaning, cabinet check, communication test, and review of abnormal values after strong wind or heavy rain.
Service records are useful for both the owner and the integrator. They show that the station is being maintained as part of a project system, which improves confidence in historical data when it is used for management review.
Project owners usually need more than live values. Monthly summaries, rainfall event records, wind statistics, and parameter comparison charts help turn microclimate monitoring into a management tool. The platform should support export formats that can be used in reports without heavy manual editing.
For multi-site deployments, the report should group data by station, plot, crop, or management zone. This structure allows the owner to compare fields and identify which environmental differences deserve attention.
Local microclimate records help service teams explain recommendations with evidence. When humidity, light, wind, rainfall, and particulate data are stored together, the owner can see why one field may need a different management action from another field.
This supports more precise field service and helps the monitoring system stay relevant after the first installation stage.
Ordinary weather monitoring may describe regional conditions, while farmland microclimate monitoring records local conditions around crops and soil. Canopy structure, irrigation, terrain, planting density, and nearby facilities can change temperature, humidity, wind, radiation, and soil conditions. This local view is more useful for crop management and field-level decisions.
An integrated sensor reduces cabinet space, wiring work, connector points, and installation time. It is suitable for projects that need several parameters in one compact node. For integrators, it also simplifies platform mapping because multiple measurements can be acquired through one device interface.
These parameters are useful when the field is near roads, construction areas, industrial parks, storage yards, or other environmental sources. They help the owner understand whether local air and noise conditions may affect field work, environmental review, or nearby community concerns. They also provide context when weather and dust conditions change together.
Yes, but it should be connected to a management method. Humidity, temperature, rainfall, wind, and canopy conditions influence many pest and disease risks. The station provides the environmental record, while the platform or agronomy team defines thresholds, warnings, and field actions suitable for the crop and region.
RS485 is suitable for stable local acquisition and connection to data loggers or gateways. 4G is suitable when the station must upload data from remote farmland or forestry locations. Many projects use RS485 at the sensor level and 4G at the gateway level, which provides both device stability and remote access.
The number depends on crop area, terrain, irrigation zones, management blocks, and environmental variation. A small demonstration plot may need one station, while a larger farm may need several representative nodes. The best approach is to install stations where their data will support specific management or reporting decisions.
Useful documents include parameter ranges, wiring definition, communication protocol, register map, power requirements, installation drawing, protection level, and maintenance guidance. These documents help contractors connect the station to platforms, prepare installation materials, and complete commissioning with fewer on-site adjustments.
NiuBoL provides integrated weather sensing, flexible communication, outdoor installation support, and configurable monitoring options. The station can be applied to agriculture, forestry, environmental protection, campus education, and research projects where compact deployment and continuous parameter output are required.
A farmland microclimate observation station should be chosen around crop-zone reality, not only parameter quantity. The NiuBoL integrated ten-element solution helps contractors deploy a compact monitoring node with weather, rainfall, dust, and noise data, while RS485 and 4G options support platform connection. With correct placement, clear data structure, and practical maintenance planning, the station becomes a reliable tool for agriculture, forestry, environmental service, and research projects.
Prev:Agricultural Observation Station System Integration Guide for Crop Environment Monitoring
Next:Soil Moisture Monitoring Station Performance for Irrigation and Drought Management Projects
Related recommendations
Sensors & Weather Stations Catalog
 Agriculture Sensors and Weather Stations Catalog-NiuBoL.pdf
Weather Stations Catalog-NiuBoL.pdf
Agriculture Sensors Catalog-NiuBoL.pdf
Water Quality Sensor Catalog-NiuBoL.pdf
Related products
 Combined air temperature and relative humidity sensor
 Soil Moisture Temperature sensor for irrigation|NBL-S-THR
 Soil pH sensor RS485 soil Testing instrument soil ph meter for agriculture |NBL-S-PH
 Wind Speed sensor Output Modbus/RS485/Analog/0-5V/4-20mA
 Tipping bucket rain gauge for weather monitoring auto rainfall sensor RS485/Outdoor/stainless steel
 Pyranometer Solar Radiation Sensor 4-20mA/RS485

Screenshot, WhatsApp to identify the QR code
WhatsApp number:+8615367865107
(Click on WhatsApp to copy and add friends)
