


— Blogs —
—Products—
 Consumer hotline +8618073152920
 WhatsApp:+8615367865107
Address:Room 102, District D, Houhu Industrial Park, Yuelu District, Changsha City, Hunan Province, China
Product knowledge
Time:2026-06-25 10:58:34 Popularity:22
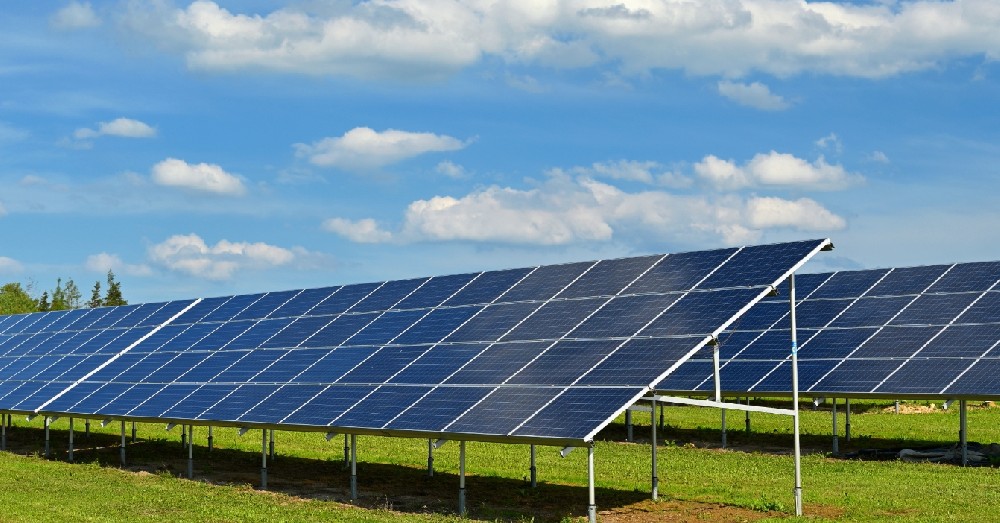
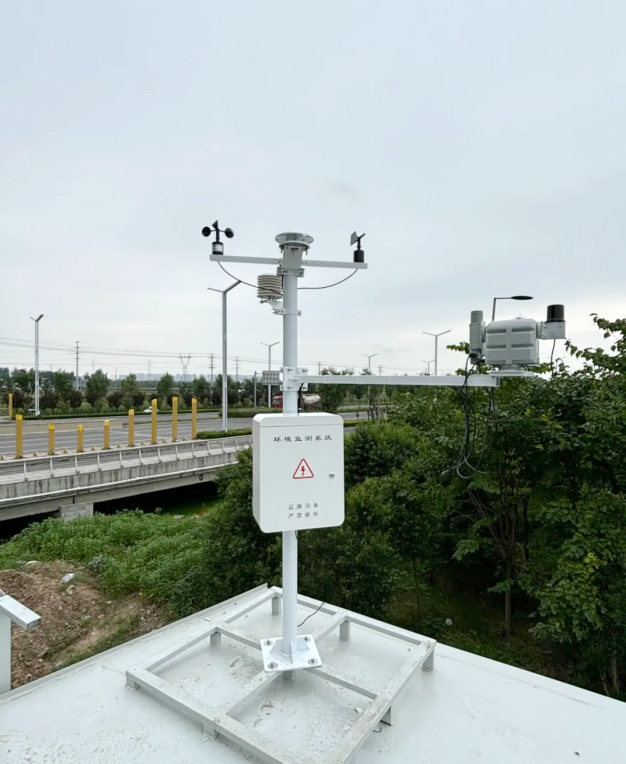
An online PV weather monitoring system is installed to explain why a photovoltaic plant produces the power it produces. Irradiance, module temperature, wind, humidity and pressure are not decoration values; they are the reference data used by owners, EPC contractors and O&M teams to compare expected generation with actual output.
For solar power projects, installation quality directly affects data quality. A pyranometer that is shaded, a wind sensor blocked by a mounting frame, or a module temperature sensor fixed poorly can create data that looks precise but misleads performance analysis. This article focuses on installation decisions that matter at site level.
PV power plants need meteorological data for performance ratio calculation, power forecasting, cleaning decisions and fault analysis. When irradiance is high but output is low, the O&M engineer must know whether the cause is module temperature, soiling, inverter limitation, shading, wind cooling or electrical fault. Without local weather data, the discussion becomes guesswork.
A practical PV monitoring station usually measures global irradiance, direct or diffuse radiation where required, tilted plane irradiance, UV or illuminance in some projects, PV module temperature, ambient temperature and humidity, wind speed, wind direction and atmospheric pressure. Some plants add rainfall and soiling sensors to support cleaning schedules.
The PV weather station sits outside the power conversion equipment but connects tightly with plant operation. Sensors send data to a collector, logger, RTU or gateway. The data then enters the monitoring platform, SCADA system or performance analysis software. For plant owners, the station is a reference instrument; for EPC teams, it is part of acceptance and long-term O&M handover.
The station should be installed where it represents the PV array, not where it is easiest to mount. The pyranometer plane, module temperature sensor location and wind sensor clearance should be decided before civil installation. Access for cleaning, calibration and inspection should also be included in the layout.
PV weather monitoring projects commonly use RS485 and Modbus RTU because the collector must read several sensors in one cabinet or field station. The integrator should confirm sensor address, baud rate, register map, data unit and scaling before connecting to the platform.
For utility-scale plants, 4G, Ethernet or fiber-backed gateways may be used to upload data. For distributed PV, a smaller logger can be enough if it stores historical data and provides stable communication. The important point is that irradiance and module temperature data must share the same timestamp logic as inverter production data.
| Parameter | Typical Project Value | Engineering Use |
|---|---|---|
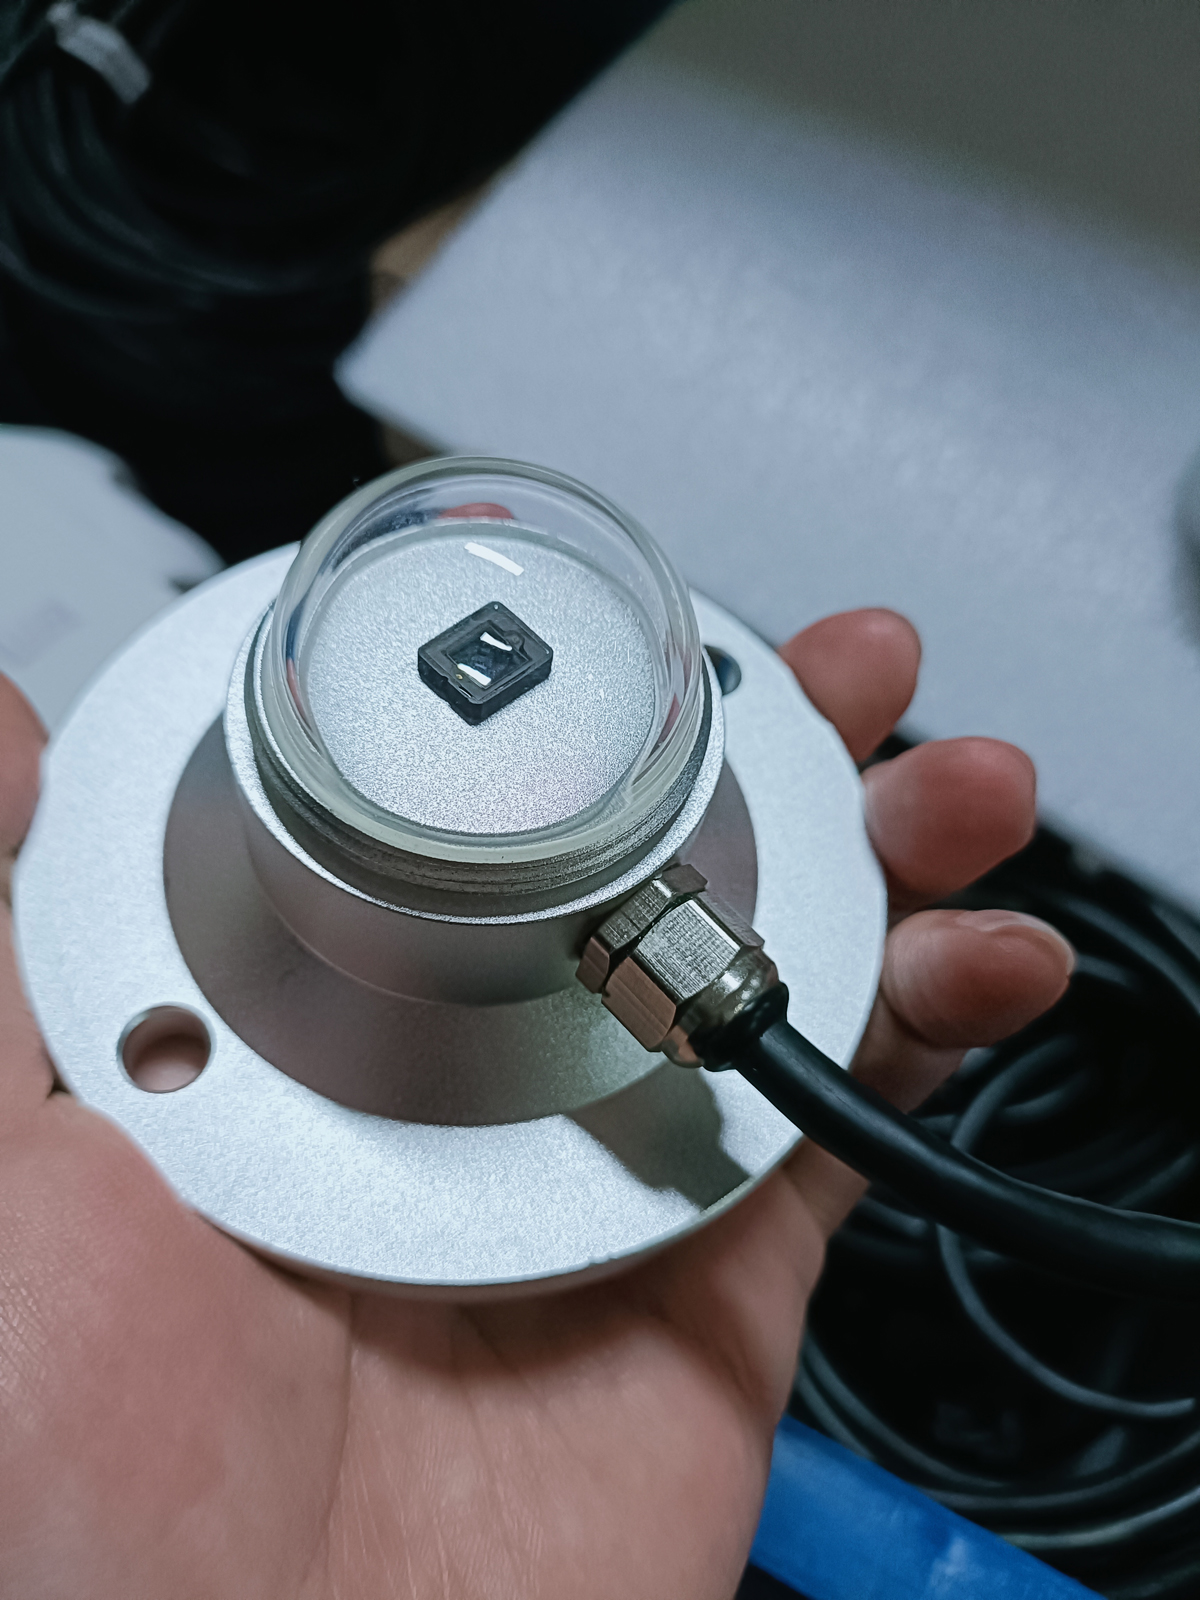
| Global solar radiation | 0-1500 W/m2 or 0-2000 W/m2 by pyranometer model | Performance ratio and irradiance trend analysis |
| Tilted plane irradiance | Same class selected according to PV module inclination | Array-plane comparison for actual module exposure |
| Direct / diffuse radiation | Optional sensors for detailed solar resource analysis | Used in advanced evaluation or research projects |
| PV module temperature | -40 to 85℃ typical sensor range | Explains thermal loss and module operating condition |
| Ambient temperature / humidity | -40 to 80℃; 0-100%RH | Environmental correction and site condition records |
| Wind speed / direction | 0-60 m/s; 0-360° | Cooling, safety and weather context |
| Supply voltage | DC 12-24V, solar or cabinet power by site | Matches PV plant field cabinet design |
| Output signal | RS485 / Modbus RTU, analog optional on selected sensors | Integration with logger, gateway or SCADA |
| Protection level | Outdoor enclosure IP65 or higher; sensor protection by model | Outdoor PV plant reliability |
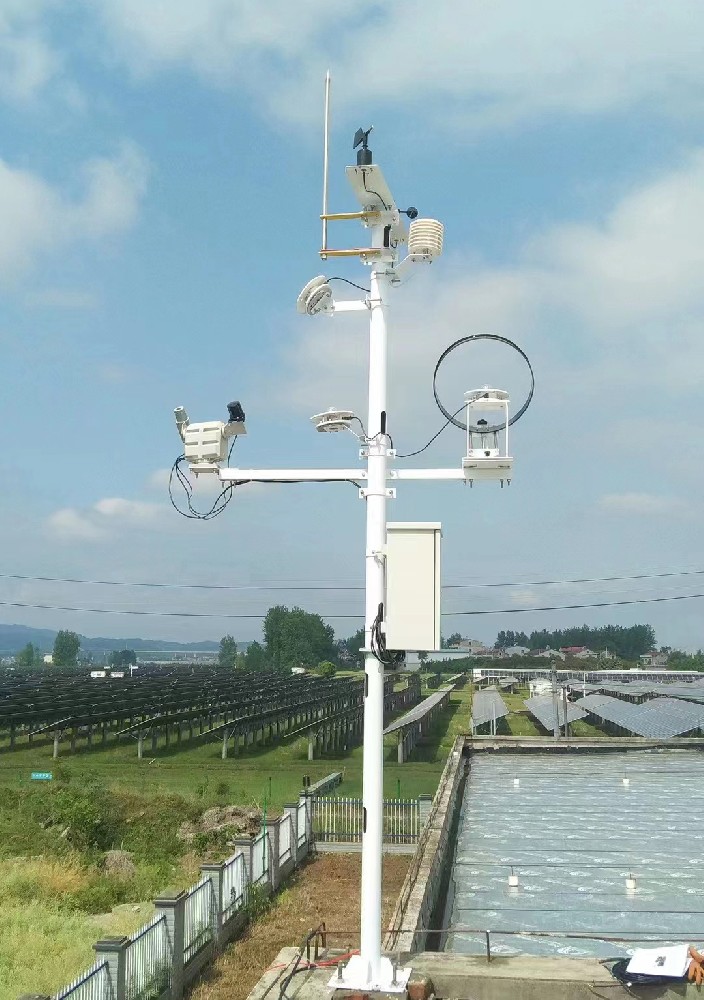
Site challenge: Large sites need performance reference data for many inverter blocks and different terrain conditions.
System integration scheme: Install PV weather stations near representative arrays and connect RS485 sensors to a plant monitoring platform.
User value: O&M teams can compare power output with irradiance and module temperature instead of judging by generation alone.
Site challenge: Roof structures create shading, wind turbulence and maintenance access restrictions.
System integration scheme: Use compact irradiance, module temperature and ambient weather monitoring with careful mounting.
User value: Owners can identify whether low output comes from weather, shading, dirt or equipment faults.
Site challenge: Project handover requires traceable evidence that monitoring data is stable and correctly integrated.
System integration scheme: Check sensor orientation, platform units, timestamp matching and data export during commissioning.
User value: EPC and owner teams reduce disputes during performance acceptance.
Site challenge: Research projects need direct, diffuse, tilted and global radiation values for comparison.
System integration scheme: Use multiple radiation sensors and clear metadata for angle, height and cleaning schedule.
User value: Researchers obtain reusable datasets instead of isolated readings.
Buyers should separate basic PV weather monitoring from advanced solar resource monitoring. A basic plant may need global irradiance, module temperature, ambient temperature and wind. A resource assessment project may require direct radiation, diffuse radiation, tilted irradiance, UV and soiling measurement. Adding every sensor without an analysis purpose only increases maintenance cost.
Acceptance should include a data reasonableness check. Irradiance should rise and fall with solar position, module temperature should respond to irradiance and wind, and rainfall or cleaning events should be visible in the operation log. If a value is technically displayed but physically unreasonable, the installation should be reviewed.
A PV weather station should not be configured only from a generic meteorological list. A power plant needs data that can explain generation deviation. Global irradiance, tilted irradiance and module temperature are directly tied to power output. Wind speed, ambient temperature and humidity provide environmental context. Rainfall and soiling information help O&M teams judge whether cleaning is necessary.
Direct radiation, diffuse radiation, UV radiation and net radiation should be added only when the project needs resource assessment or research-grade analysis. For many EPC acceptance projects, too many unused channels create more cleaning and calibration work without improving the operational decision.
After commissioning, the station should become part of the O&M workflow. Engineers compare irradiance with inverter output to identify abnormal losses. They compare module temperature with expected thermal behavior to explain lower efficiency during hot periods. They compare rainfall and soiling records with cleaning logs to decide whether a cleaning event is justified.
The station should therefore be included in the daily or weekly plant report. If the weather station is treated only as an accessory, its data will not influence decisions. A better approach is to define several standard checks: irradiance availability, module temperature reasonableness, communication uptime and whether radiation sensors require cleaning.
For a PV project inquiry, the buyer should provide plant capacity, array layout, module tilt, number of inverter blocks, monitoring platform type, whether horizontal or tilted irradiance is required, and whether the project needs direct or diffuse radiation. If the site has different terrain or array orientations, this should be stated early because it may affect station quantity.
A: Solar irradiance is the core reference, but module temperature is also essential because PV output changes with module operating temperature.
A: PV weather data is used for performance analysis. If the sensor is shaded or placed in a non-representative area, the plant may make wrong O&M decisions.
A: It depends on the purpose. Horizontal global radiation is common for weather reference, while tilted plane irradiance is useful when comparing actual module exposure.
A: Yes. RS485 Modbus is commonly used to connect radiation, temperature, wind and other sensors to data loggers or plant monitoring systems.
A: Check accessories, bracket, sensor orientation, cable route, power supply, grounding, platform fields and the maintenance access path.
A: It depends on plant size, terrain, array orientation and performance analysis requirement. Large or uneven sites may need more than one station.
A: Rainfall helps explain natural module cleaning, soiling changes and weather-related generation changes. When rainfall is compared with irradiance and soiling records, the O&M team can decide whether manual cleaning is still necessary.
A: Request sensor datasheets, Modbus register tables, wiring drawings, installation notes, calibration guidance and commissioning records. These documents reduce integration time and make later troubleshooting easier.
A: NiuBoL provides PV meteorological monitoring components and weather station solutions for solar power plant monitoring and O&M integration.
A: A useful inquiry should include plant capacity, array layout, module tilt, required irradiance type, communication method and monitoring platform requirement. This allows the supplier to recommend sensors and station quantity instead of quoting a generic weather station.

An online PV weather monitoring system is only useful when the installation is representative, stable and maintainable. For buyers, the core decision is to define which PV performance questions the system must answer, then select sensors, mounting method and communication interface accordingly. NiuBoL PV weather monitoring solutions can support solar plants that need reliable irradiance, module temperature and site weather data.
Prev:Water-Fertilizer Integrated Smart Irrigation Control System Components and Procurement Guide
Next:Smart Agricultural Irrigation System Guide for Sensor-Based Water and Fertilizer Control
Related recommendations
Sensors & Weather Stations Catalog
 Agriculture Sensors and Weather Stations Catalog-NiuBoL.pdf
Weather Stations Catalog-NiuBoL.pdf
Agriculture Sensors Catalog-NiuBoL.pdf
Water Quality Sensor Catalog-NiuBoL.pdf
Related products
 Combined air temperature and relative humidity sensor
 Soil Moisture Temperature sensor for irrigation|NBL-S-THR
 Soil pH sensor RS485 soil Testing instrument soil ph meter for agriculture |NBL-S-PH
 Wind Speed sensor Output Modbus/RS485/Analog/0-5V/4-20mA
 Tipping bucket rain gauge for weather monitoring auto rainfall sensor RS485/Outdoor/stainless steel
 Pyranometer Solar Radiation Sensor 4-20mA/RS485

Screenshot, WhatsApp to identify the QR code
WhatsApp number:+8615367865107
(Click on WhatsApp to copy and add friends)
