


— Blogs —
—Products—
 Consumer hotline +8618073152920
 WhatsApp:+8615367865107
Address:Room 102, District D, Houhu Industrial Park, Yuelu District, Changsha City, Hunan Province, China
Product knowledge
Time:2026-03-04 10:09:14 Popularity:391
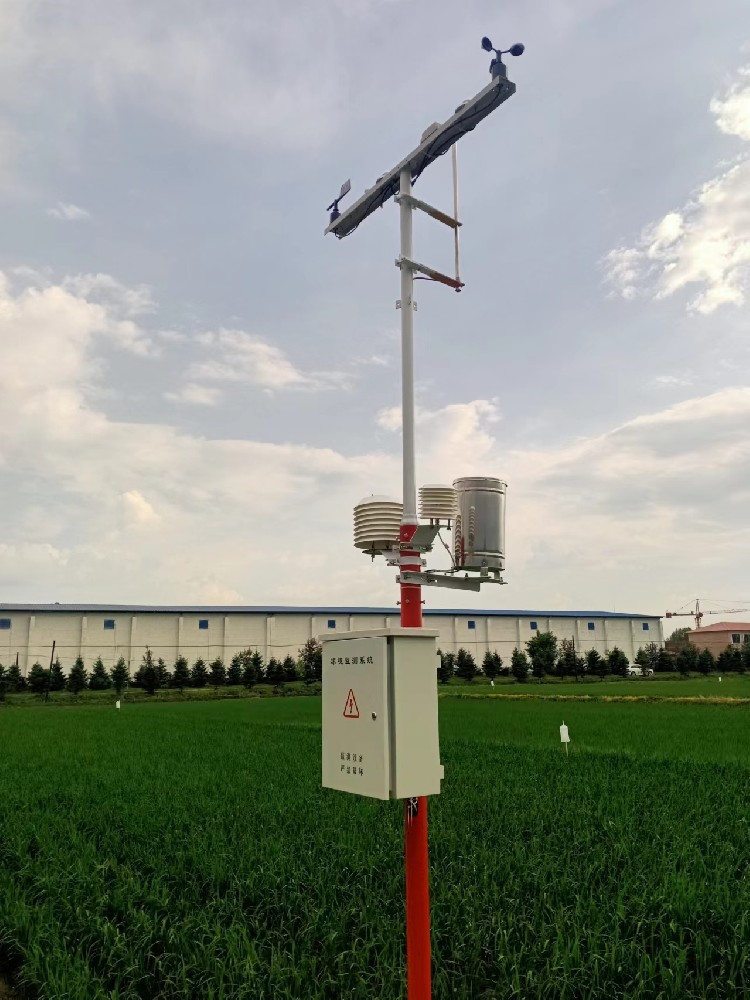
In the evolution blueprint of precision agriculture and smart agriculture, the granularity of data-driven decision-making directly determines the upper limit of production efficiency. Traditional dispersed and independent meteorological and soil monitoring equipment can no longer meet the modern agricultural demand for multi-dimensional, highly correlated, and high spatiotemporal resolution environmental data. Crop growth is not influenced by a single factor but by the complex interaction of meteorological, soil, and biological factors across time and space dimensions. Therefore, observation of the agricultural production environment must upgrade from “single-element recording” to “multi-element collaborative perception and systematic analysis”.
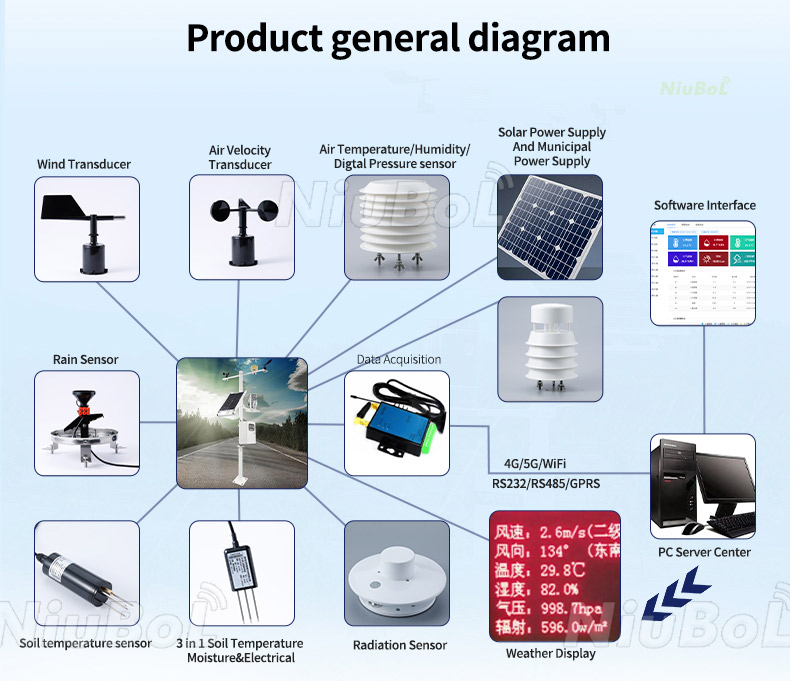
The agricultural environmental comprehensive monitoring station is precisely the physical carrier and data hub embodying this concept. It is not a simple stacking of multiple sensors but a professionally designed, integrated Agri-IoT edge node capable of synchronous collection of intrinsically correlated data, standardized processing, and efficient integration. For partners undertaking integration tasks in large farms, agricultural science and technology parks, and high-standard farmland construction projects, deploying such comprehensive monitoring stations means building not just a set of monitoring equipment for clients, but a stable, reliable, and scalable farmland environmental data foundation. The structured, multi-dimensional data streams generated by this foundation serve as the “blood” and “fuel” enabling effective operation of all upper-layer intelligent applications (water-fertilizer integration, pest and disease models, yield prediction).
NiuBoL deeply understands this. The comprehensive monitoring station solutions we provide aim to empower system integrators to build the core data infrastructure supporting the digital transformation of modern agriculture in a more efficient and reliable manner.

Traditional agricultural meteorological stations mainly focus on atmospheric boundary layer meteorological elements. Modern agricultural environmental comprehensive monitoring stations have systematically expanded monitoring dimensions into three major matrices:
Atmospheric Environment Matrix: Air temperature, air humidity, wind speed, wind direction, rainfall, atmospheric pressure, total solar radiation, photosynthetically active radiation (PAR), UV index, carbon dioxide concentration, ammonia, hydrogen sulfide (livestock and poultry house environment), etc.
Soil Environment Matrix: Soil volumetric water content, soil temperature, soil electrical conductivity (EC), soil pH, soil salinity, soil available nitrogen, phosphorus, potassium content. Monitoring typically requires layering (e.g., 10cm, 20cm, 40cm).
Crop Body and Environment-Derived Matrix: Leaf wetness, fruit expansion diameter stem, canopy spectral index (requires specific sensors), evaporation, soil water potential (calculable), etc.
For integrators and end users (farms, research institutions), its value is reflected in:
Reducing Integration Complexity and Total Cost of Ownership (TCO): Provides a complete kit from sensors, collectors, power supply, communication to installation structure in one stop, reducing compatibility testing, interface development, and coordination costs from multi-vendor procurement. Unified after-sales service interface also reduces long-term operation and maintenance difficulty.
Ensuring Data Quality and Correlation: Integrated design ensures clock synchronization among sensors and installation positions comply with agronomic observation specifications (e.g., relative positions of wind speed and temperature-humidity sensors), making physical correlations between data authentic and credible, directly usable for scientific calculations (e.g., reference crop evapotranspiration ET0 based on radiation, temperature, humidity, wind).
Providing Edge Computing Capabilities to Optimize Data Flow: High-performance data collector (RTU) can perform real-time calculation of key derived parameters (e.g., ET0, dew point temperature, soil water potential) at the edge, along with preliminary data cleaning and quality control, uploading only high-value result data to the cloud, significantly saving communication traffic and cloud computing power.
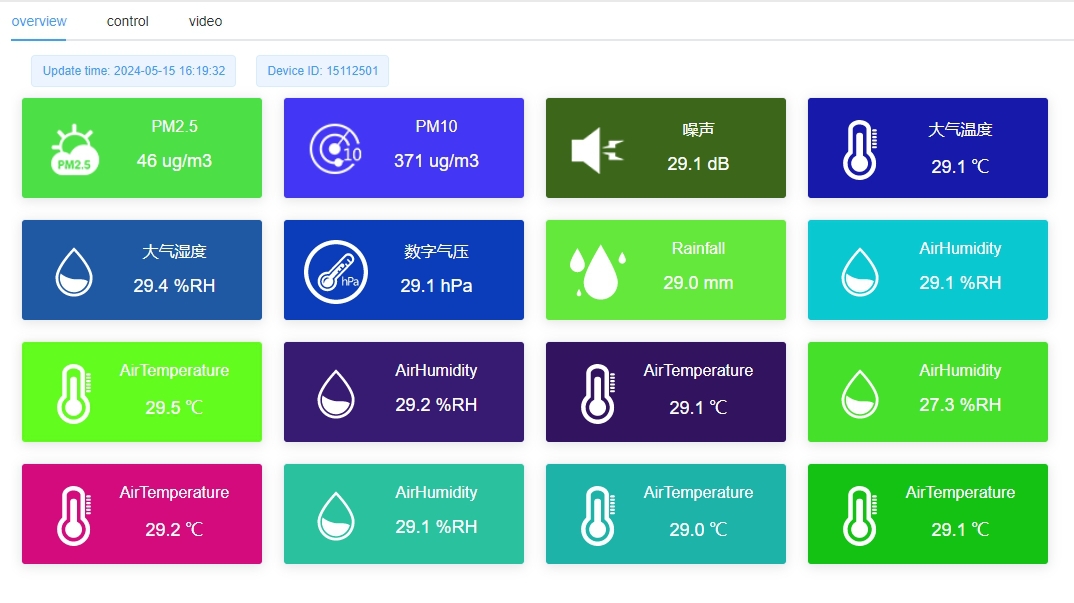
Building Standardized Data Entry: As a standardized data source, its output structured data streams (e.g., JSON format) can seamlessly dock to any compliant agricultural IoT platform, farm management software (FMS), or digital twin system via standard protocols (MQTT, Modbus TCP), accelerating upper-layer application development.
This is the most direct manifestation of the comprehensive monitoring station data value. System-integrated data flow is as follows:
Data Collection: Monitoring station synchronously acquires air temperature-humidity, wind speed, radiation, rainfall, soil multi-layer temperature-humidity, and EC values.
Edge/Cloud Computing:
• Calculate daily reference crop evapotranspiration (ET0) using Penman-Monteith formula.
• Determine irrigation timing and amount based on measured soil moisture in relation to field capacity and wilting point.
• Assess salt stress risk based on soil EC values and adjust irrigation strategy (leaching).
System Linkage: Decision engine-generated irrigation/fertilization prescription maps are issued to field head control systems via control interfaces (e.g., OPC UA, Modbus TCP) to precisely control pumps, filters, fertilizer applicators, and field solenoid valves for synchronized water-fertilizer application and fertilizer solution concentration.
Project Key Points: Requires high sensor accuracy and stability in monitoring station soil sensors, and low data transmission latency. Usually adopts “comprehensive monitoring station (providing meteorological and benchmark soil data) + distributed soil moisture monitoring points” grid deployment mode to achieve finer variable irrigation.
In highly controllable facility environments, the comprehensive monitoring station serves as the “perception brain” of the environmental control system.
Comprehensive Perception: In addition to conventional parameters, focus on monitoring CO2 concentration, PAR values, substrate temperature-humidity/EC/pH (soilless cultivation).
Closed-Loop Control: Data real-time access to greenhouse environmental computer or custom control system based on PLC/industrial computer. System dynamically regulates top vents, side vents, shading nets, wet curtain-fans, supplementary lights, CO2 generators, fertilizer-water irrigation systems, etc., according to set crop growth model curves to create optimal growth environment.
Project Key Points: Extremely high requirements for sensor response speed and reliability. Communication typically uses low-latency wired RS-485 bus or industrial Ethernet. Monitoring station requires good resistance to high humidity and anti-condensation performance.

A professional comprehensive monitoring station should be modularly configured like configuring a server, based on application load (monitoring requirements).
| Monitoring Dimension | Monitoring Elements | Recommended Sensor Technology | Typical Application Scenarios |
|---|---|---|---|
| Atmospheric Meteorology | Wind Speed/Direction | Ultrasonic wind speed and direction instrument | General, especially suitable for evaporation calculation, wind damage warning |
| Atmospheric Meteorology | Air Temperature/Humidity | Capacitive digital probe | General, core input for disease models |
| Atmospheric Meteorology | Solar Radiation | Thermopile total radiometer | Evaporation calculation, photosynthesis assessment, greenhouse control |
| Atmospheric Meteorology | Rainfall | Tipping bucket rain gauge | Irrigation decision correction, waterlogging warning |
| Soil Environment | Soil Temperature and Humidity | FDR (Frequency Domain Reflectometry) sensor | Precision irrigation, ground temperature monitoring |
| Soil Environment | Soil Electrical Conductivity (EC) | Four-electrode EC sensor | Salinization monitoring, precision fertilization |
| Soil Environment | Soil pH | Glass electrode or solid-state electrode | Acidic soil improvement, nutrient management |
| Special Gases | Carbon Dioxide (CO2) | Non-dispersive infrared (NDIR) | Greenhouse CO2 supplementation, photosynthesis efficiency research |
| Special Gases | Ammonia (NH3)/Hydrogen Sulfide (H2S) | Electrochemical or semiconductor | Livestock and poultry breeding environment monitoring, manure treatment areas |
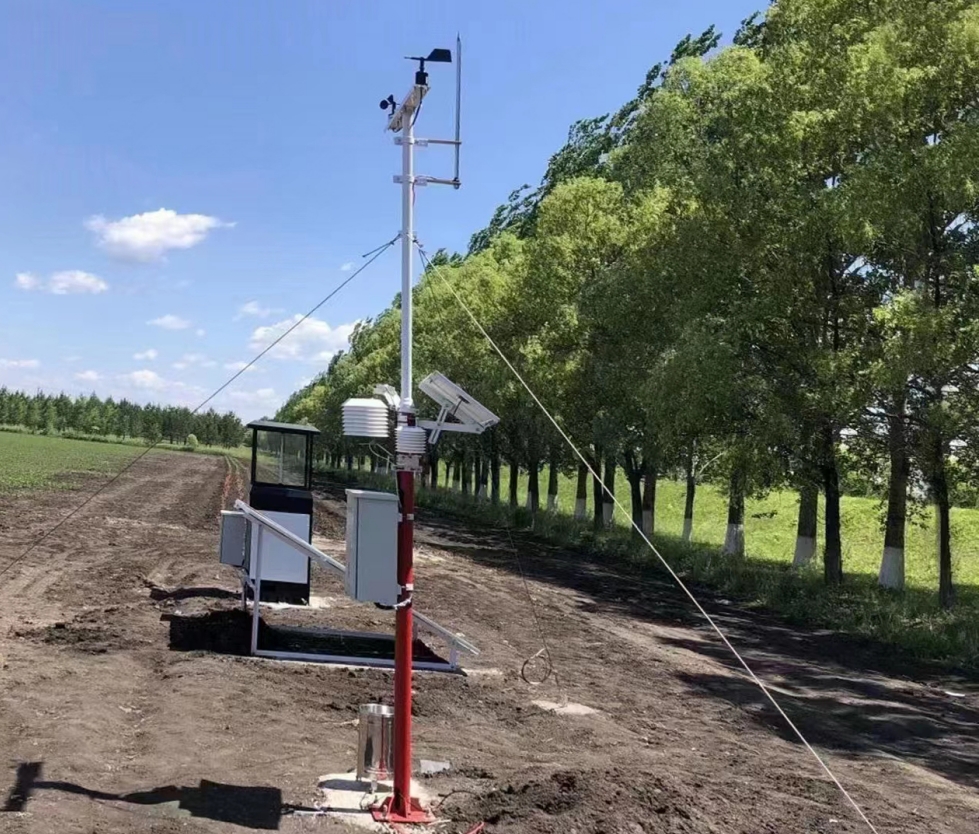
Optimal Configuration: Adopt “mains primary supply + solar panels + intelligent controller + deep-cycle batteries” hybrid power solution. Mains ensure continuous stable power, solar panels charge batteries during the day and seamlessly switch during mains interruption, ensuring system continuous operation during consecutive cloudy/rainy days (typically 7-15 days).
Field Layer: RS-485 bus between sensors and collector, simple wiring, strong anti-interference.
Transmission Layer: Collector to cloud, flexible selection based on site network conditions:
• Ethernet/fiber: Preferred for areas with wired network coverage in parks, stable and high-speed.
• 4G/5G: General solution for areas without wired networks, consider SIM card traffic packages.
• LoRa self-networking: Suitable for scenarios with dispersed sensors, small data volume, and low power requirements, aggregating multiple slave node data to one 4G gateway.
Protocol Layer: Must support MQTT over TLS/SSL (de facto IoT standard) and Modbus TCP (industrial control standard), and support common data formats such as JSON and CSV, ensuring seamless docking with most agricultural cloud platforms (e.g., Azure FarmBeats, Google Cloud Platform for Ag) or privatized deployed FMS.
Q1. We need to access NiuBoL comprehensive monitoring station data simultaneously to the client's self-developed cloud platform and a third-party precision irrigation control system. How to achieve this?
A1: Our data collector supports multi-center reporting. You can configure it to push data simultaneously to two or more different server addresses (IP/domain). For example, one path reports raw and edge-computed data to the self-developed platform via MQTT protocol; another path reports key real-time trigger data (e.g., soil moisture threshold alarms) to the irrigation control system via Modbus TCP or specific API interface. We provide technical guidance to help complete routing configuration.
Q2. Is one comprehensive monitoring station sufficient for large farms of tens of thousands of acres? How to plan point density?
A2: One comprehensive monitoring station typically serves as a benchmark station monitoring representative area's atmospheric environment and core soil profiles. For ten-thousand-acre farms, must adopt “1+N” grid monitoring network. “1” is the benchmark station; “N” are multiple low-cost, lightweight soil moisture monitoring nodes (mainly measuring soil moisture and temperature), converging data via LoRa wireless. Point density depends on field uniformity, typically one soil node per 500-1000 acres. Benchmark station location should represent most of the farm's microclimate.
Q3. With numerous sensors, is the later calibration and maintenance workload large? How to ensure long-term data accuracy?
A3: We reduce maintenance burden through product design and service system: 1) Product side: Select high-stability, low-drift sensors; key sensors (e.g., radiation, EC) adopt modular design for quick plug-and-play inspection. 2) Service side: Provide annual calibration services and remote diagnostics. In practice, most users only need quarterly visual inspection + annual professional calibration for critical sensors, with workload controllable.
Q4. As a solution provider, we want to develop exclusive branded solutions based on your hardware. Do you support OEM/ODM?
A4: Full support. We provide deep OEM/ODM cooperation: 1) Hardware level: Support shell silk-screening of your Logo, customized interface combinations and appearance, even motherboard customization. 2) Service level: Can perform factory pre-configuration and testing according to your requirements. Specific cooperation modes and minimum order quantity (MOQ) can be determined through business negotiations.
Q5. How to ensure equipment safety in lightning-prone areas?
A5: We provide a three-level lightning protection engineered solution: 1) Direct lightning protection: Recommend installing lightning short needles at the top of monitoring station poles or ensuring the station is within independent lightning rod protection range. 2) Power lightning protection: Install first-level power surge protector (box) at power line entry, and second-level power surge module inside equipment chassis.
Q6. How to control 4G traffic costs with high data upload frequency (e.g., every minute)?
A6: We have multiple data optimization strategies: 1) Edge computing and data compression: Perform averaging, extremes calculation at collector, upload only periodic results (e.g., 5-minute averages) instead of raw second-level data. 2) Change reporting: Set thresholds, upload only when data change exceeds set range. 3) Protocol optimization: Use efficient binary protocols or compressed JSON to reduce packet size. 4) Local storage and breakpoint continuation: Built-in large-capacity storage, cache locally during network interruption, resume transmission after recovery, avoiding data loss.

The agricultural environmental comprehensive monitoring station is a key physical node and data hub connecting upper and lower layers in modern smart agriculture systems. Its value lies in integrating fragmented environmental information into high-dimensional data assets with unified spatiotemporal benchmarks and intrinsic physical correlations, thereby providing reliable and efficient quantitative basis for precision agronomic decision-making.
For system integrators and engineering companies committed to providing top-tier solutions in the smart agriculture field, choosing NiuBoL's comprehensive monitoring station means selecting a strategic hardware partner verified in performance reliability, interface openness, and service professionalism. We not only provide hardware products that withstand harsh field environments but also offer full-process support from solution design, network planning, lightning grounding guidance to long-term calibration and maintenance, ensuring every project you deliver becomes a stable, continuously value-generating agricultural data foundation.
Next:Industrial-Grade Agricultural Environmental Meteorological Monitoring System Integration Solution
Related recommendations
Sensors & Weather Stations Catalog
 Agriculture Sensors and Weather Stations Catalog-NiuBoL.pdf
Weather Stations Catalog-NiuBoL.pdf
Agriculture Sensors Catalog-NiuBoL.pdf
Water Quality Sensor Catalog-NiuBoL.pdf
Related products
 Combined air temperature and relative humidity sensor
 Soil Moisture Temperature sensor for irrigation|NBL-S-THR
 Soil pH sensor RS485 soil Testing instrument soil ph meter for agriculture |NBL-S-PH
 Wind Speed sensor Output Modbus/RS485/Analog/0-5V/4-20mA
 Tipping bucket rain gauge for weather monitoring auto rainfall sensor RS485/Outdoor/stainless steel
 Pyranometer Solar Radiation Sensor 4-20mA/RS485

Screenshot, WhatsApp to identify the QR code
WhatsApp number:+8615367865107
(Click on WhatsApp to copy and add friends)
