

— Blogs —
—Products—
 Consumer hotline +8618073152920
WhatsApp:+8615367865107
Address:Room 102, District D, Houhu Industrial Park, Yuelu District, Changsha City, Hunan Province, China
Product knowledge
Time:2026-06-06 09:36:35 Popularity:478
Quick Answer: A dissolved oxygen sensor for aquaculture should show whether oxygen remains adequate and recovers under the farm's actual feeding and aeration conditions. Record feed events, DO, temperature and aerator operation together. Do not turn one favorable reading into permission for a fixed feed increase: placement, salinity settings, stock requirements and the response of the pond or tank all matter.
A useful review starts before feeding and continues through the subsequent oxygen trend. Note the feed quantity and time, water temperature, circulation condition and which aerators or oxygen systems were operating. Compare similar operating periods instead of attributing every difference to feed quantity alone.
Separate three observations: the oxygen condition before the event, the direction and duration of the subsequent change, and the recovery under the available aeration. A short dip with prompt recovery and a sustained downward trend require different investigations. Neither observation by itself establishes the correct ration for a species or stocking level.
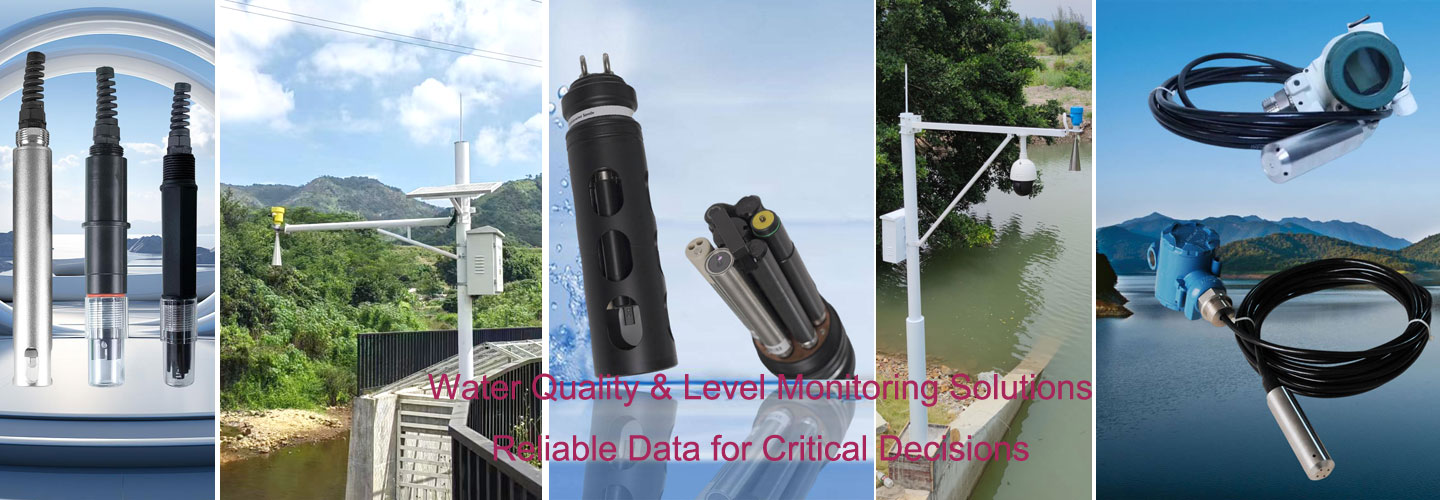
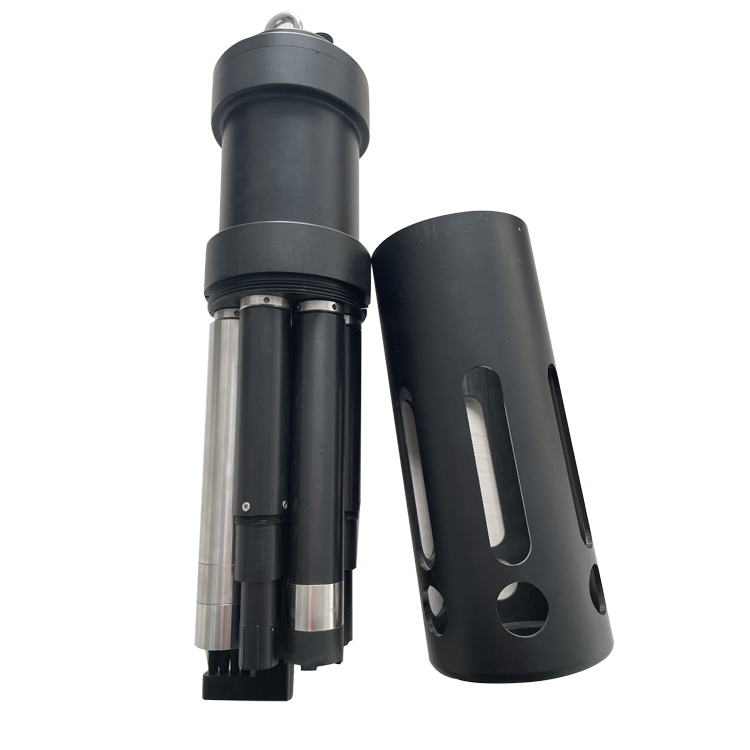
A multi-channel assembly, illustrated above, can help keep related observations on a common timeline. Verify that its installed DO element and location represent the stock's exposure. A station collecting many channels still measures at particular points; it is not a survey of the whole farm.
| Observation | Question to resolve |
|---|---|
| DO falls with a recorded feed event | Was temperature, biomass, circulation or aeration different from the comparison period? |
| DO improves after an aerator command | Did running feedback confirm operation, and did a representative point recover rather than only water in the bubble plume? |
| DO remains low despite equipment running | Check the measurement, distribution of aeration and current loading; a motor-running signal is not proof of adequate oxygen transfer. |
| The decline begins before feeding | Review the preceding overnight or process trend rather than assigning the entire event to the latest feed. |
| Only one channel shows an abrupt step | Check cleaning, probe movement, compensation changes and data freshness before changing farm operation. |
An ammonia-related measurement can add context when feed and waste loading are being reviewed. The probe below is a separate nitrogen instrument. Define its reported quantity and retain pH and temperature context; a DO trend cannot establish ammonia concentration, and an ammonium reading is not automatically un-ionized ammonia.
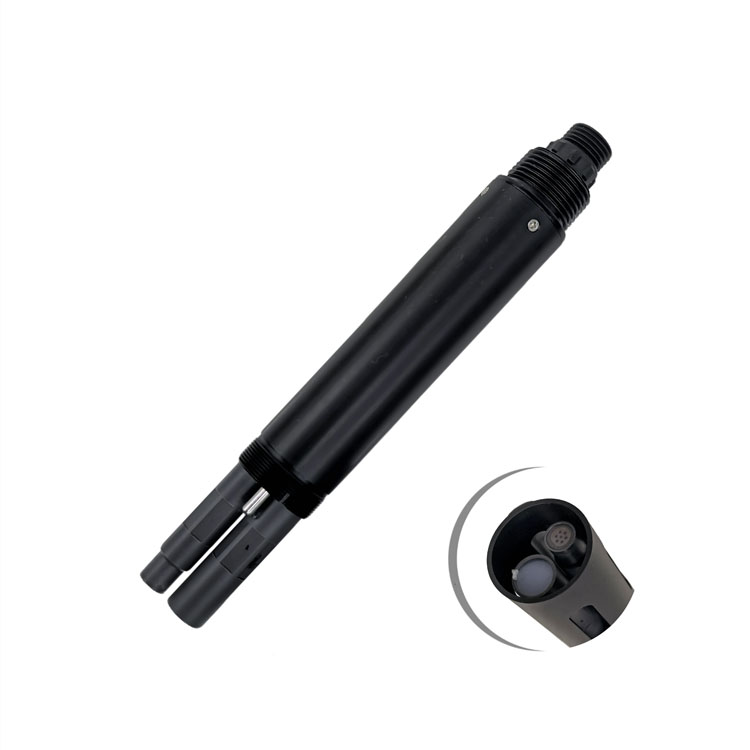
The NiuBoL NBL-WQ-DO-4A uses fluorescence measurement with a configurable salinity correction. It is one possible oxygen channel for this work; the receiving logger or PLC must preserve the configured units and settings.
| Parameter | NBL-WQ-DO-4A |
|---|---|
| Range / resolution | 0-20.00 mg/L and 0-200% saturation; 0.01 mg/L and 0.1 degrees C |
| Accuracy | +/-2% of reading; temperature +/-0.3 degrees C |
| Response | T90 below 30 s; the installed response also depends on the sampled water |
| Compensation | Pt1000 temperature compensation; configured salinity value |
| Operating conditions | 0-50 degrees C; pressure at or below 0.2 MPa |
| Output | RS485 Modbus RTU; optional 4-20 mA |
| Supply / consumption | 12-24 V DC; 0.2 W at 12 V |
| Housing / protection | POM and ABS/PC alloy; IP68 |
| Installation details | Confirm mounting, cable length and jacket compatibility for the ordered assembly and pond conditions. |
Do not mix mg/L and percent saturation in the feeding or aeration record. They answer different questions and their relationship depends on water conditions. Likewise, the basic DO model's +/-2% F.S. expression is not the DO-4A's +/-2% of reading. Identify the model before deciding whether an observed change is meaningful.
Use a recording interval that captures the event without confusing more frequent polling with a faster sensor or faster pond response. Keep actual sample times and flag gaps. A trend assembled from delayed uploads can conceal when an intervention occurred unless the logger preserves acquisition time.
If the farm compares the rate of decline, calculate it over a defined interval and review the underlying readings. Small differences comparable with measurement uncertainty or short-lived bubble disturbances should not drive repeated feed changes. Extrapolating a short straight line also does not predict the next hours of a biologically changing pond.
The turbidity instrument below can help investigate particle changes but cannot replace DO. Where cloudy water is the main concern, use the separate paired pond DO and turbidity investigation rather than treating NTU as an oxygen-demand calculation.
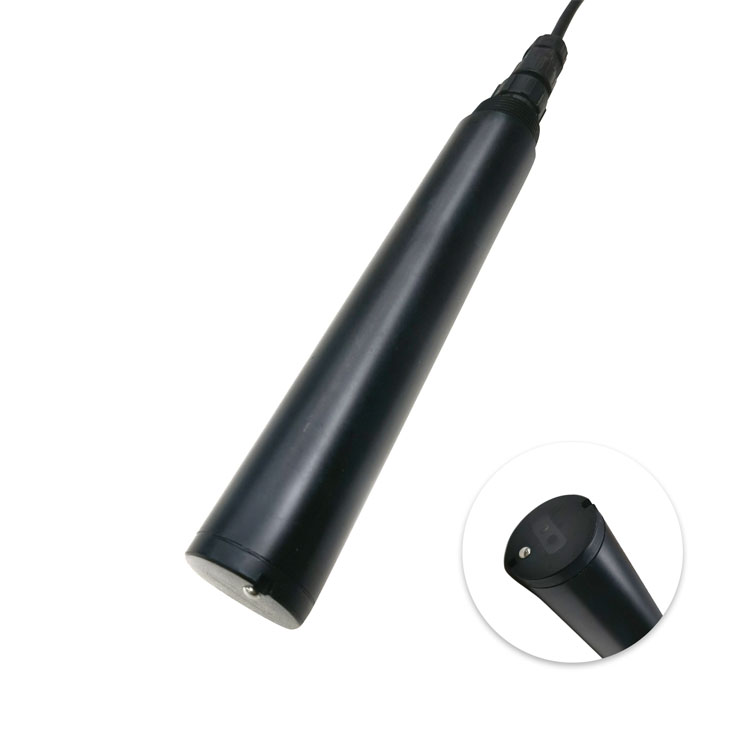
A probe immediately beside an aerator can show local recovery while another area remains poorly mixed. Compare relevant positions and depths under normal operating conditions before accepting the permanent location. Keep the sensing region submerged and clear of direct bubbles, deposits and physical contact with equipment.
For recirculating systems, distinguish the culture tank, oxygenated inlet, outlet and treatment return. A high inlet DO value does not prove that the tank outlet has sufficient oxygen. Map each channel to its actual point before combining the values in a farm dashboard or evaluating recovery.
For routine sensor care, inspect the optical cap and verify the measurement after cleaning, damage or replacement. Optical measurement avoids electrochemical oxygen consumption, but deposits can still make a plausible-looking reading unreliable. Do not convert a recommended consumable interval into a promise of unattended operation.
Have the responsible farm team establish species- and operation-specific action limits, feed restrictions and escalation. A logger may record and a gateway may notify; neither necessarily contains an approved local aeration-control function. Identify who or what acts when the trend deteriorates.
Test loss of the DO signal and communications independently from a low-oxygen event. Keep stale or maintenance data from creating false permission to resume feeding. Automatic control, if included, needs an agreed recovery condition and equipment feedback rather than a single universal DO number.
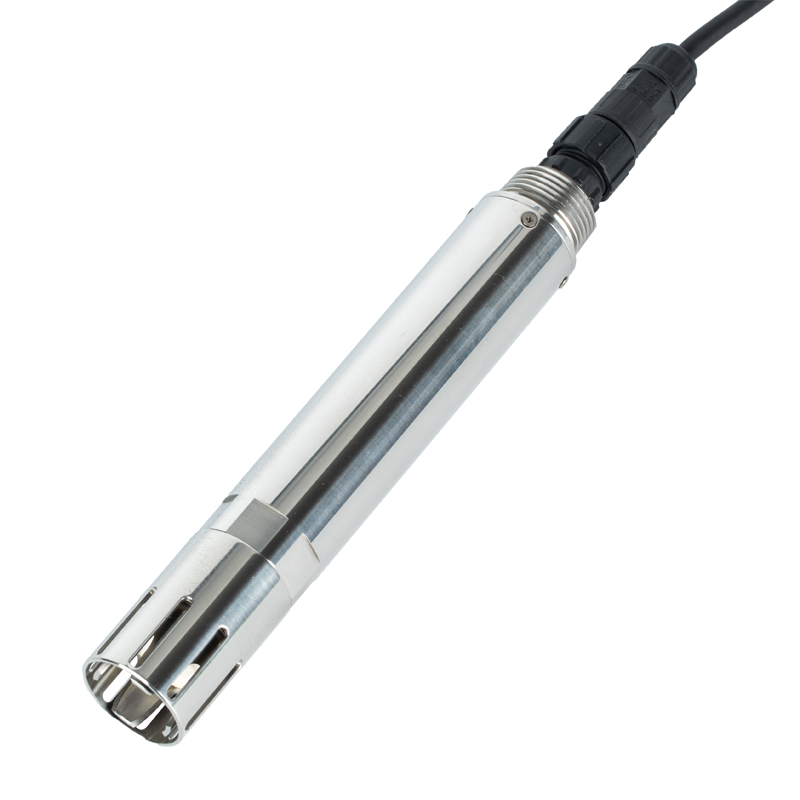
In an enquiry, provide representative feed/DO/aeration traces, pond or tank layout, stock context, salinity variation and the existing control interface. Additional electrodes, such as the assembly below, should address a stated water-quality question rather than expand the channel count without an operating purpose.
No. It supplies oxygen observations for the farm's operating decisions. Ration setting also depends on species, stock, temperature, feed and other management information.
Only for the observed conditions and locations. Check representative water and repeated operating periods; a local recovery does not establish performance at a higher load.
No. They are different quantities. Define the required unit and compensation basis in the sensor, PLC and operating procedure.
Check whether cleaning restored the actual condition or changed the position, trapped air or settings. Verify with a suitable reference before applying a calibration offset.
Demonstrate representative placement, reference agreement, correctly timed event records, usable trend recovery and the approved response to low oxygen and invalid data. Do not judge the installation from an isolated daytime screenshot.
A dissolved oxygen sensor for aquaculture adds value when the farm can relate oxygen changes to feeding, aeration and representative water conditions. Use the correct model and units, retain event timing and verify recovery at the relevant locations. Let the farm's approved management rules determine the action, not a universal feed formula.
Prev:Dissolved Oxygen in Water Quality Monitoring
Next:Domestic Water Quality Parameters After Tank Storage: What to Compare
Related recommendations
Sensors & Weather Stations Catalog
 Agriculture Sensors and Weather Stations Catalog-NiuBoL.pdf
Weather Stations Catalog-NiuBoL.pdf
Agriculture Sensors Catalog-NiuBoL.pdf
Water Quality Sensor Catalog-NiuBoL.pdf
Related products
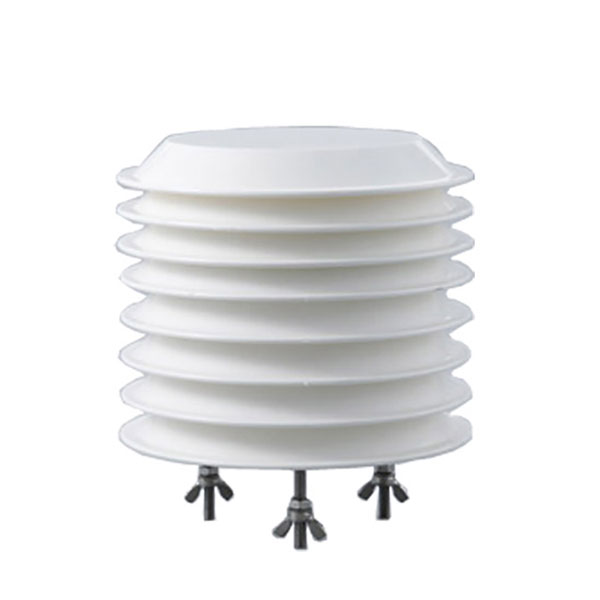 Combined air temperature and relative humidity sensor
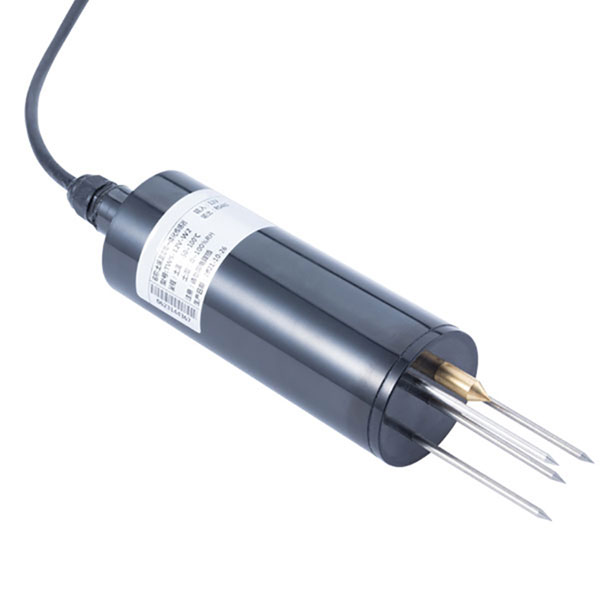 TDR Soil Moisture & Temperature Sensor for irrigation| RS485 |4-20mA| NBL-S-THR
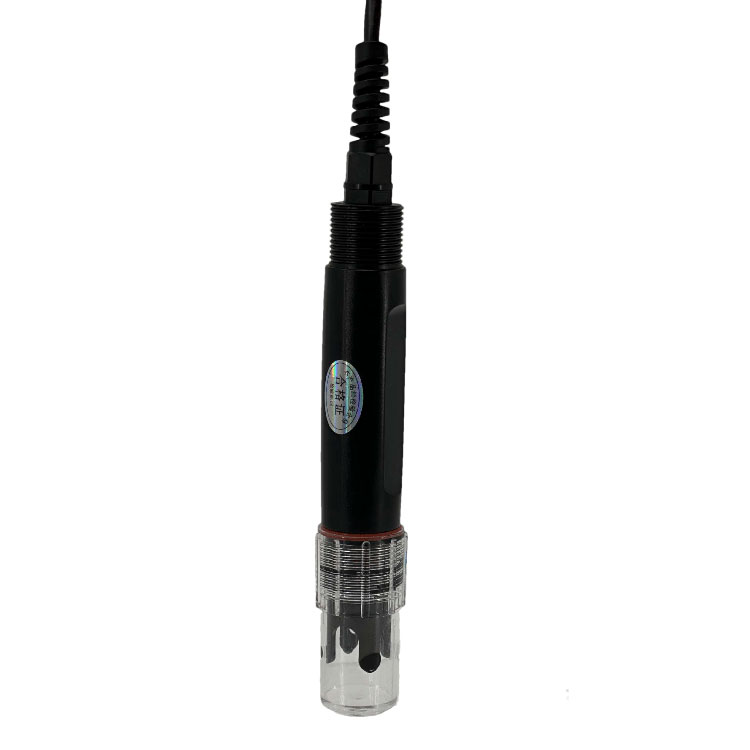 Soil pH sensor RS485 soil Testing instrument soil ph meter for agriculture |NBL-S-PH
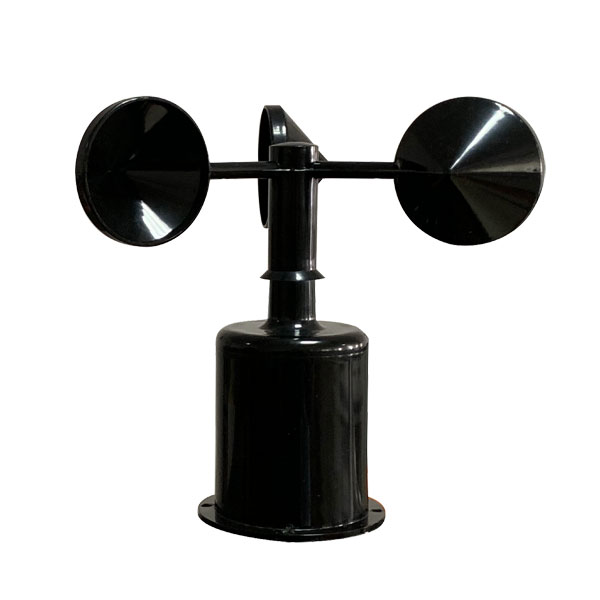 Wind Speed sensor Output Modbus/RS485/Analog/0-5V/4-20mA
 Tipping bucket rain gauge for weather monitoring auto rainfall sensor RS485/Outdoor/stainless steel
 Pyranometer Solar Radiation Sensor 4-20mA/RS485


Screenshot, WhatsApp to identify the QR code
WhatsApp number:+8615367865107
(Click on WhatsApp to copy and add friends)