





— Blogs —
—Products—
 Consumer hotline +8618073152920
WhatsApp:+8615367865107
Address:Room 102, District D, Houhu Industrial Park, Yuelu District, Changsha City, Hunan Province, China
Product knowledge
Time:2024-11-24 16:14:17 Popularity:2192
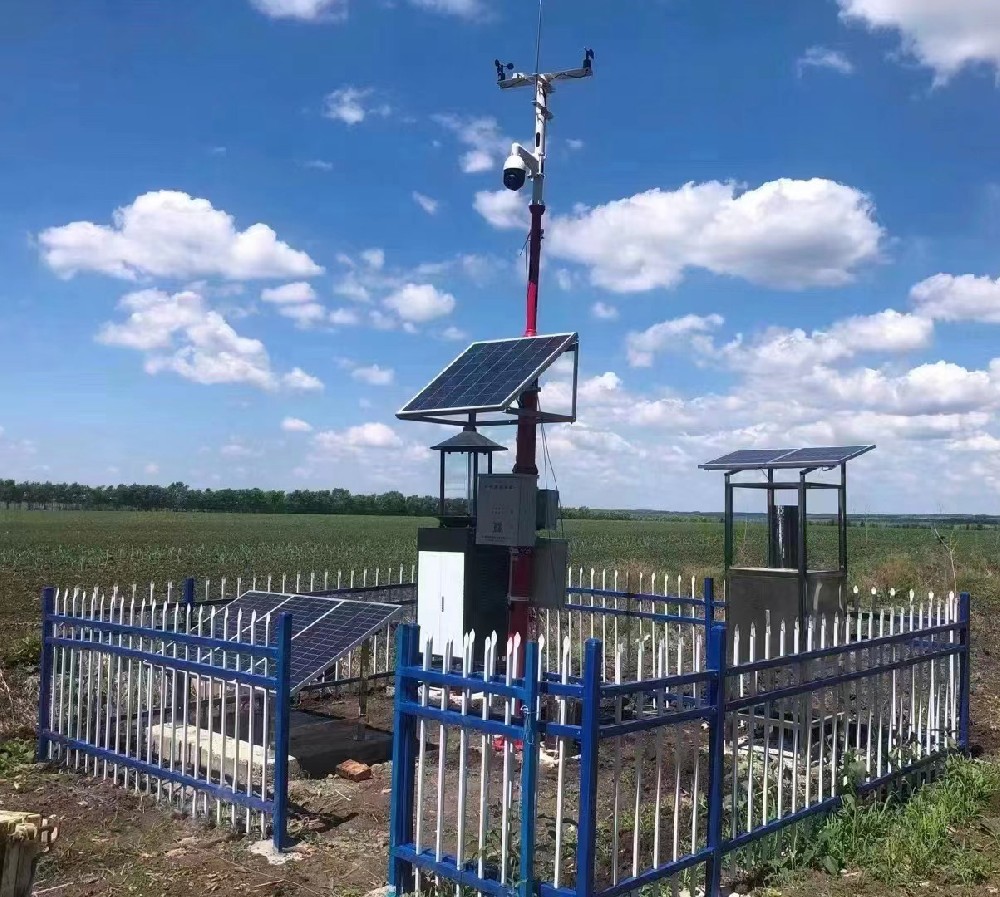
A weekly agricultural weather review should connect station observations with the crop, field and work completed during that week. Weekly averages and totals are useful summaries, but they can hide short cold periods, concentrated rain or unsuitable working conditions. NiuBoL agricultural meteorological stations can provide the underlying weather and optional soil measurements. Keep the event timing and measurement coverage available before using a weekly summary to explain crop response or plan the next operation.
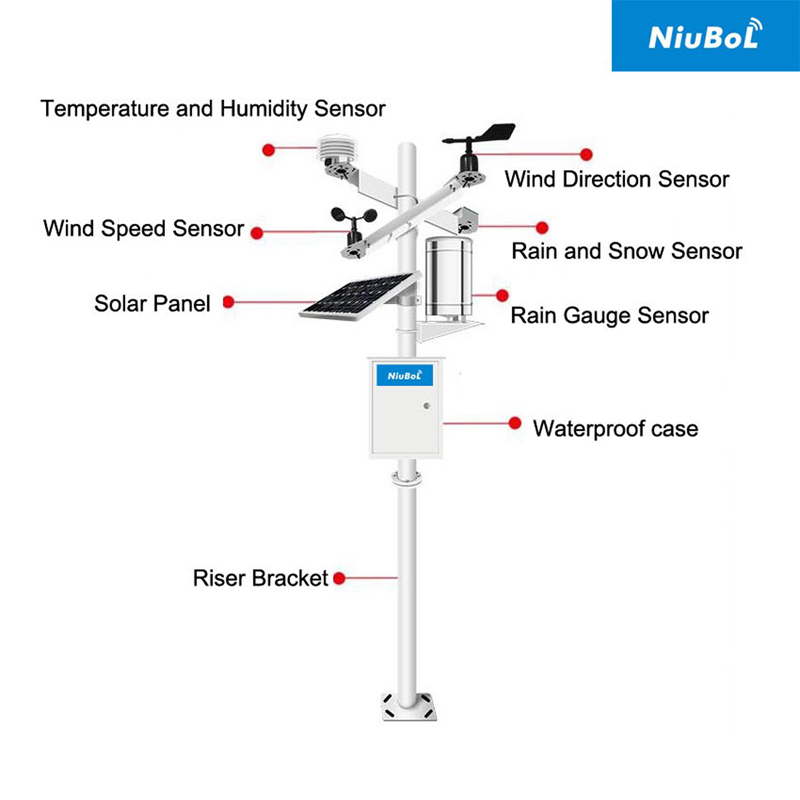
A cooperative reviewing several fields may want to know why one block emerged unevenly, whether rain reached a newly planted field, or which operations were delayed. Those are different questions. State the crop, growth stage, field and relevant dates before selecting the station fields to review. A single weekly weather score usually removes information needed to distinguish the causes.
Keep an observation separate from a conclusion. A temperature record can show when the air cooled; it does not prove frost injury without crop and site evidence. Rainfall can explain part of a water input; it does not by itself establish root-zone water availability. Agricultural meteorological stations support the investigation rather than replace field inspection.
| Summary item | What it can miss | What to review before a field decision |
|---|---|---|
| Mean air temperature | A brief low or high temperature during a sensitive crop stage | Time-stamped observations, extremes and duration relative to a crop-specific criterion |
| Total rainfall | Whether rain arrived in one event or several; timing relative to field work | Event timing, valid recording periods and local soil or surface conditions |
| Average wind speed | Short unsuitable periods and changes in direction | The relevant time window and the operating rules for the planned task |
| Mean relative humidity | Timing of humid periods and whether leaves were actually wet | Within-day records and the additional inputs required by the disease model |
| End-of-week soil moisture | Wetting and drying between visits or between irrigation events | Depth-specific time series, irrigation records and probe location |
For illustration, one 10 mm rain event and five 2 mm events both produce a 10 mm weekly total. They need not have the same consequences for infiltration, surface wetness or work scheduling. The same total can therefore require different follow-up checks: event timing for access planning, and soil response for irrigation decisions.
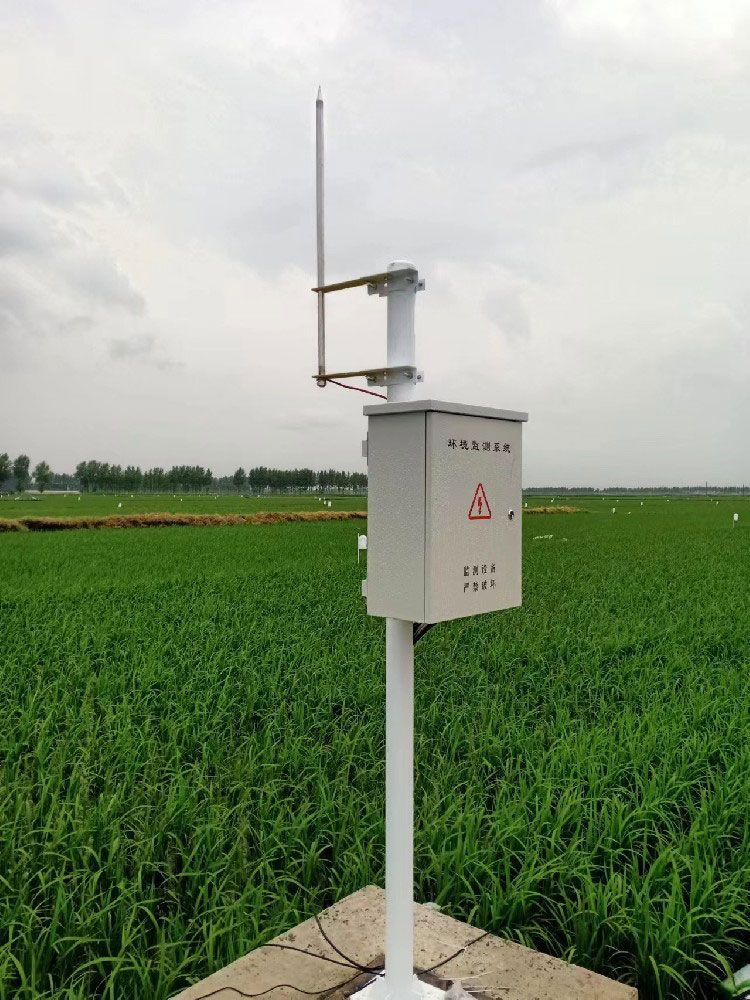
A rain gauge measures precipitation at its own collector. The field may also receive irrigation, runoff or uneven sprinkler coverage. Compare rainfall timing with soil observations at relevant depths and positions. If soil moisture changes while recorded rain is zero, investigate irrigation and the measurement paths rather than rewriting the rain record to match an expected result.
The NBL-S-THR soil moisture and temperature sensor supplies those two channels, not nutrient demand or soil EC. Its moisture range is 0-100%, with stated accuracy +/-3% and 0.1% resolution. A small displayed change should be interpreted with the instrument's uncertainty, installation contact and local soil conditions, not treated automatically as a significant change in available water.
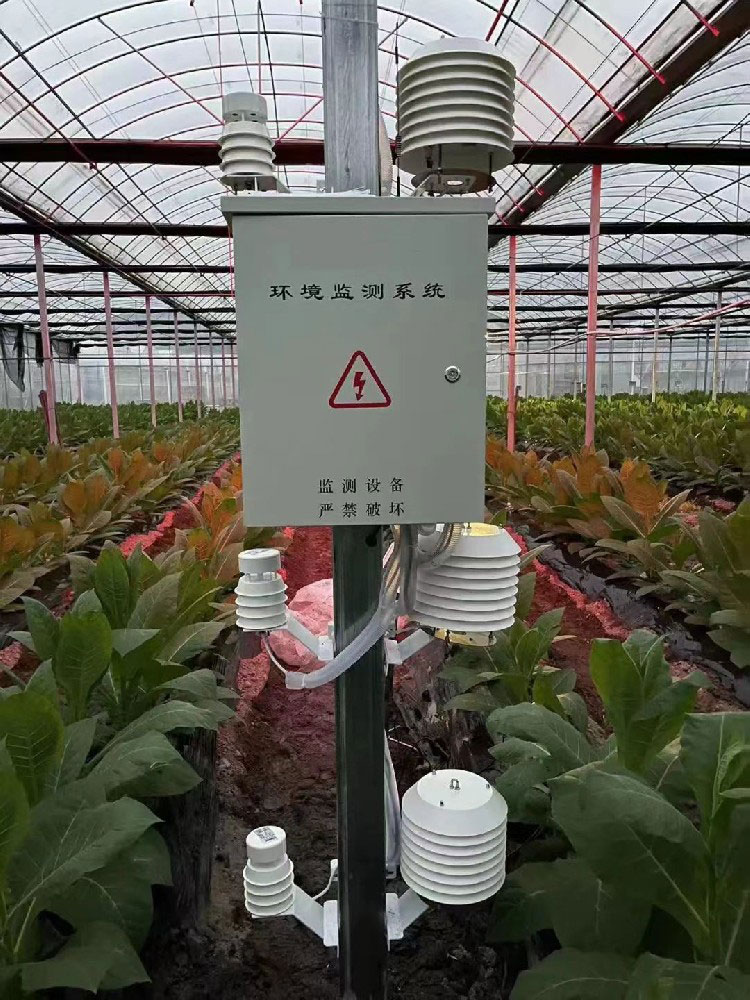
A greenhouse environmental point records the managed enclosure; an outdoor station records a different exposure. Keep their identities visible in the weekly review. Ventilation, shading and irrigation can change indoor conditions without a matching outdoor change. The two records are useful together when the question is how the enclosure responded, not when they are silently merged into one weather series.
Likewise, a light measurement must retain its quantity and unit. Illuminance, photosynthetic photon measurements, solar irradiance and sunshine duration are not interchangeable labels. The NBL-W-HPRS measures irradiance on its installed plane over 0-2000 W/m2. It does not independently supply sunshine hours or a crop-specific photosynthesis result.
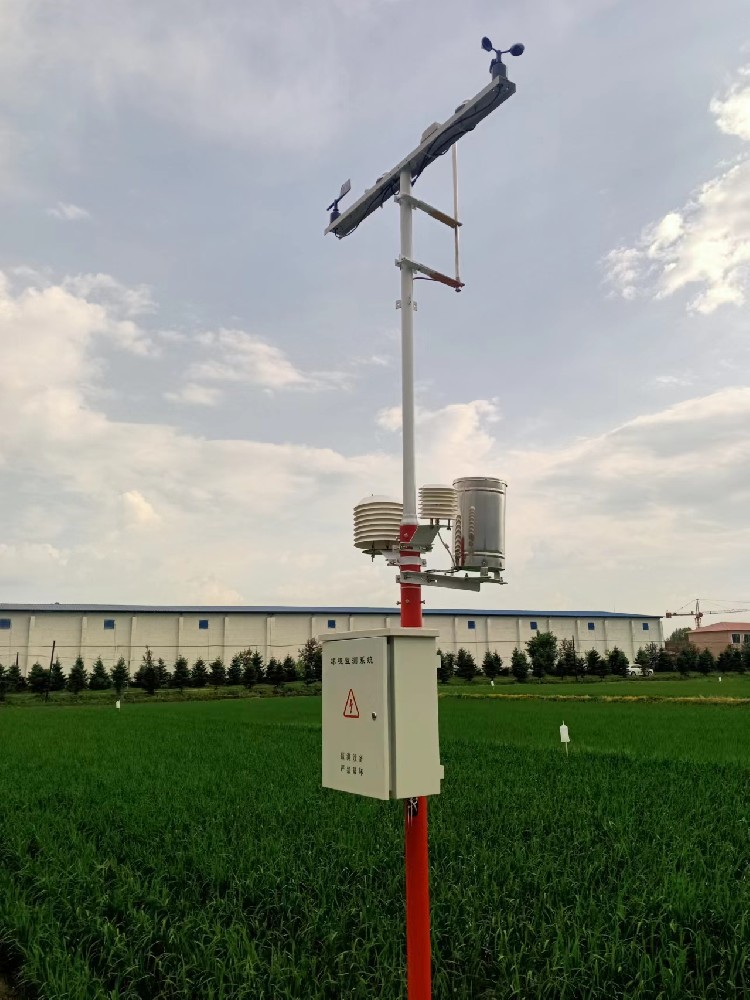
Lay out the week as a timeline: planting or transplanting, irrigation, rainfall, field operations and observed crop condition. Then examine the measurements around the relevant intervals. A weekly mean can help compare broad conditions, while the time series is needed to investigate an event. Avoid assigning a cause simply because an extreme and a crop symptom appeared in the same week.
Compare like periods when reviewing different fields or seasons. A calendar week at flowering in one field is not equivalent to the same week before emergence in another. Record crop stage and observation location alongside the summary. Where a model is used, retain its required input quantities, time step and crop assumptions rather than substituting whatever weekly figures are easiest to export.
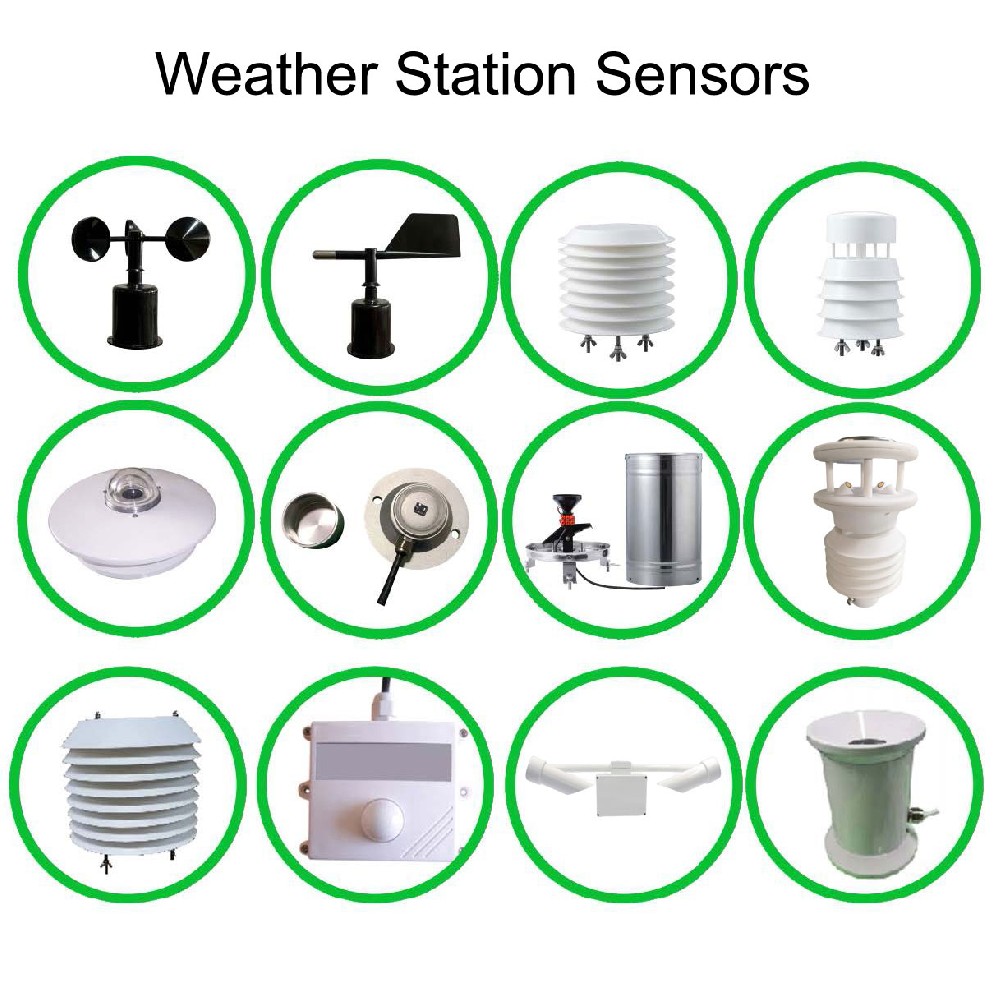
Report missing periods visibly. In an illustrative schedule with one expected observation per hour, a seven-day week has 168 expected records. If 120 valid records are available, record completeness is 120 / 168 = 71.4%. That percentage does not establish fitness for use: a gap during the critical night or rain event can matter more than a longer gap during an unrelated period.
Do not fill missing rainfall with zero or use a held temperature as a fresh observation. Establish whether late-arriving records change the summary and identify revised reports. Daily boundaries and accumulated rain resets are addressed separately in farm weather station reporting; the weekly review still needs the event times and field context.
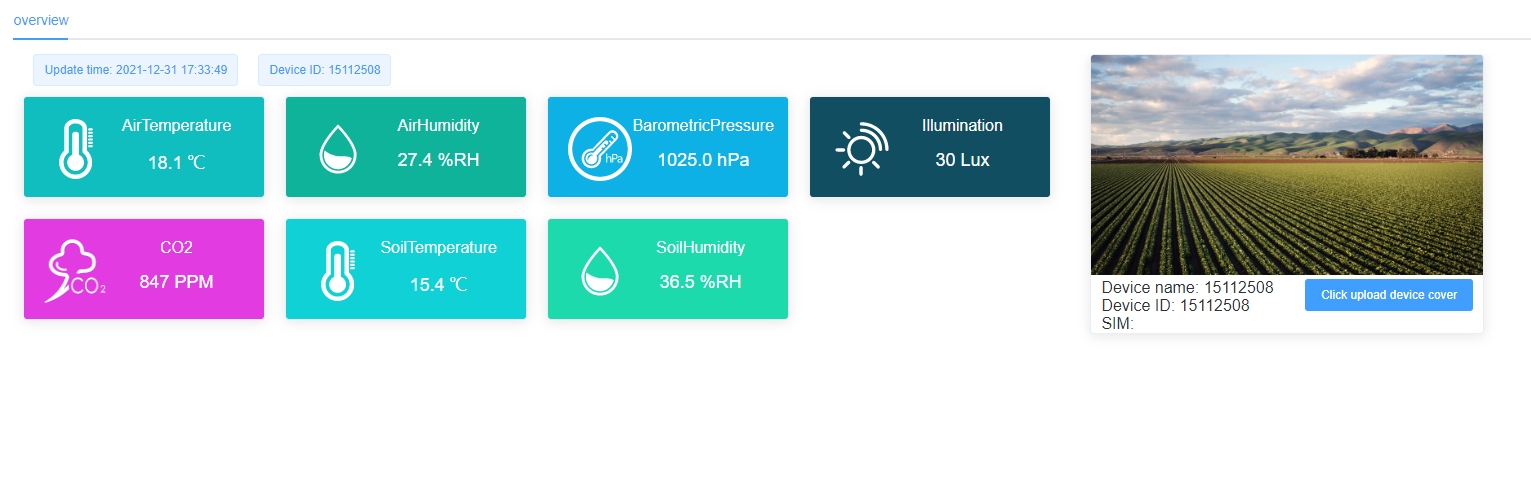
| Example component | Relevant specification | Reporting implication |
|---|---|---|
| NBL-W-LBTH | Air temperature -40 to 80 C, +/-0.5 C; humidity 0-100% RH, +/-5% RH; pressure 10-1200 hPa, +/-1.5 hPa | Define the sample and summary intervals; do not confuse resolution with accuracy. |
| NBL-W-SS and NBL-W-DS | Wind speed 0-45 or 0-70 m/s; direction 0-360 degrees; IP65 | Specify the wind quantities required by the work review rather than an unexplained weekly number. |
| NBL-W-RS | 0.2 mm resolution; 0-4 mm/min intensity range; operation 0-50 C | Retain event timing and check that the rain configuration suits the operating conditions. |
| NBL-S-THR | Soil temperature and moisture; DC 12-24 V; RS485 Modbus RTU, 4-20 mA or 0-5 V versions | Associate each channel with the actual depth and management zone. |
A TG462/TG462S logger and gateway can collect compatible field signals and transfer records through the selected network configuration. RS485 alone does not define every device's protocol or register meaning. Confirm Modbus RTU support where needed, channel scaling, timestamps and the receiving application's summary rules before commissioning the report.
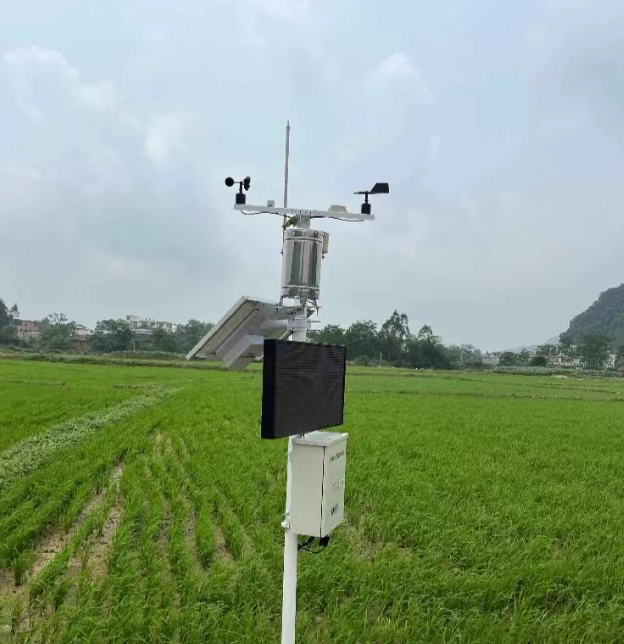
No. It can conceal short colder periods. Review the relevant time series, sensor exposure, crop stage and field observations. Air measured at the station may also differ from the temperature at a sensitive plant part.
Not alone. Rain distribution, soil storage, rooting conditions, irrigation already applied and the crop's requirements matter. Use the station record as one input and verify the field conditions rather than subtracting rainfall mechanically from a fixed dose.
No. A disease assessment needs the relevant crop, pathogen and model inputs. Humidity is not a direct leaf-wetness observation, and a weekly average may discard the duration and timing the model requires.
State the limitation explicitly. A high completeness percentage cannot reconstruct the missing event. Use any independent evidence with its source and uncertainty identified, and do not present an estimate as a station observation.
Send NiuBoL the field list, crops and stages, intended review questions, required measurements and an example of the desired report. Include existing logger interfaces and the receiving system so acquisition and reporting requirements can be assessed together.
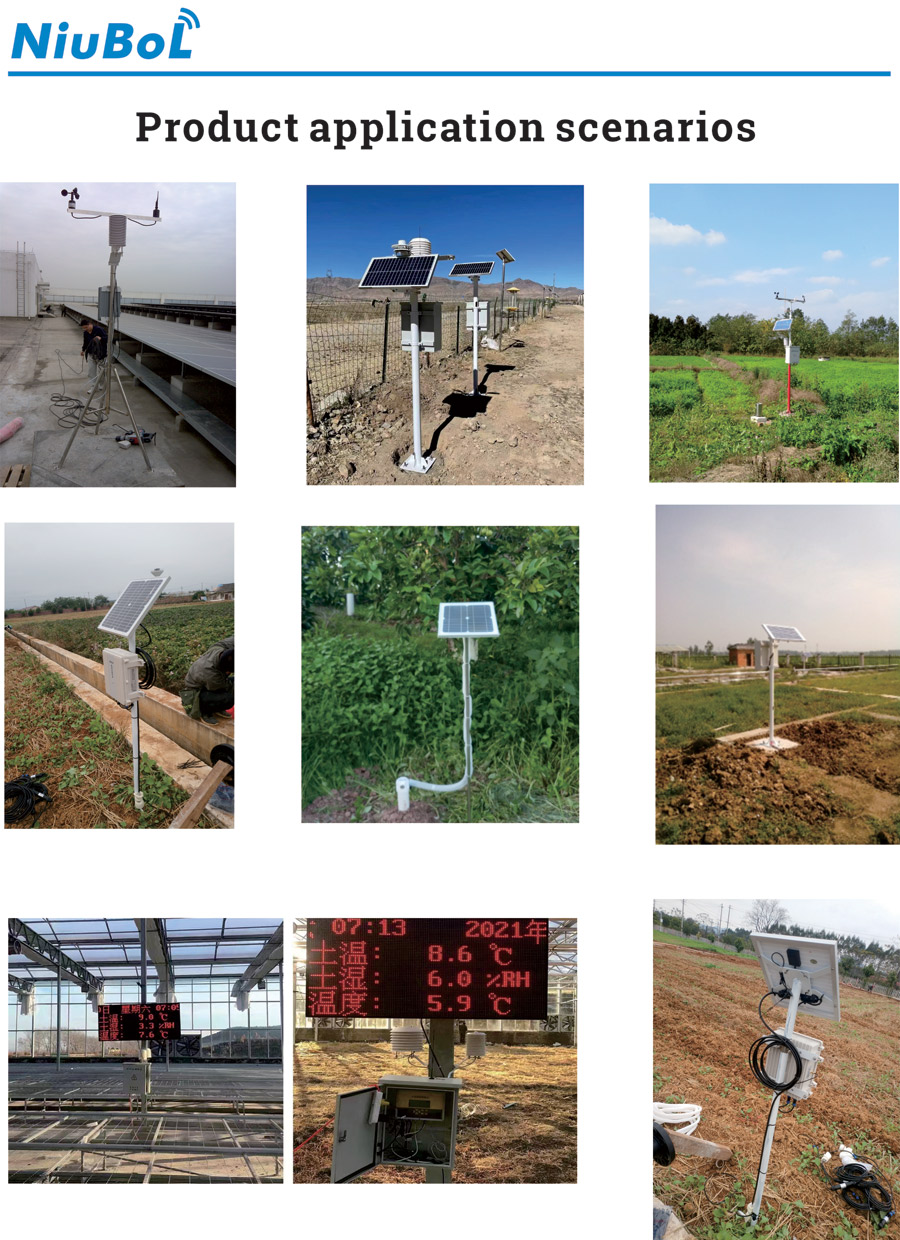
A weekly agricultural weather review is useful when summary figures remain connected to event timing, crop stage and valid observations. Keep soil, greenhouse and outdoor records distinct, examine gaps around important periods and avoid claims that the measurements cannot establish. Configure the NiuBoL station and report around the decisions the farm actually needs to review.
Prev:Weather Station Preventive Maintenance for Limited-Access Sites
Next:Professional Weather Station Installation: Diagnose First-Start Readings
Related recommendations
Sensors & Weather Stations Catalog
 Agriculture Sensors and Weather Stations Catalog-NiuBoL.pdf
Weather Stations Catalog-NiuBoL.pdf
Agriculture Sensors Catalog-NiuBoL.pdf
Water Quality Sensor Catalog-NiuBoL.pdf
Related products
 Combined air temperature and relative humidity sensor
 TDR Soil Moisture & Temperature Sensor for irrigation| RS485 |4-20mA| NBL-S-THR
 Soil pH sensor RS485 soil Testing instrument soil ph meter for agriculture |NBL-S-PH
 Wind Speed sensor Output Modbus/RS485/Analog/0-5V/4-20mA
 Tipping bucket rain gauge for weather monitoring auto rainfall sensor RS485/Outdoor/stainless steel
 Pyranometer Solar Radiation Sensor 4-20mA/RS485


Screenshot, WhatsApp to identify the QR code
WhatsApp number:+8615367865107
(Click on WhatsApp to copy and add friends)

