





— Blogs —
—Products—
 Consumer hotline +8618073152920
WhatsApp:+8615367865107
Address:Room 102, District D, Houhu Industrial Park, Yuelu District, Changsha City, Hunan Province, China
Product knowledge
Time:2025-04-27 17:22:45 Popularity:1922
A local weather station comparison with regional records should match the data type, time period, unit and exposure before judging accuracy. A nearby published value may be a forecast, a station observation or a processed summary. Differences do not automatically prove either source wrong, and adjusting the local sensor to match them can hide the real cause.

Record where the comparison value comes from and what it represents. A city forecast for an hour is not the same product as a measured temperature at an outdoor station. Even a value marked current can refer to a different site or an older observation.
Ask for the observation location and time, measurement or processing method where available, and any missing-data indication. Retain the original record rather than copying one number from a screen without context. The first aim is to establish whether the two records answer the same question.
| Comparison field | What to match | Misleading comparison |
|---|---|---|
| Data product | Observation against observation, or clearly identified model output | A forecast compared with a point measurement as a calibration test |
| Time | Observation time, time zone and interval boundaries | Server arrival time treated as the measurement time |
| Quantity and unit | The same physical quantity and engineering unit | Station pressure compared directly with reduced sea-level pressure |
| Statistic | Sample, mean, maximum or accumulation on the same basis | A latest wind sample compared with an interval gust |
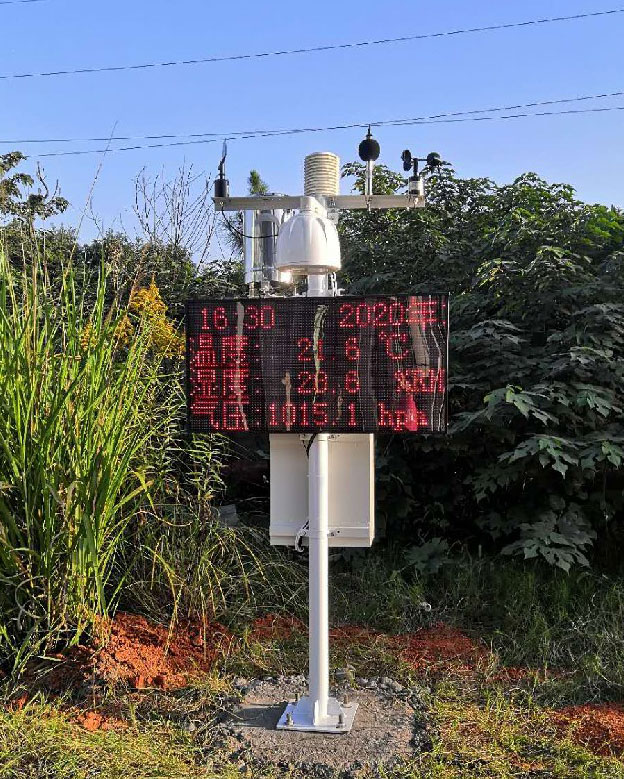
| Exposure | Height, surroundings, land cover and relevant location | A sheltered crop point judged against an open reference site without context |
Preserve these fields for the period under review. They are especially important after a configuration change or when staff compare a local display with a new public data source. Changing the reference can create an apparent station change even when the instrument is untouched.
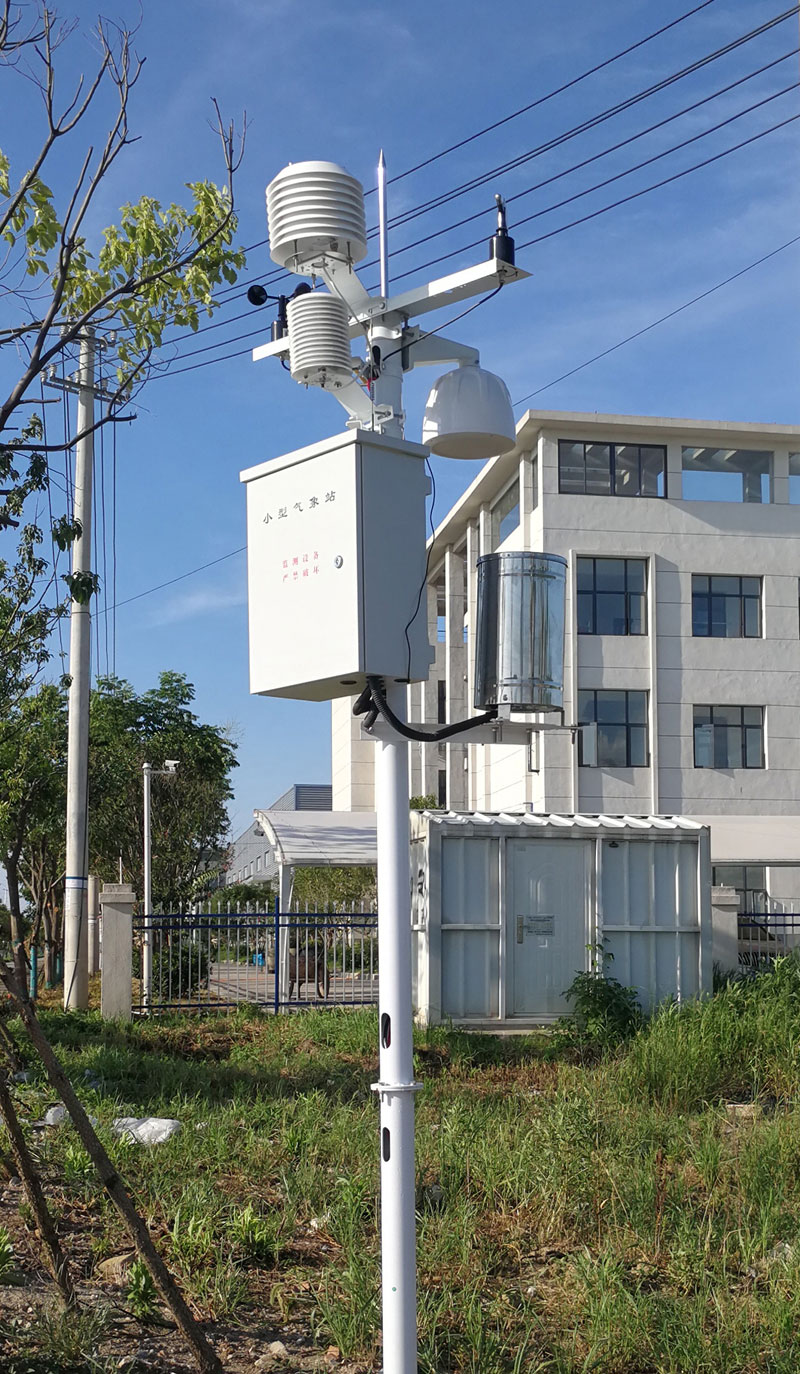
An air sensor near a sun-heated wall or paved area can differ from an open reference. A sheltered growing area can also experience a different local environment. Those possibilities require a site review, not an immediate assumption that the temperature calibration has failed.
The NBL-W-LBTH temperature channel has an accuracy specification of +/-0.5 C and resolution of 0.1 C. The display step is not a permitted difference between arbitrary stations, and the accuracy specification does not remove siting effects.
When instrument performance is questioned, compare a suitable reference under comparable conditions and use an agreed method. Do not calibrate a point sensor against a distant station merely because that record is published by an established service.
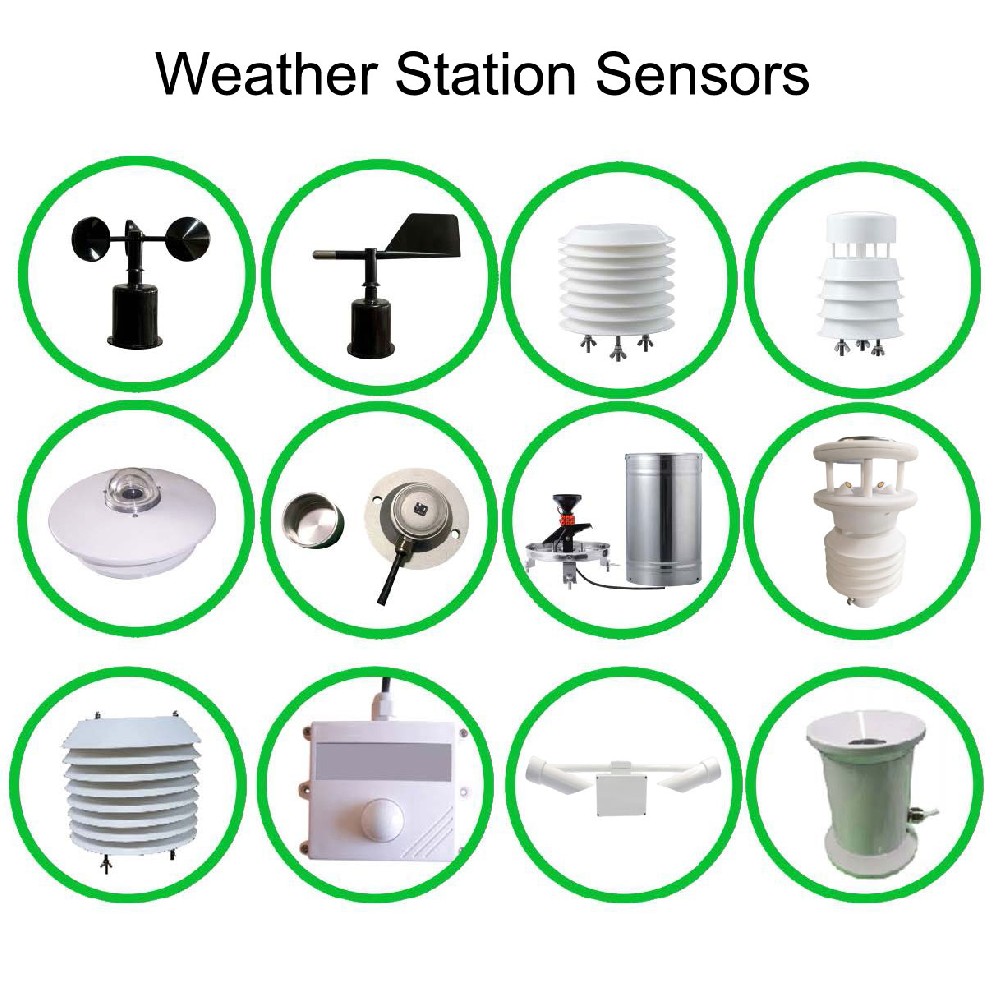
Pressure observed at the sensor and pressure reduced to another reference level are different data products. Confirm elevation and any applied reduction before treating a persistent difference as sensor drift. Retain the direct observation when software generates an additional calculated pressure.
Radiation needs its own geometry. A horizontal pyranometer and one aligned with a tilted array need not agree. The NBL-W-HPRS measures irradiance on its installed plane; an orientation label belongs with its record. Lux, solar irradiance and PAR measurements are not interchangeable references.
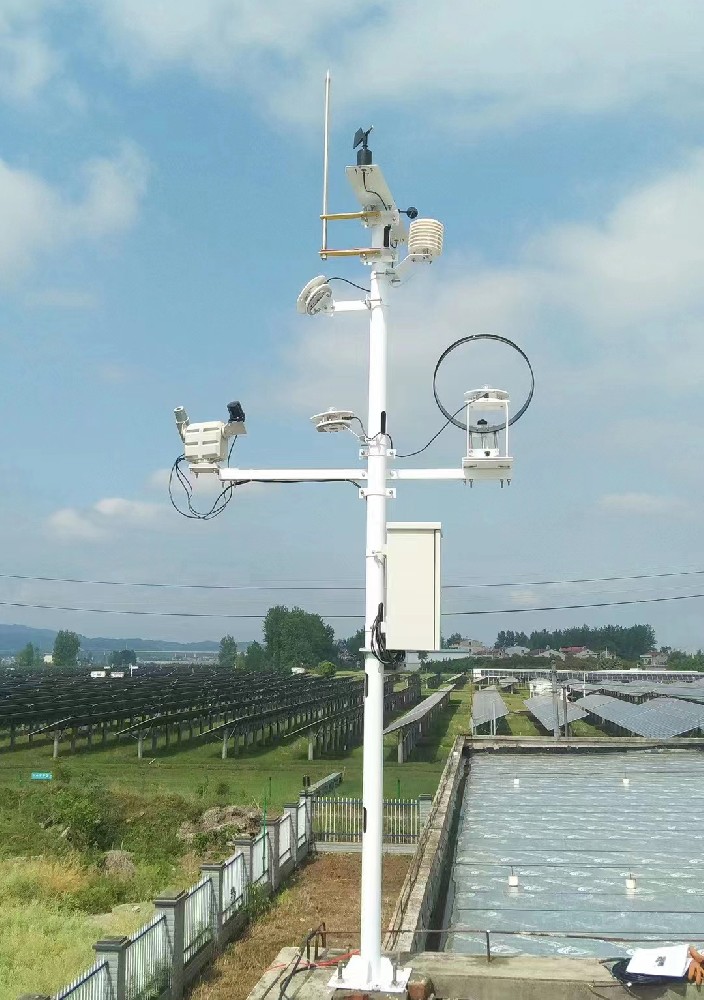
For wind, compare the same statistic and period at suitable exposures. Buildings, vegetation and terrain can alter airflow. A brief local maximum can also be lost in a long reporting interval, so the uploaded value may not represent the same event as a published gust.
Rainfall varies spatially, and daily totals depend on the accumulation boundary. Compare the event record before concluding that a gauge is biased. Check for reset times, interrupted acquisition, collector blockage and the suitability of the instrument for the precipitation present.
The NBL-W-RS has 0.2 mm increments and is specified for liquid precipitation at 0-50 C. A frozen or blocked collector must not produce an accepted dry-weather interpretation simply because its output remained zero.
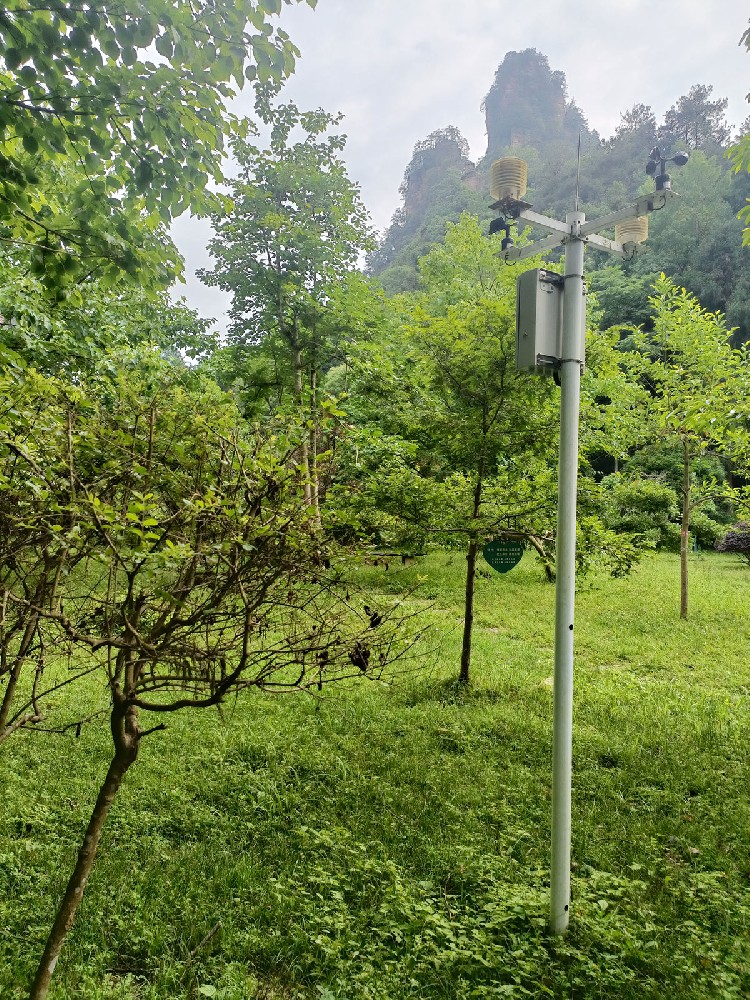
| Example instrument | Relevant detail | Comparison requirement |
|---|---|---|
| NBL-W-LBTH pressure | 10-1200 hPa; accuracy +/-1.5 hPa | Identify whether the receiving value is direct or reduced pressure |
| NBL-W-SS | 0-45 or 0-70 m/s versions; accuracy +/-(0.3 + 0.03V) m/s | Match range, exposure and the recorded wind statistic |
| NBL-W-RS | 0.2 mm increments; accuracy +/-4% at 2 mm/min in an indoor static test | Do not use that test specification as a universal inter-site agreement limit |
| NBL-W-HPRS | 0-2000 W/m2; response time <=35 s to 99% | Match the plane and assess the time variation being compared |
These are model-specific examples, not a uniform specification for all photographs. Keep the installed model and output version with the station history. Replacing an instrument or changing a calculation without a dated note makes later comparisons harder to interpret.

Compare a suitable sequence covering the suspected condition. A daytime-only temperature difference may call for an exposure review; a constant conversion difference may call for a unit or scaling check. These are investigation clues, not proof of a cause.
Confirm observation freshness at the logger and receiving service. RS485 Modbus RTU connects compatible digital instruments, but the host must still decode the correct register and unit. A stale local record can disagree with a current regional observation even though both displayed numbers look plausible.
Published summaries can also use processing that differs from a downloaded sample series. The National Weather Service observation FAQ gives examples of why daily temperature products need not match extrema taken from a different observation archive.
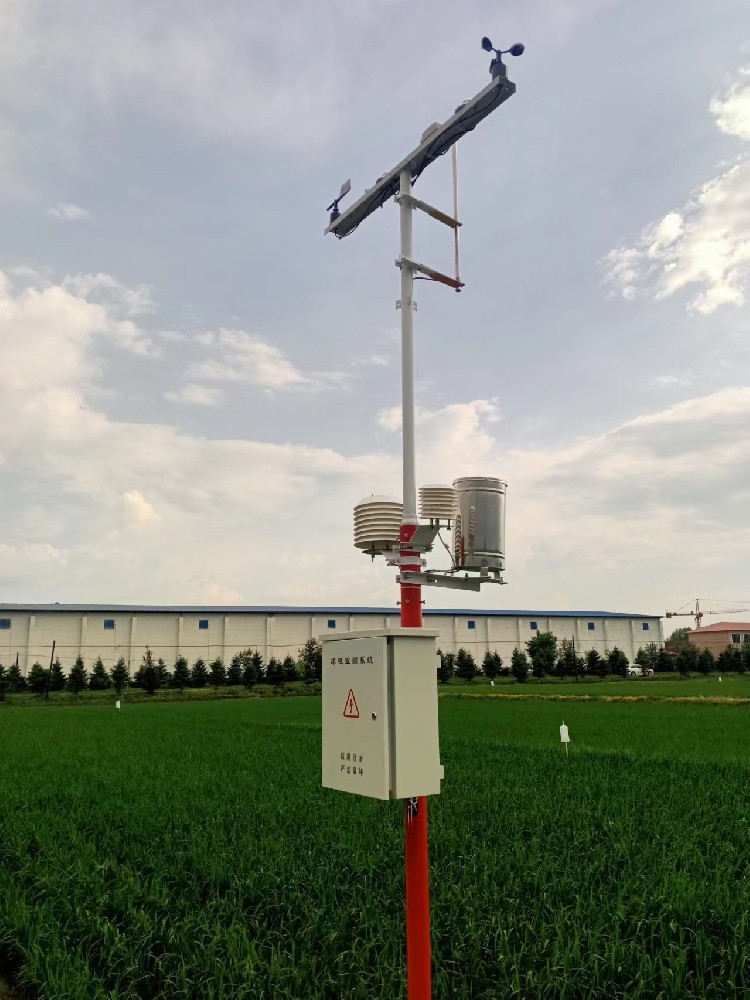
If the issue is a time convention or unit, correct the receiving configuration and retain a change note. If exposure is unsuitable for the intended task, plan a documented installation correction. If a valid local effect explains the difference, keep it visible rather than forcing agreement with the regional record.
For a NiuBoL support review, send both unedited data series, locations, observation periods, model details and site photographs. Identify any maintenance or software change. This allows the comparison to guide a useful action without promising that a local station will outperform a regional forecast.

No. It predicts conditions rather than measuring the same sensing point. Use an appropriate instrument reference and comparison method when calibration is in question.
No. Location, exposure, time and processing can differ. Check those factors before deciding whether an instrument has a measurement fault.
Check whether direct station pressure is being compared with a reduced pressure product, then check units and configuration. The pattern alone does not establish calibration drift.
The sites may receive different rain, or their accumulation periods and reset rules may differ. Compare event timing and data availability before applying a gauge correction.
Only if both represent the same statistic and interval. A latest sample, mean and maximum are different quantities even when all are expressed in m/s.
Only after the cause is established and the correction is justified. Do not use an offset to conceal unsuitable exposure, stale data or a mismatch between quantities.
Provide both records with observation times, units, statistics, site context and instrument details. A screenshot without those fields cannot support a defensible comparison.
A local weather station comparison should explain differences before correcting them. Match the data products and time bases, inspect exposure and test the acquisition path where necessary. NiuBoL equipment and support can then address a demonstrated instrument or installation problem while preserving valid local observations that a regional record does not represent.
Related recommendations
Sensors & Weather Stations Catalog
 Agriculture Sensors and Weather Stations Catalog-NiuBoL.pdf
Weather Stations Catalog-NiuBoL.pdf
Agriculture Sensors Catalog-NiuBoL.pdf
Water Quality Sensor Catalog-NiuBoL.pdf
Related products
 Combined air temperature and relative humidity sensor
 TDR Soil Moisture & Temperature Sensor for irrigation| RS485 |4-20mA| NBL-S-THR
 Soil pH sensor RS485 soil Testing instrument soil ph meter for agriculture |NBL-S-PH
 Wind Speed sensor Output Modbus/RS485/Analog/0-5V/4-20mA
 Tipping bucket rain gauge for weather monitoring auto rainfall sensor RS485/Outdoor/stainless steel
 Pyranometer Solar Radiation Sensor 4-20mA/RS485


Screenshot, WhatsApp to identify the QR code
WhatsApp number:+8615367865107
(Click on WhatsApp to copy and add friends)

