





— Blogs —
—Products—
 Consumer hotline +8618073152920
WhatsApp:+8615367865107
Address:Room 102, District D, Houhu Industrial Park, Yuelu District, Changsha City, Hunan Province, China
Product knowledge
Time:2025-01-17 15:54:51 Popularity:1734
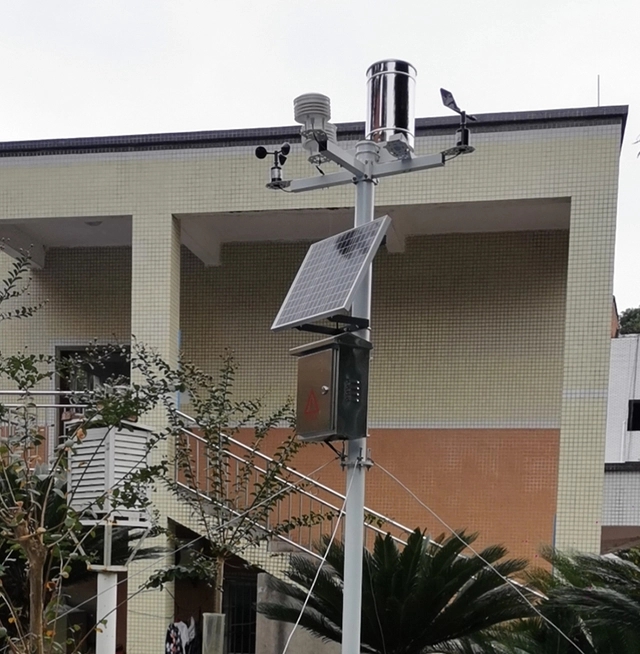
A campus meteorological station project can turn rainfall observations into a practical rainwater-harvesting lesson. Students can estimate the rain falling on a defined roof area, compare that estimate with a separately measured collection volume and investigate the difference. The weather station measures rainfall; it does not directly measure tank contents, water quality or the amount available for use.
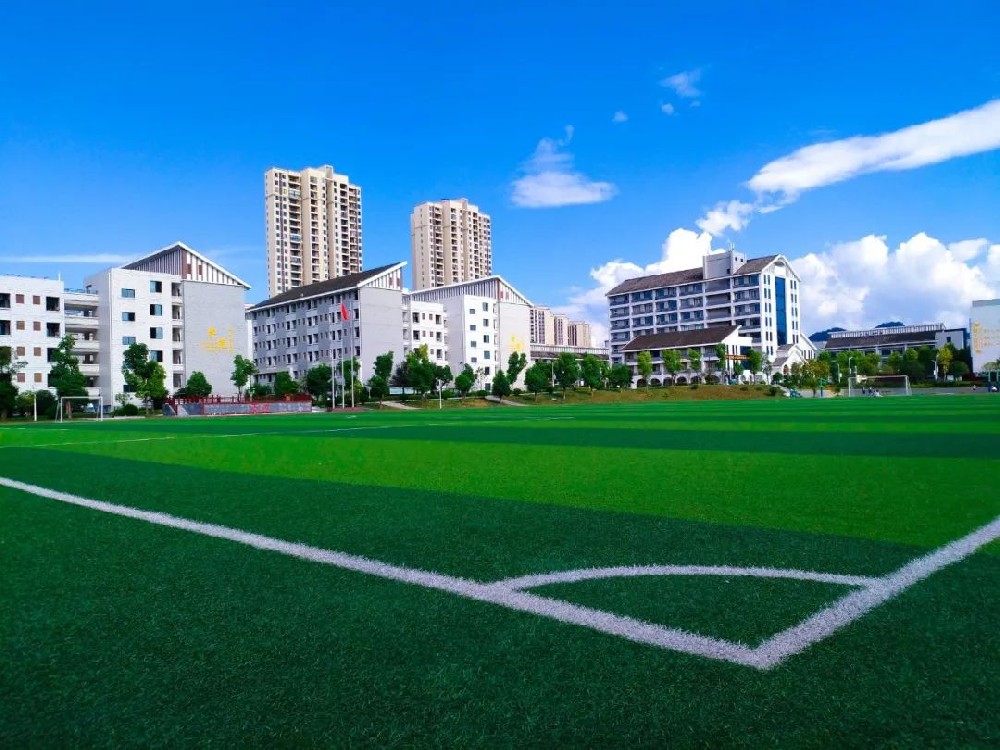
Schools often buy a weather station with a display showing many variables. Its educational value depends on what students can do with the observations. A rainwater investigation connects a measured weather event to area, volume, uncertainty and campus water use without requiring students to service electrical equipment or climb onto a roof.
The question can be specific: how much rain fell on an agreed roof catchment during one event, and how much reached the collection system? Teachers can prepare the catchment drawing with facilities staff. Students work from the approved dimensions and station records, while authorized staff handle any physical inspection or tank measurement.
This is a teaching exercise, not a design approval for gutters, storage structures or drinking-water systems. A useful school installation makes that distinction clear while giving the class enough information to explain what was measured and what was calculated.
Rainfall depth and a defined event period are the essential station outputs. Temperature and humidity can support discussion of drying conditions, while wind observations can help explain exposure. Those extra channels do not directly measure roof losses or make a single-station rainfall value representative of every part of the campus.
| Equipment or quantity | Example NiuBoL specification | Role in the lesson |
|---|---|---|
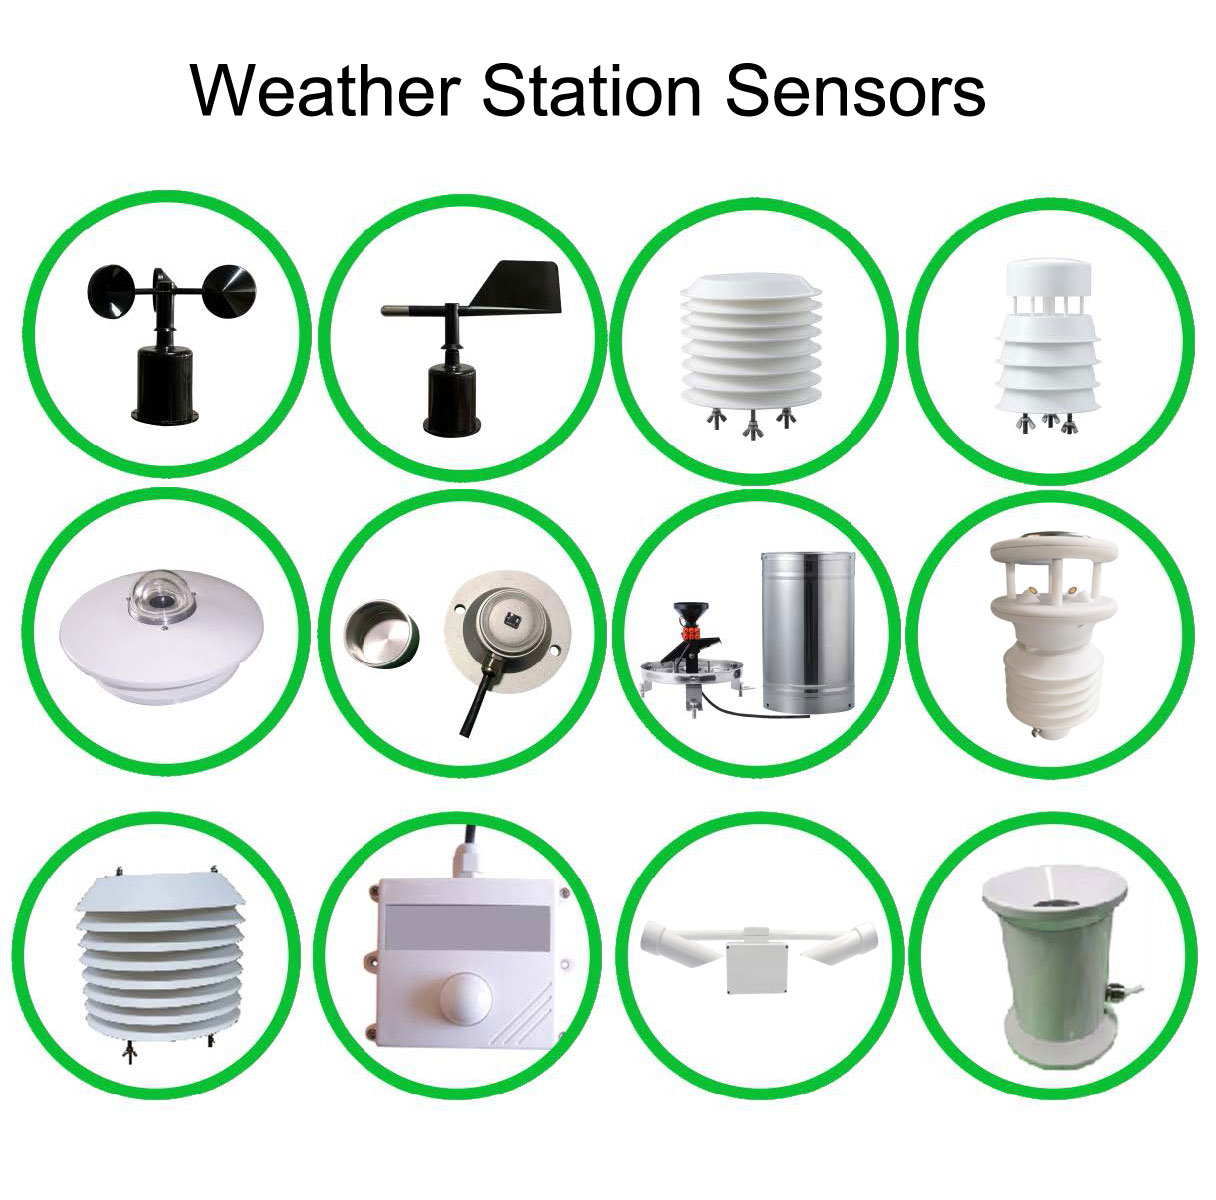
| NBL-W-RS rainfall | 0.2 mm resolution; 0-4 mm/min range; +/-4% under indoor static test at 2 mm/min | Measure rain depth for the chosen event |
| NBL-W-RS connection | Reed-switch, voltage or RS485 output versions; supply DC 5 V or DC 12-24 V according to configuration | Match the acquisition input to the ordered version |
| NBL-W-LBTH air conditions | Temperature -40 to 80 C, accuracy +/-0.5 C; humidity 0-100% RH, accuracy +/-5% RH | Provide atmospheric context, not measured roof evaporation |
| NBL-W-LBTH digital integration | DC 12-24 V; RS485 Modbus RTU | Acquire compatible weather records through a logger or gateway |
| Collection volume | Requires an appropriate separate measurement | Compare actual collected water with the rainfall-based estimate |
The NBL-W-RS tipping bucket rain gauge measures liquid precipitation and has a stated operating temperature of 0-50 C. A school planning winter observations must address freezing conditions rather than treating the storage-temperature range as an operating specification.
One millimetre of rain over one square metre corresponds to one litre of water. The theoretical rainfall volume in litres is therefore rainfall depth in millimetres multiplied by horizontal catchment area in square metres. Use the roof's horizontal projected collection area, not automatically the larger sloped surface area.
| Illustrative exercise input | Value | Interpretation |
|---|---|---|
| Horizontal roof catchment | 200 m² | An example area, not a surveyed campus roof |
| Recorded event rainfall | 10 mm | An example observation for the calculation |
| Theoretical rain on the catchment | 200 × 10 = 2000 L | Rainfall volume before collection losses or storage constraints |
The 2000 L result is not a promise of recoverable water. Wetting, leakage, diverted first runoff, gutter overflow and a full tank can reduce what is collected or retained. Collection efficiency depends on the actual roof, conveyance and storage arrangement; a generic percentage can hide the losses the class is trying to investigate.
The classroom needs the event start and end, rain depth, units and any missing-data indication. A live display may show today's accumulation while the class is analyzing a storm that crossed midnight. Export or otherwise retrieve the observations for the actual event rather than copying whichever number is on the screen at lesson time.
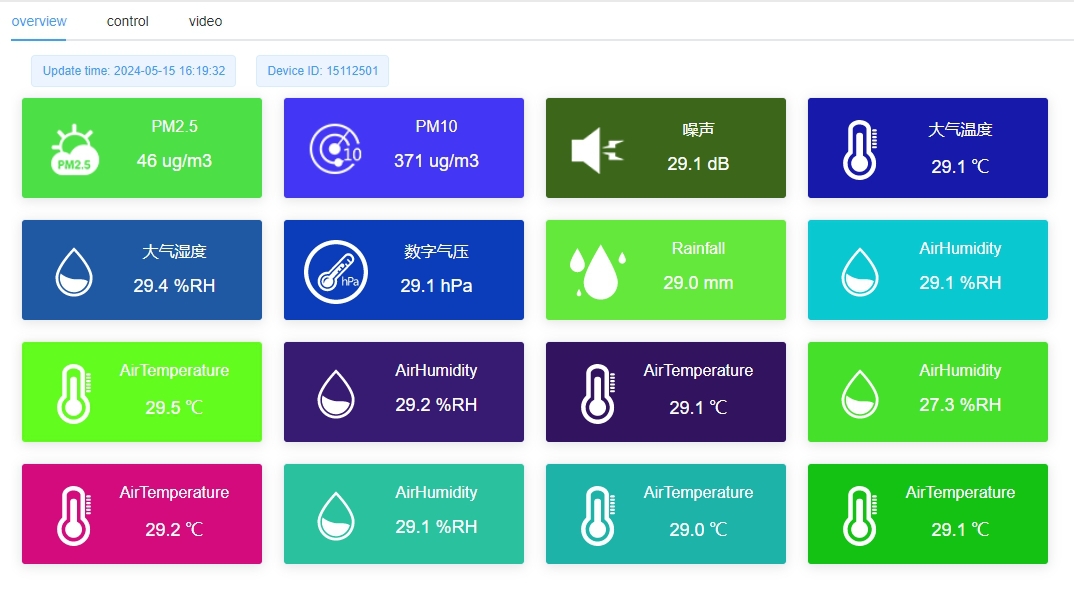
The displayed channel list also depends on the configured station. A dashboard containing particulate matter, noise or other environmental tiles does not mean those instruments are included in every campus package. Keep the lesson's rainfall and weather channels identifiable, and request the data access needed by teachers when selecting the system.
If the collected volume is lower than the theoretical rainfall volume, first check the comparison. Did both records cover the same period? Was the tank already partly full? Was water used or discharged during the event? A change in tank volume is not necessarily the total water that entered it.
Next examine the catchment definition and the collection path with facilities staff. Some roof sections may drain elsewhere. A first-runoff diversion may be intentional. These are physical explanations that a rain sensor alone cannot resolve. Record what is known and leave unmeasured losses as unmeasured rather than assigning them all to evaporation.
Finally consider rainfall exposure and instrument condition. An overhanging roof, tree canopy or blocked collector can affect the gauge record. Use these checks to teach how an observation can be limited by its location and condition. Students should not change sensor calibration merely to make the two volumes agree.
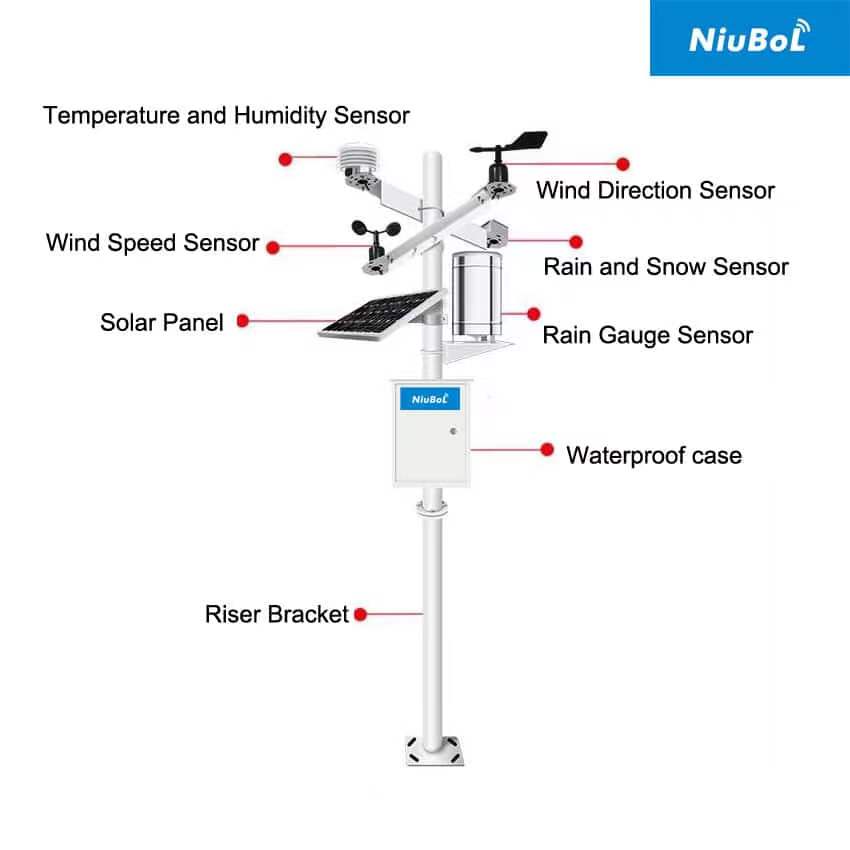
The station can be located where weather exposure and service access are suitable, with the classroom display elsewhere. Do not place the rain collector beneath the roof being studied: the lesson needs rainfall input, not roof runoff entering the gauge. Teachers should receive usable records without needing access to wiring or configuration controls.
A TG462 / TG462S logger is one possible acquisition component for compatible sensors. RS485 Modbus RTU, digital inputs and Ethernet support different parts of the data path, subject to the chosen configuration. The logger itself is IP30 and needs an appropriate protective enclosure outdoors. Required exports and classroom access should be demonstrated with the final software.
For a campus meteorological station project enquiry, describe the proposed lesson, required variables, available power, network and staff service arrangements. Include any separate tank-level or volume measurement. Start with a lesson the school can run and maintain; extra channels can be considered when they answer another clear educational question.
Only over a horizontal area of 1 m² before losses. For 200 m², the theoretical rainfall volume is 2000 L. Actual collection and usable storage require separate information.
The rainfall-volume calculation uses the horizontal projected catchment area. Ask facilities staff to provide the relevant dimensions and identify which sections drain to the collection system.
No. Weather sensors do not establish chemical or microbiological water quality. Any water-quality investigation needs appropriate separate instruments or analysis and a suitable school procedure.
A storm can cross the daily reset time, and several storms can occur in one day. Use an agreed event period and records covering that period for both rainfall and collected volume.
Only when the rainfall, catchment area and collected volume are sufficiently defined for that comparison. Identify water use, overflow and missing observations; otherwise the resulting ratio can describe incomplete accounting rather than system efficiency.
Run the proposed lesson with the actual data output. Confirm event retrieval, units, channel identification and teacher access, together with a clear maintenance responsibility. A working public display alone does not establish that the required classroom record is available.
A campus meteorological station project becomes a useful educational resource when observations support an answerable question. Rainwater harvesting connects rainfall depth to catchment area and volume, while exposing the difference between a theoretical calculation and collected water. Specify the sensors, records and separate volume measurement around that lesson rather than buying an unexplained list of parameters.
Related recommendations
Sensors & Weather Stations Catalog
 Agriculture Sensors and Weather Stations Catalog-NiuBoL.pdf
Weather Stations Catalog-NiuBoL.pdf
Agriculture Sensors Catalog-NiuBoL.pdf
Water Quality Sensor Catalog-NiuBoL.pdf
Related products
 Combined air temperature and relative humidity sensor
 TDR Soil Moisture & Temperature Sensor for irrigation| RS485 |4-20mA| NBL-S-THR
 Soil pH sensor RS485 soil Testing instrument soil ph meter for agriculture |NBL-S-PH
 Wind Speed sensor Output Modbus/RS485/Analog/0-5V/4-20mA
 Tipping bucket rain gauge for weather monitoring auto rainfall sensor RS485/Outdoor/stainless steel
 Pyranometer Solar Radiation Sensor 4-20mA/RS485


Screenshot, WhatsApp to identify the QR code
WhatsApp number:+8615367865107
(Click on WhatsApp to copy and add friends)

