





— Blogs —
—Products—
 Consumer hotline +8618073152920
WhatsApp:+8615367865107
Address:Room 102, District D, Houhu Industrial Park, Yuelu District, Changsha City, Hunan Province, China
Product knowledge
Time:2025-09-29 16:05:47 Popularity:1178
Environmental monitoring for smart cities needs separate measurement rules for air particles, noise, water and weather, even when their records appear on one platform. Select each instrument for its intended use, location and exposure, then define units, averaging periods and quality checks. A low-cost sensor network can improve local visibility; it does not automatically produce regulatory measurements or establish the cause of an environmental event.
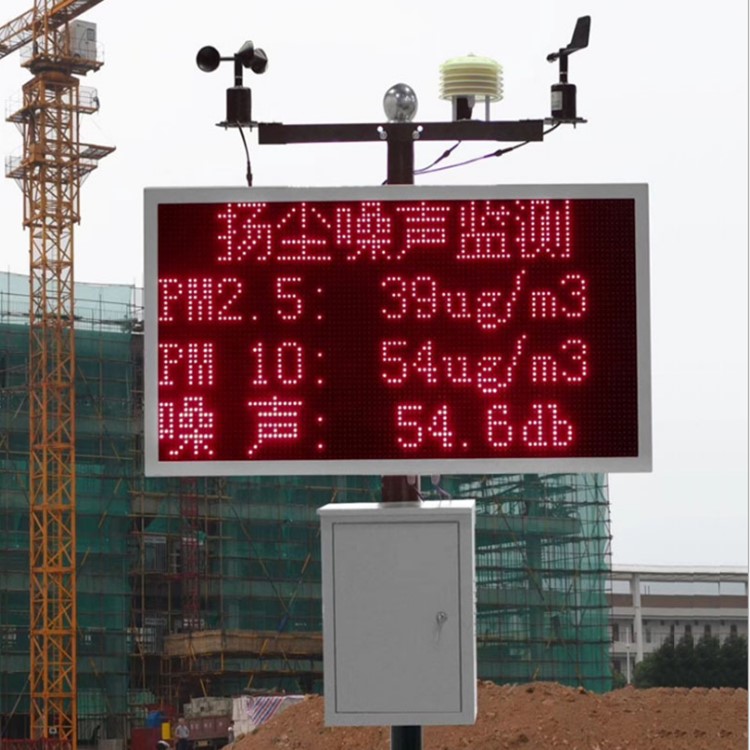
A construction-site particle monitor, a roadside microphone and a water-level transmitter answer different questions. Combining them is useful when operators can see where each reading came from and what it represents. It becomes misleading when instantaneous values, time averages and calculated indices are displayed as though they have the same meaning.
Start the design with the intended response: investigate a dust episode, review a noise complaint, inspect rising water or evaluate conditions at a public facility. Define the spatial boundary as well. A reading beside a road is a local observation, not a city-wide exposure estimate. A change following a traffic intervention is not, by itself, proof that the intervention caused it.
| Channel | Record to define | Common interpretation error |
|---|---|---|
| PM2.5 and PM10 | Mass concentration in micrograms/m3, sampling and reporting periods, quality flags | Adding PM2.5 to PM10 as if they were independent size fractions |
| Noise | Weighting, response setting and the supported reported acoustic metric | Treating a series of fast dB readings as an established LAeq measurement |
| Water level | Depth or elevation, datum, mounting offset and valid range | Calling water level a water-quality measurement |
| Wind | Speed, direction reference, exposure and averaging convention | Assigning a pollution source solely from one wind direction reading |
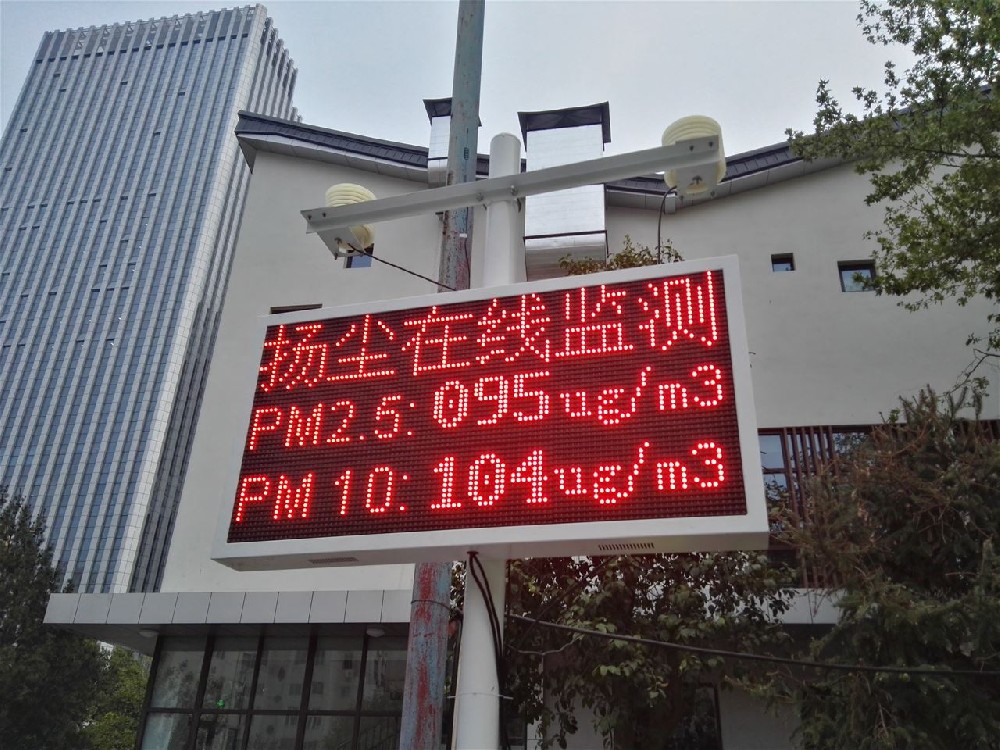
The NiuBoL NBL-W-PM particle sensor uses laser scattering with a fan-assisted sampling path. Its published measurement ranges are 0-1000 micrograms/m3 for PM2.5 and 0-2000 micrograms/m3 for PM10. These are range limits, not a statement that every concentration or aerosol type is measured with equal uncertainty.
Optical response depends on particle characteristics and operating conditions. The instrument does not identify chemical composition or measure gases such as NO2 or ozone. Keep the inlet clear, avoid placing it where an obstruction changes airflow, and inspect for contamination. Non-condensing humidity operation does not mean that fog, wet aerosol or a blocked inlet can be ignored when interpreting the data.
The US EPA air-sensor collocation guide describes comparing a sensor with a reference monitor at the same time and location. For a city project, use such comparisons to assess performance under representative local conditions before relying on differences between neighborhood sites. Any correction should retain its method and valid conditions; it should not silently overwrite the original record.
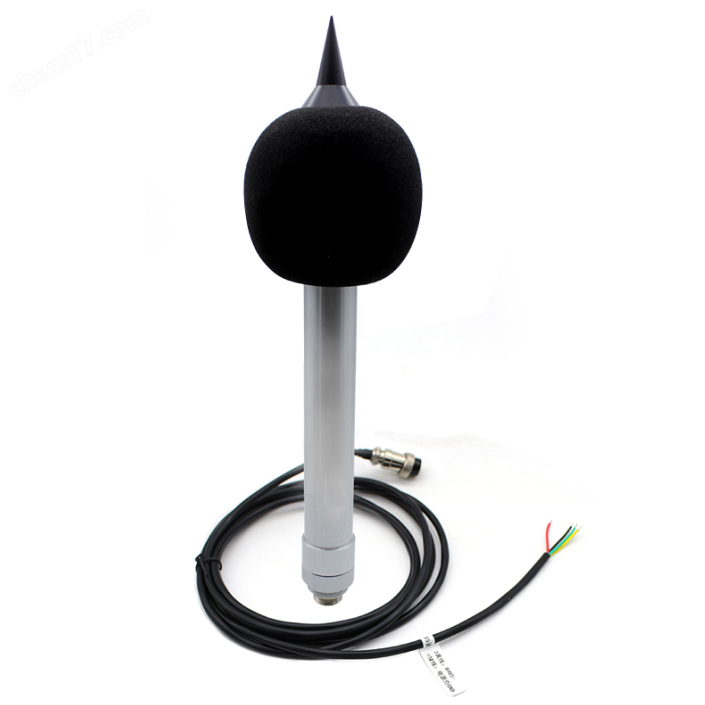
The NBL-W-NS noise sensor has a 30-130 dB measurement range and a stated 200 ms fast response. That response describes the instrument's time behavior; it is not a promise that a receiver can obtain a new Modbus record every 200 ms. It also does not establish which interval acoustic statistics the complete monitoring system calculates.
Before ordering, ask which frequency weighting and outputs the selected version supports, and whether the project requires LAeq, maximum levels or another defined metric. Decibels are logarithmic: an ordinary arithmetic mean of dB samples is not the energy-equivalent level. If a contractor proposes calculating a report metric, require the method, sampling basis and a suitable comparison test.
| Instrument item | Published configuration | Installation consequence |
|---|---|---|
| NBL-W-NS | 30-130 dB; 31.5 Hz-8 kHz; DC 12 V; RS485 Modbus RTU or a selected 4-20 mA version | Confirm the output and acoustic metric, not only the enclosure and range. |
| NBL-W-NS environment | -15 to 50 C; humidity below 80% RH; IP65 housing | IP65 does not remove the stated humidity limit or maintenance needs of the microphone and windscreen. |
| NBL-W-PM | DC 12-24 V; approximately 350 mW; RS485 Modbus RTU; -20 to 60 C; 0-99% RH, non-condensing | Size power for the complete station and assess condensation at the sampling location. |
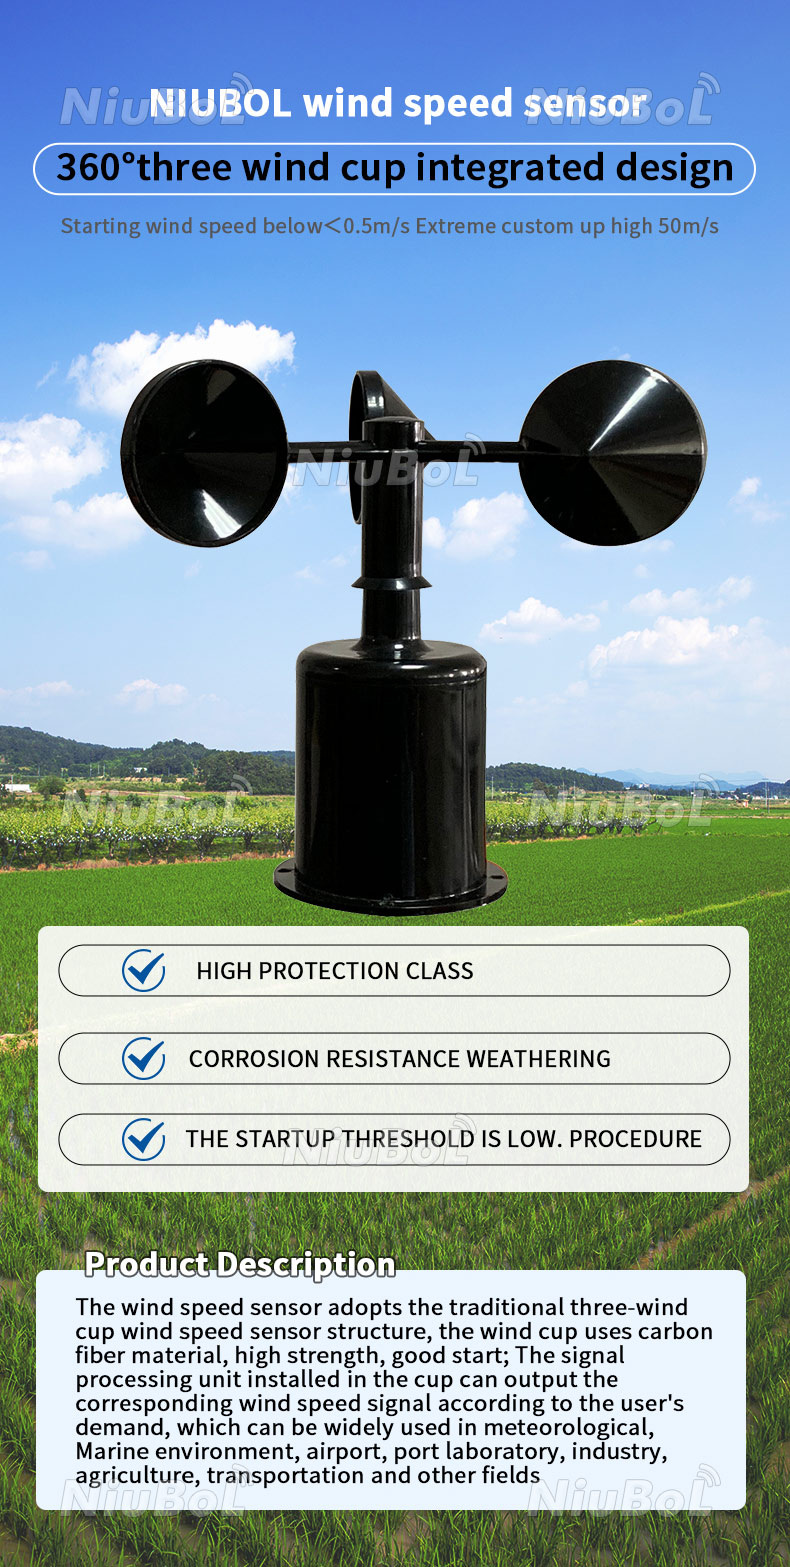
| NBL-W-SS cup wind sensor | IP65 | Position for the required exposure; a sheltered pole beside a wall will not represent open-area wind. |
A shared station location must suit every installed instrument. The noise sensor's humidity limit is different from the particle sensor's. Do not approve the combined station solely because one enclosure is weather-resistant. Check the microphone, air inlet, cable entries, power supply and servicing access separately, including conditions during the most difficult season.
Wind observations help operators investigate the timing and direction of transport during a dust event. Nearby walls, trees and traffic can distort the local flow. A cup anemometer and direction sensor on a convenient low bracket may therefore answer a different question from an exposed meteorological installation. Record the actual exposure rather than labeling every wind channel as representative of the whole district.
For a complaint investigation, compare synchronized particle, wind and activity records, noting changes in equipment or local works. This can guide a site visit or further measurement. It does not identify a responsible source without additional evidence. Similarly, temperature and humidity provide context for sensor behavior but do not convert an indicative particle monitor into an approved reference method.
A hydrostatic water-level sensor can support tank, drainage or flood-prone point monitoring when its range and construction suit the liquid and installation. Keep the sensing elevation, datum and any offset with the record. Two sites showing the same measured depth may have very different water-surface elevations and consequences.
Do not describe level as water quality. Monitoring pH, conductivity, dissolved oxygen or turbidity requires separate suitable instruments and maintenance. If several municipal departments will use the platform, assign responsibility for checking each channel rather than assuming the software provider will recognise fouling, a displaced probe or a changed reference elevation.
For RS485 Modbus RTU integration, test address, serial settings, register type and scaling at the receiver. Preserve acquisition time separately from upload time. Show stale data as stale; a station that has not transmitted should not continue to appear as a current green status simply because its last value was within a chosen threshold.
Commission with a channel-by-channel check: inspect exposure, compare a reading using an appropriate method, interrupt communication and verify the missing-data display. Retain raw values, corrections and configuration changes as distinguishable records. Set operational notifications with the responsible authority; do not invent a single threshold shared by dust, sound and water channels.
Not simply because it has many nodes. Establish the required use and applicable measurement method, then assess local sensor performance, including collocation where appropriate. A network intended to identify local patterns should not be represented as automatically suitable for regulatory compliance decisions.
No. Acoustic response, communication polling and platform upload intervals are different settings. Confirm the selected sensor's communication limits and the metric delivered. A fast response alone does not establish an LAeq reporting function.
They can be considered together only if exposure, power, service access and both instruments' environmental limits are satisfied. Check possible vibration, windscreen condition, inlet obstruction and condensation. The more permissive humidity specification of one sensor cannot be applied to the other.
Request the register map for the selected version, units and scaling, supported serial settings and timing requirements. Test actual values and missing-data behavior in the receiving PLC, RTU or platform. A successful serial connection does not prove that a reported environmental metric is interpreted correctly.
Separate instruments, mounting and power, communications, integration, comparison checks and recurring field service. Noise and particle channels have different service tasks. Request a site-specific scope rather than treating the price of a pole-mounted assembly as the complete cost of a city network.
A dashboard can combine observations and flag patterns, but source attribution needs a justified method and additional context. Wind direction, a concentration increase and a nearby activity are useful investigative inputs, not sufficient proof of causation by themselves.
Environmental monitoring for smart cities is useful when each channel retains its measurement meaning. NiuBoL air, noise, wind and water-level instruments can support a properly specified network. Select for the intended decision, verify local performance and keep raw observations, reported metrics and operational responses distinct.
Prev:Climate Stations for Government Agriculture Programs: Data Continuity
Next:Application of Soil Temperature and Moisture Sensors in Smart Irrigation
Related recommendations
Sensors & Weather Stations Catalog
 Agriculture Sensors and Weather Stations Catalog-NiuBoL.pdf
Weather Stations Catalog-NiuBoL.pdf
Agriculture Sensors Catalog-NiuBoL.pdf
Water Quality Sensor Catalog-NiuBoL.pdf
Related products
 Combined air temperature and relative humidity sensor
 TDR Soil Moisture & Temperature Sensor for irrigation| RS485 |4-20mA| NBL-S-THR
 Soil pH sensor RS485 soil Testing instrument soil ph meter for agriculture |NBL-S-PH
 Wind Speed sensor Output Modbus/RS485/Analog/0-5V/4-20mA
 Tipping bucket rain gauge for weather monitoring auto rainfall sensor RS485/Outdoor/stainless steel
 Pyranometer Solar Radiation Sensor 4-20mA/RS485


Screenshot, WhatsApp to identify the QR code
WhatsApp number:+8615367865107
(Click on WhatsApp to copy and add friends)

