





— Blogs —
—Products—
 Consumer hotline +8618073152920
WhatsApp:+8615367865107
Address:Room 102, District D, Houhu Industrial Park, Yuelu District, Changsha City, Hunan Province, China
Product knowledge
Time:2026-01-06 14:26:28 Popularity:954
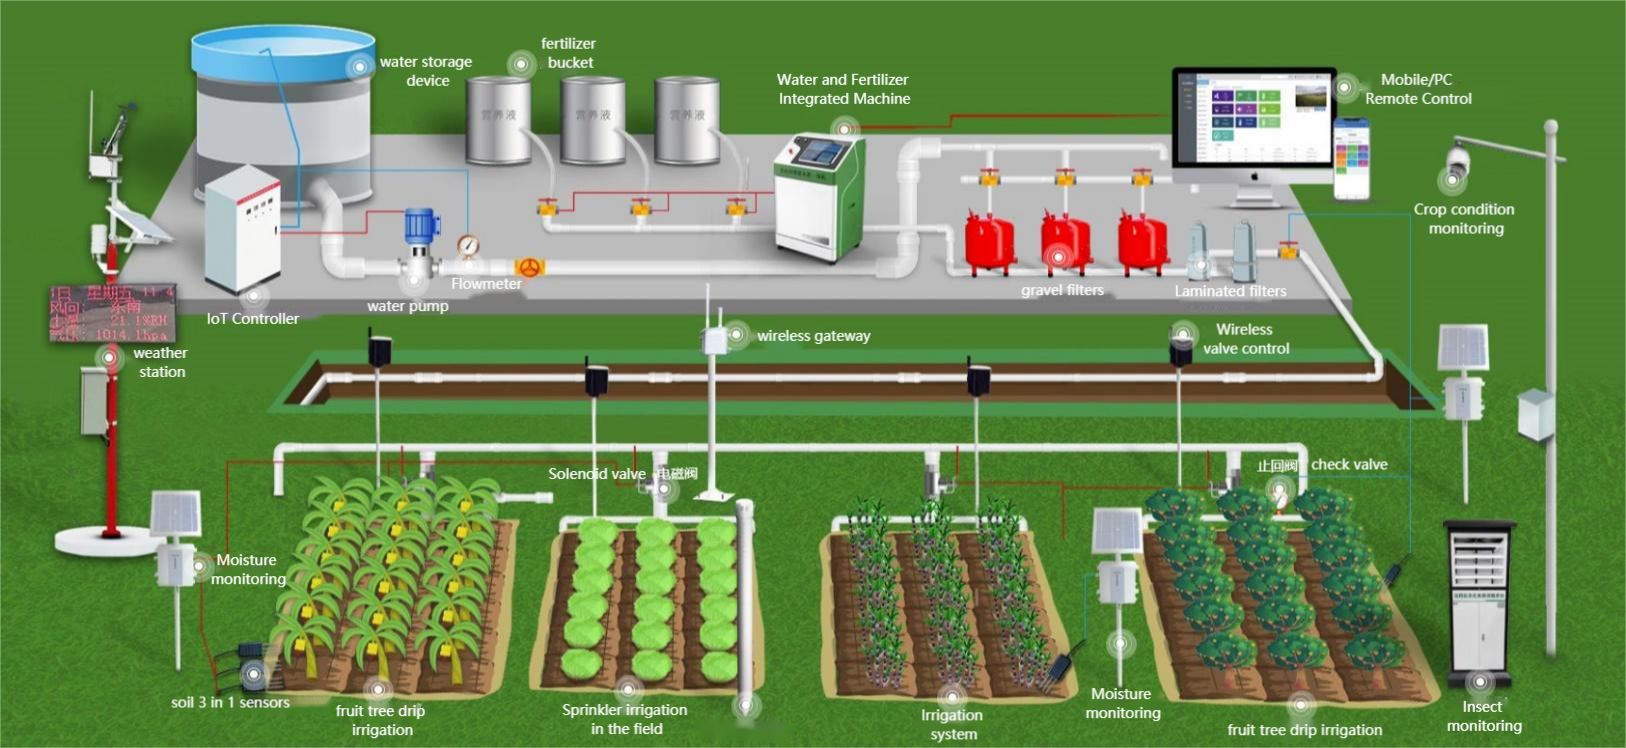
Fertigation monitoring should distinguish a programmed recipe from what reached each irrigation zone. A controller can report that a valve opened and an injector ran without proving either water delivery or fertilizer consumption. For a farm operator managing several blocks, the useful record combines measured water volume, measured stock-solution use, valve feedback and the identity of the treated area.
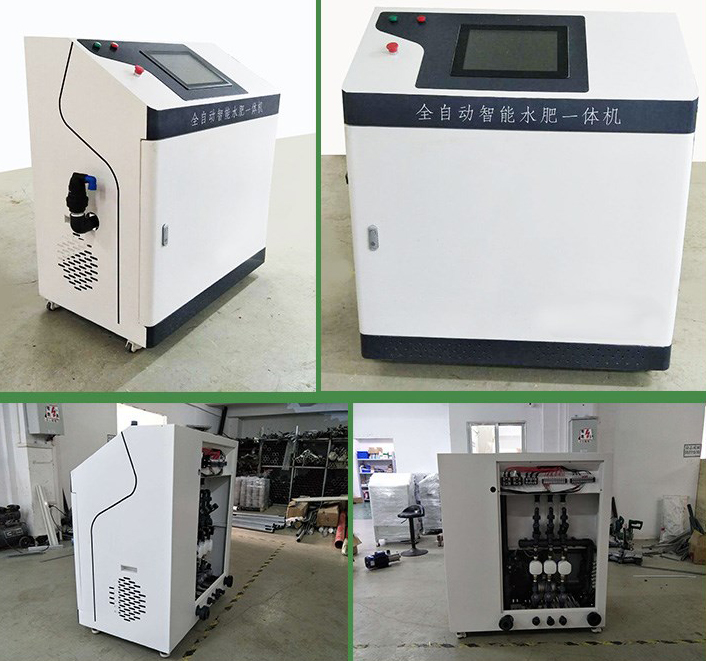
A daily total is useful for checking a farm's water use, but it hides incomplete or incorrectly assigned applications. Record each event with a zone identifier, start and stop times, water-meter totals, the selected recipe, the actual dosing period and any interruption. Preserve the difference between an operator request, a controller command and a field measurement.
For example, "Zone 4 requested 12 m3" is a target. "Valve output on for 40 minutes" is an action. "The zone meter increased by 10.8 m3" is a measurement. Those statements answer different questions. Combining them in one event shows that the target was not reached without pretending that a timer alone measured the delivered volume.
The application record also needs the stock tank and recipe revision. If a tank is refilled with a different concentration midway through a day, one daily injector total cannot be converted to nutrient mass using a single concentration. Split the dosing record at the refill or retain enough information to calculate the two periods separately.
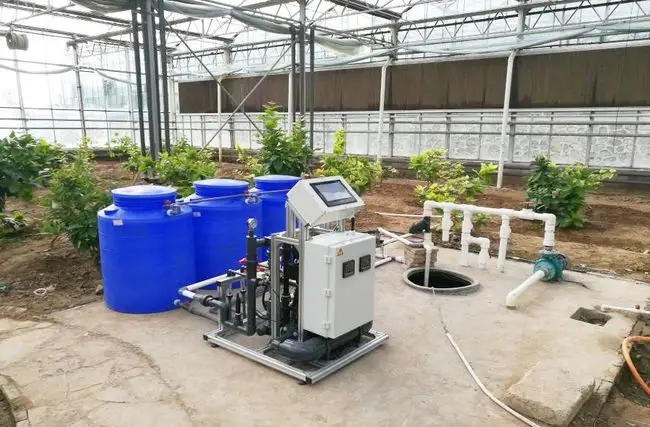
Dual-level metering places one measurement at the water source or headworks and additional measurements at relevant branches or zones. The source meter supports overall abstraction and pump-operation records. A zone meter supports allocation to a particular crop block. Neither automatically measures how uniformly individual emitters discharge.
Place meters where the hydraulic conditions suit the selected meter, including the required full pipe, flow direction and straight runs. Select the measurement range for the smallest operating zone as well as the largest combined demand. A meter sized only for the main pipe may provide poor information during a small-zone irrigation event.
| Recorded quantity | What it establishes | What it cannot establish alone |
|---|---|---|
| Source-meter volume | Total measured water passing the source measurement point | Allocation between overlapping zones |
| Zone-meter volume | Water entering that measured branch during the event | Uniform emitter delivery or root-zone storage |
| Valve command and position feedback | Requested action and, where instrumented, valve position | Actual flow through an obstructed or unpressurized line |
| Stock-solution consumption | Volume or mass removed from a stock supply | Nutrient mass without concentration and composition information |
| Soil moisture response | Local wetting and drying at the probe location | Total irrigation volume across the field |
Use the same time interval when reconciling source and zone totals. Account for filter backwashing, line flushing, tank filling and storage changes that lie between the meter locations. A source total of 120 m3 and zone totals adding to 112 m3 leave an 8 m3 difference, but that is not automatically an 8 m3 leak. If 5 m3 was measured during flushing, 3 m3 remains to investigate, subject to timing and meter uncertainty.
Soil probes provide a different check: did the event wet the monitored root zone, and how did that zone dry afterwards? A rising reading near an emitter does not prove that the whole block received enough water. Compare representative positions, soil layers and emitter locations before using the response to change the next application.
NiuBoL soil temperature and moisture probes can feed an irrigation data logger alongside the meter and valve records. Keep these measurements in separate fields. A moisture percentage should never be added to a water-meter total, and the logger should not convert a single local moisture change into field-wide cubic metres without a justified soil-volume model.
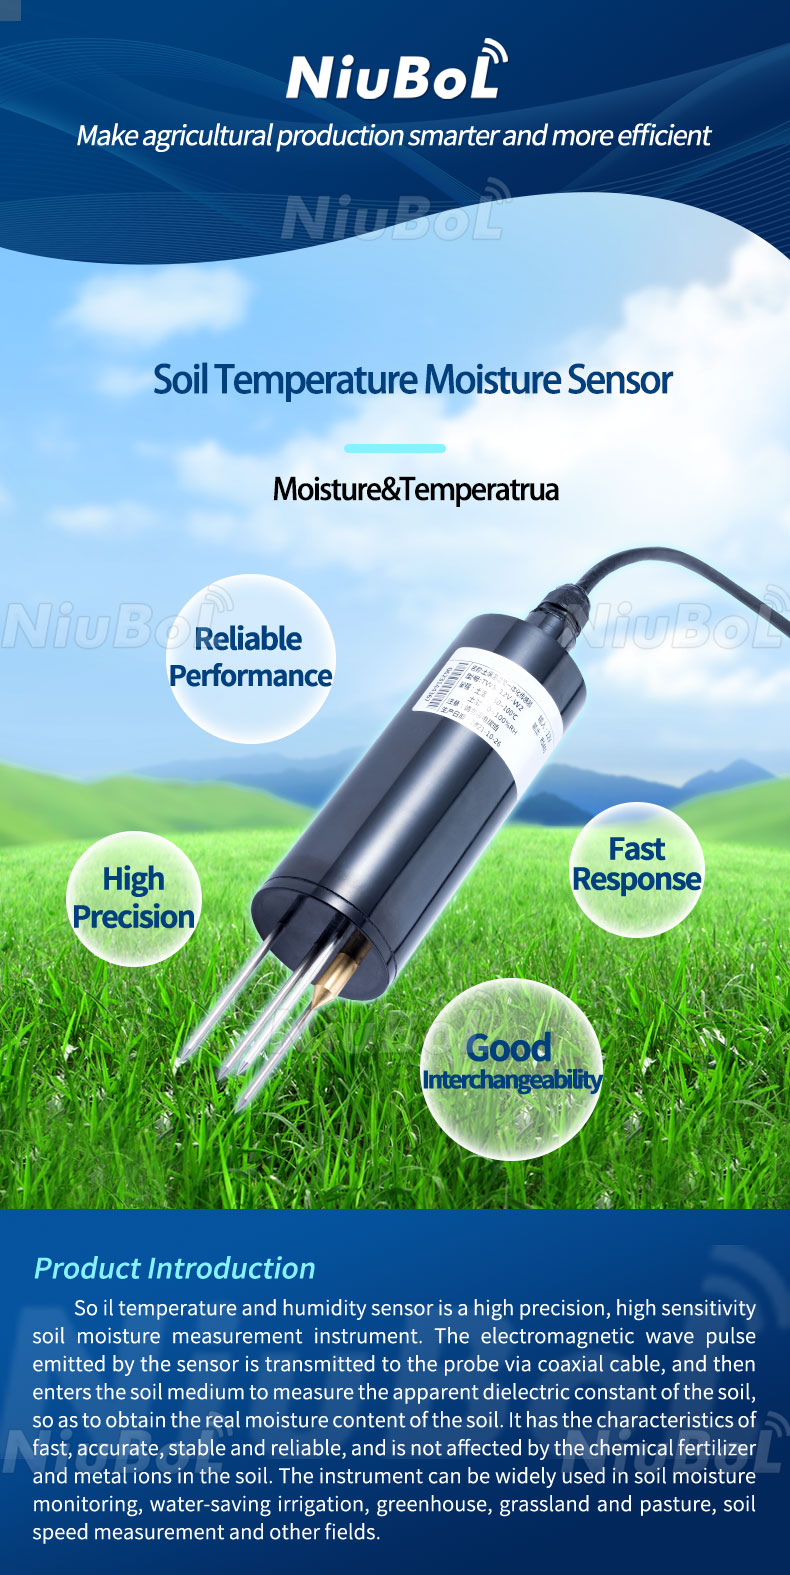
| NBL-S-THR parameter | Value | Relevance to fertigation monitoring |
|---|---|---|
| Soil moisture range and accuracy | 0-100%; +/-3% | Supports local wetting trends; verify suitability in the site's soil. |
| Soil temperature range and accuracy | -50 to 100 deg C; +/-0.5 deg C | Records the thermal conditions around the probe. |
| Resolution | 0.1% moisture; 0.1 deg C temperature | Do not confuse display increments with accuracy. |
| Supply and power | 12-24 V DC; approximately 0.3 W | Include probe load in the logger's field power calculation. |
| Output options | RS485, 4-20 mA or 0-5 V, according to configuration | Select the output for the actual logger input; these are not interchangeable terminals. |
| Operating temperature and enclosure protection | -40 to 80 deg C; IP68 | Operating limits differ from the temperature measurement range; protect cable joints separately. |
An injector runtime is not a reliable substitute for consumed stock volume when injection rate varies with pressure, settings or wear. Use a suitable measured volume or mass change and check for refilling, agitation effects, tank shape and measurement resolution. A large tank with a small dosing event may need a more sensitive method than a coarse level indication.
Keep the calculation's basis explicit. If 20 L of stock solution contains 100 g of fertilizer product per litre, measured consumption represents 2 kg of product. If that product contains 15% nitrogen by mass, the corresponding nitrogen input is 0.30 kg. This illustrative calculation does not describe a recommended recipe. For a liquid concentrate specified by mass fraction, convert volume to mass using its applicable density before calculating nutrient content.
Distinguish fertilizer product mass from nutrient mass and avoid mixing elemental phosphorus or potassium with oxide-based label conventions. Water electrical conductivity can help reveal a dosing change, but source-water salts and fertilizer composition affect the reading. EC alone cannot determine how many kilograms of each nutrient were delivered.
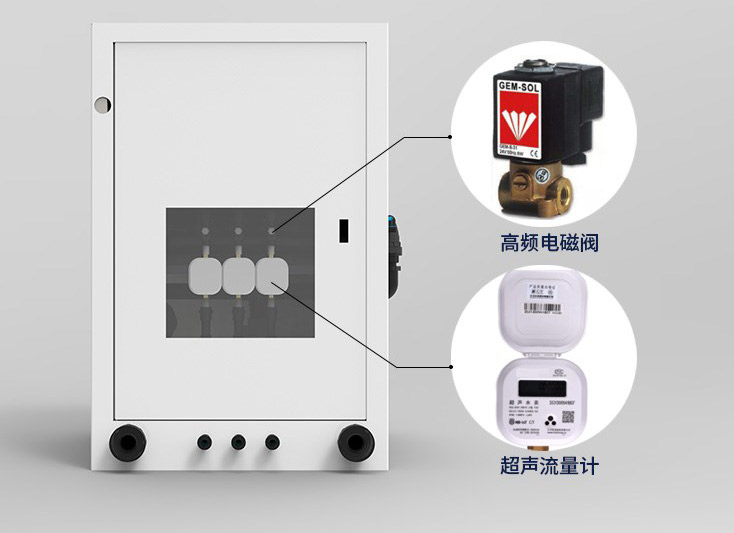
A practical event sequence checks water availability, opens the intended zone, establishes flow and pressure, then permits injection when the required hydraulic conditions exist. The event ends with the planned flushing stage. Exact delays and flushing volumes depend on the pipe network, injector and crop programme; they should not be copied from an unrelated installation.
During acceptance, deliberately test a closed supply, a valve that does not respond and a stopped injector under controlled conditions. Confirm that the record shows which condition prevented completion. Do not allow a failed flow input to turn a measured-volume event silently into a timed event while reporting the target volume as achieved.
Backflow protection and chemical-handling provisions must suit the installation and applicable requirements. Software interlocks supplement these physical provisions; they do not replace them. A remote operator should be able to see why injection is inhibited without bypassing the protection merely to make a dashboard status change.
Use cumulative meter values where available, together with timestamps and counter-reset information. If communication fails for ten minutes, the difference between two valid cumulative readings may still establish the total volume over that interval, but it cannot recover minute-by-minute flow or allocate the missing volume between simultaneously operating zones.
For RS485 Modbus RTU instruments, document address, register type, scaling, units and update interval. The IoT gateway's cloud protocol is a separate interface and must match the selected platform. Do not assume that every RS485 sensor publishes directly to a cloud service, or that a gateway supports every platform without configuration.
Local event storage can preserve records during a network outage if the selected logger supports it. Test a disconnect and reconnect: check that event identifiers are retained, timestamps remain interpretable and replayed records are not counted twice. Decide which local controls may continue offline and which remote requests must expire rather than execute late.
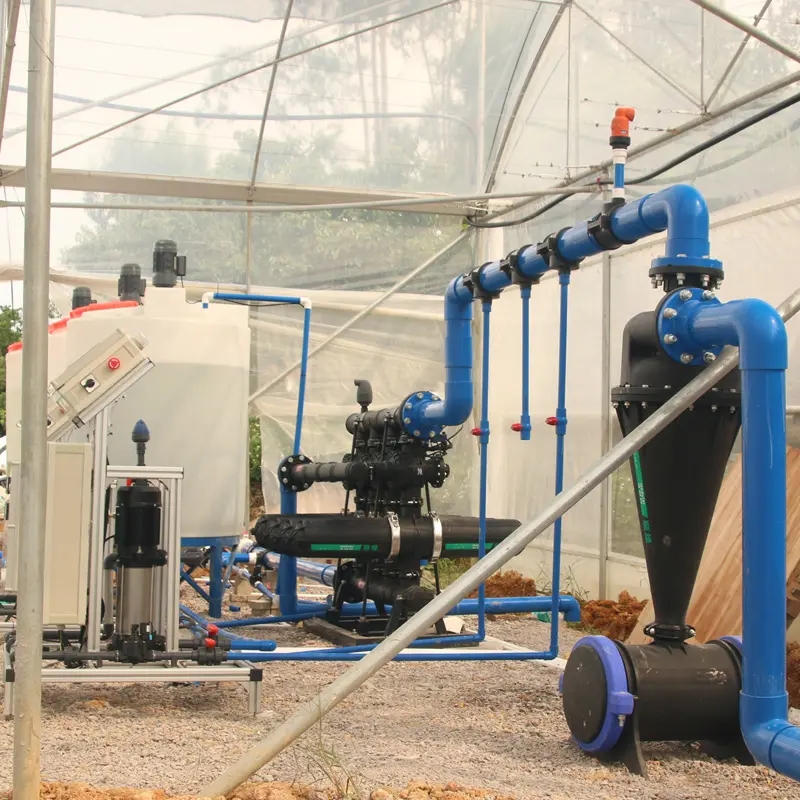
First run a measured water-only event and compare the starting and ending meter totals with the exported application record. Then check stock consumption during a controlled dosing test using the selected measurement method. Finally interrupt an event safely and confirm that the system records the actual partial application, not the original target.
For a retrofit, send NiuBoL the existing meter outputs, injector control interface, number of simultaneously active zones and soil monitoring requirements. These details determine whether the project needs added sensors, gateway integration or changes at the controller. Specify the required event export before choosing a dashboard: a display that cannot retain actual volumes and interruptions may be inadequate for farm management.
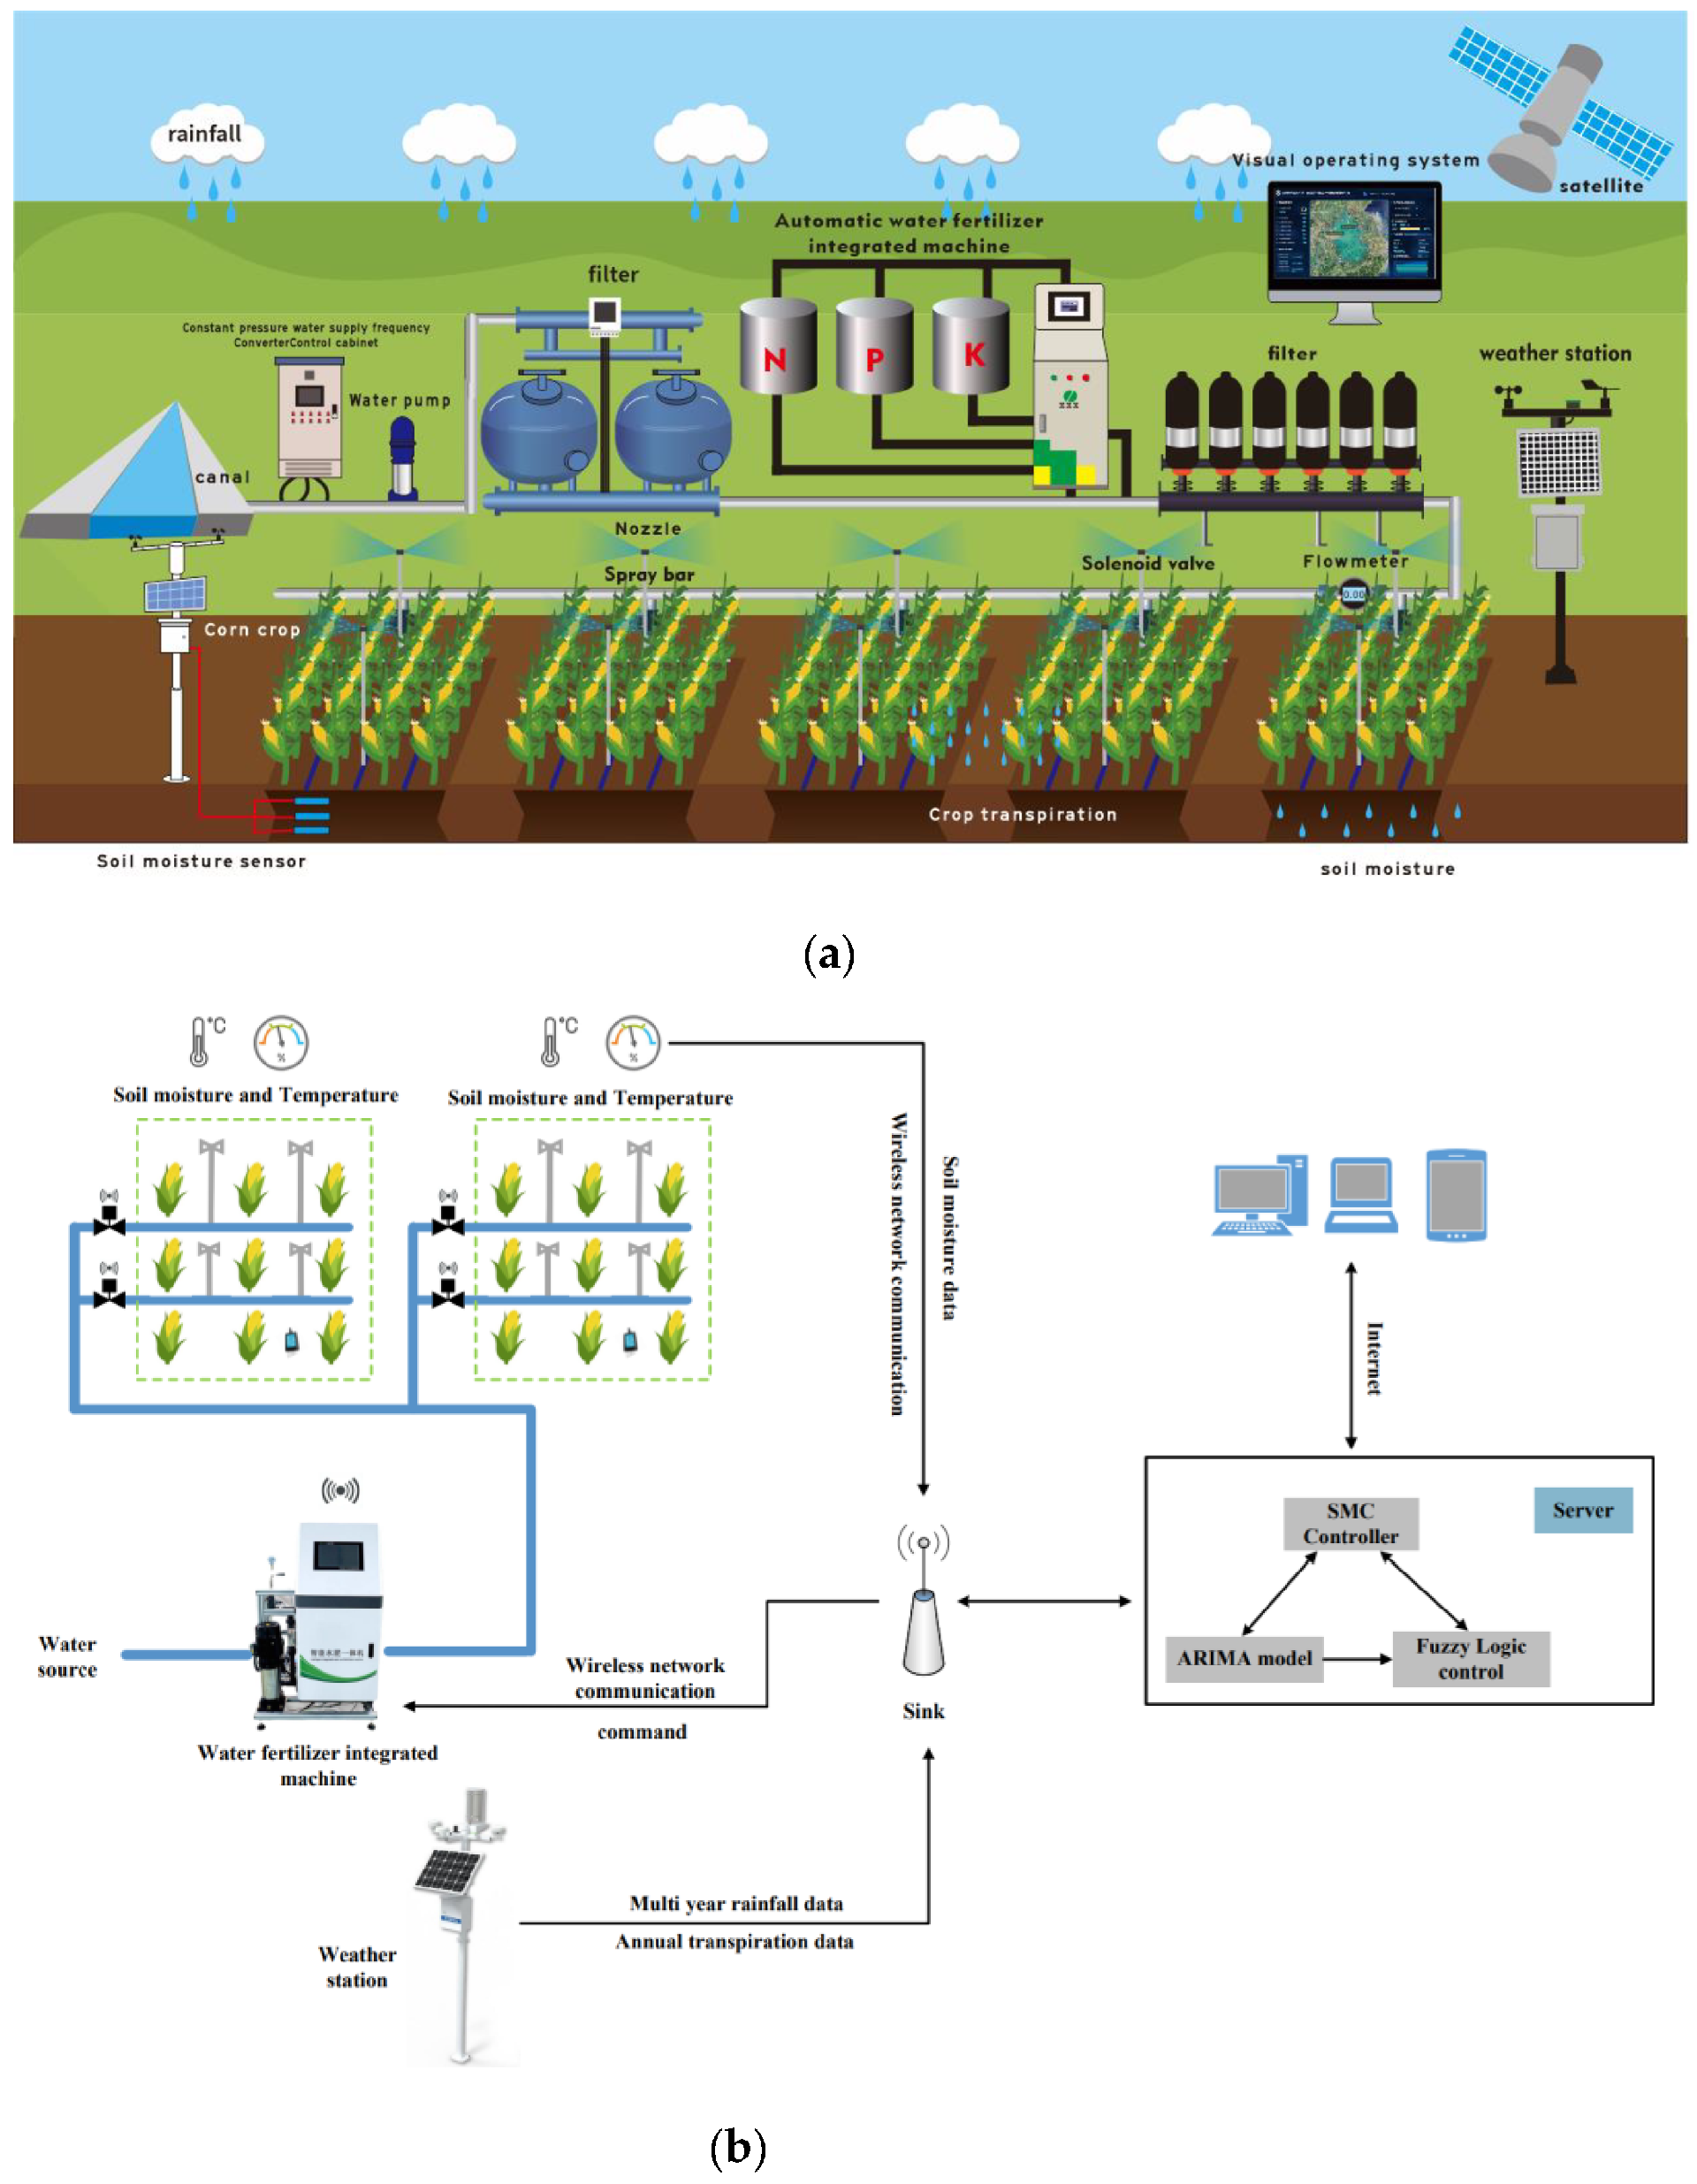
It may support event allocation when only one known zone operates at a time and other water uses are accounted for. With overlapping zones, a source total alone cannot determine each zone's volume. Add branch measurement where separate allocation is required.
No. EC reflects the combined conductivity of dissolved ions. Use it as a concentration-related process indicator with appropriate calibration, while calculating fertilizer consumption from measured stock use and its known composition.
Mark the measurement invalid and apply the agreed controller response. A zero value, missing value and stale value must remain distinguishable. Any fallback mode should be explicit and must not report an unmeasured target volume as delivered.
Start with the unresolved decision. Uncertain zone allocation calls for appropriate flow measurement; unknown stock use calls for consumption measurement; uncertain root-zone response calls for representative soil sensors. Adding every sensor is not a substitute for identifying the missing information.
No. Compare measured applications against a relevant baseline, considering crop area, weather, production stage and operating changes. Remote access can reduce travel and improve visibility, but a savings percentage requires actual operating evidence.
Separate field instruments, controller or gateway interfaces, installation, event-record functions and commissioning. Identify existing components that will be reused and the tests needed to establish that their outputs are suitable.
Fertigation monitoring becomes useful when it connects commands to measured water and stock-solution use for an identifiable zone. NiuBoL soil and environmental measurements can then explain the crop environment around that application. Keeping those roles distinct produces records that help an operator find incomplete events and compare treatments without mistaking a programmed recipe for a measured result.
Further reading: University of Maryland Extension irrigation system check-ups.
Prev:Ammonium ISE Commissioning: Calibration Points and Modbus Data Checks
Next:Agrometeorological Observation Types: Field Climate, Crop Environment and Water Use
Related recommendations
Sensors & Weather Stations Catalog
 Agriculture Sensors and Weather Stations Catalog-NiuBoL.pdf
Weather Stations Catalog-NiuBoL.pdf
Agriculture Sensors Catalog-NiuBoL.pdf
Water Quality Sensor Catalog-NiuBoL.pdf
Related products
 Combined air temperature and relative humidity sensor
 TDR Soil Moisture & Temperature Sensor for irrigation| RS485 |4-20mA| NBL-S-THR
 Soil pH sensor RS485 soil Testing instrument soil ph meter for agriculture |NBL-S-PH
 Wind Speed sensor Output Modbus/RS485/Analog/0-5V/4-20mA
 Tipping bucket rain gauge for weather monitoring auto rainfall sensor RS485/Outdoor/stainless steel
 Pyranometer Solar Radiation Sensor 4-20mA/RS485


Screenshot, WhatsApp to identify the QR code
WhatsApp number:+8615367865107
(Click on WhatsApp to copy and add friends)

