





— Blogs —
—Products—
 Consumer hotline +8618073152920
WhatsApp:+8615367865107
Address:Room 102, District D, Houhu Industrial Park, Yuelu District, Changsha City, Hunan Province, China
Product knowledge
Time:2025-04-09 11:00:20 Popularity:1844
Automatic weather station efficiency should be evaluated through usable observations and the work required to obtain them. Scheduled acquisition can reduce repeated manual readings, but it does not eliminate cleaning, exposure checks or data review. Before expanding a network, measure valid record coverage, delivery delay and operator time separately. A dashboard that updates frequently is not, by itself, evidence of accurate or complete weather data.
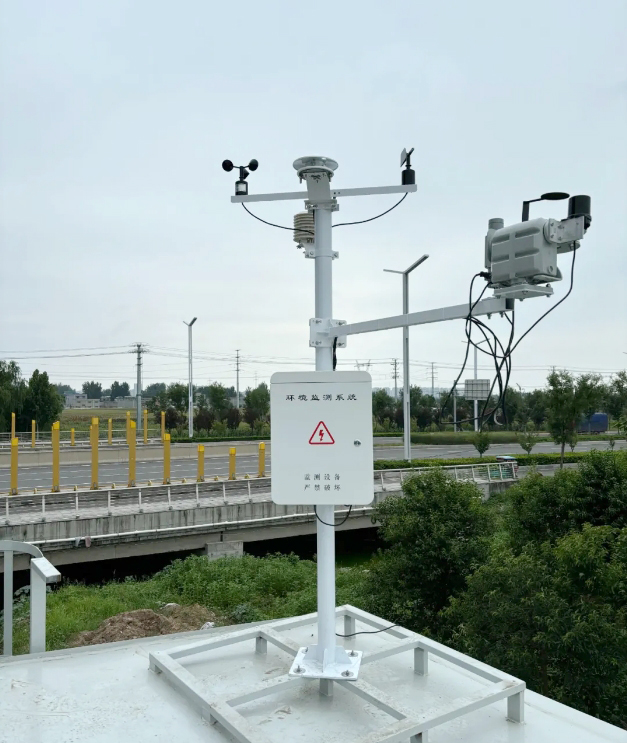
A meteorological team may spend time travelling to sites, reading instruments, entering results and correcting inconsistent files. Automation can address these tasks differently. A logger replaces repeated transcription only if its exports contain the units, timestamps and channel identities needed downstream. Remote access reduces a journey only when the required inspection can genuinely be completed remotely.
Identify the existing bottleneck before selecting additional sensors. If reports are delayed because rainfall totals are entered manually, a correctly configured rainfall input and scheduled export may matter more than an extra atmospheric channel. If staff repeatedly visit a station because the connection fails, adding measurement channels does not resolve the communications problem.
For NiuBoL station projects, a useful equipment request states the observations, recording interval, reporting destination and work currently performed by an operator. That makes it possible to compare the proposed acquisition chain with the actual job, rather than comparing two lists of instruments.
For a fixed one-minute recording schedule covering a full 24-hour day, the expected count is 1,440 records per channel. If the file contains 1,370 unique records that pass the project's validity checks, the valid record coverage is 1,370 / 1,440 × 100 = 95.1%. This is an illustrative calculation, not a measured performance result for a supplied station.
Define validity before the trial: correct channel, correct unit, credible timestamp, acceptable sensor status and no duplicated interval. A repeated old value with a fresh transmission timestamp must not automatically count as a new observation. Likewise, a blank field should not be converted into zero rainfall or zero wind speed merely to make the record complete.
| Evaluation measure | How to obtain it | What it does not prove |
|---|---|---|
| Valid record coverage | Unique acceptable records divided by expected scheduled records, per channel | Measurement accuracy or suitable sensor exposure |
| Delivery delay | Receiver arrival time minus observation time, using synchronized clocks | The sensor's physical response time |
| Operator workload | Logged time for readings, file handling, checks, cleaning and corrective visits | A guaranteed saving at another site |
| Recovery after interruption | Compare local and received records after a controlled connection outage | Unlimited offline storage or automatic recovery in every configuration |
A fast modem cannot make a slow physical measurement instantaneous. The NBL-W-HPRS thermopile pyranometer has a stated response time of no more than 35 seconds to 99% response. Polling it frequently can provide more samples, but those samples must not be described as independent instantaneous responses to every irradiance change.
Similarly, a logger may acquire an observation promptly while delivery to a remote server takes longer. Record observation time and receipt time separately. Check the clock source, time zone and behavior following power restoration before comparing delays across sites. A successful upload with an incorrect observation clock can produce misleading daily summaries.
Choose the reporting interval from the intended use. A maintenance report, daily agricultural summary and short-duration wind analysis do not necessarily require the same acquisition or aggregation settings. Specify whether an exported value is a sample, average, maximum or accumulated total; the interval alone does not answer that question.
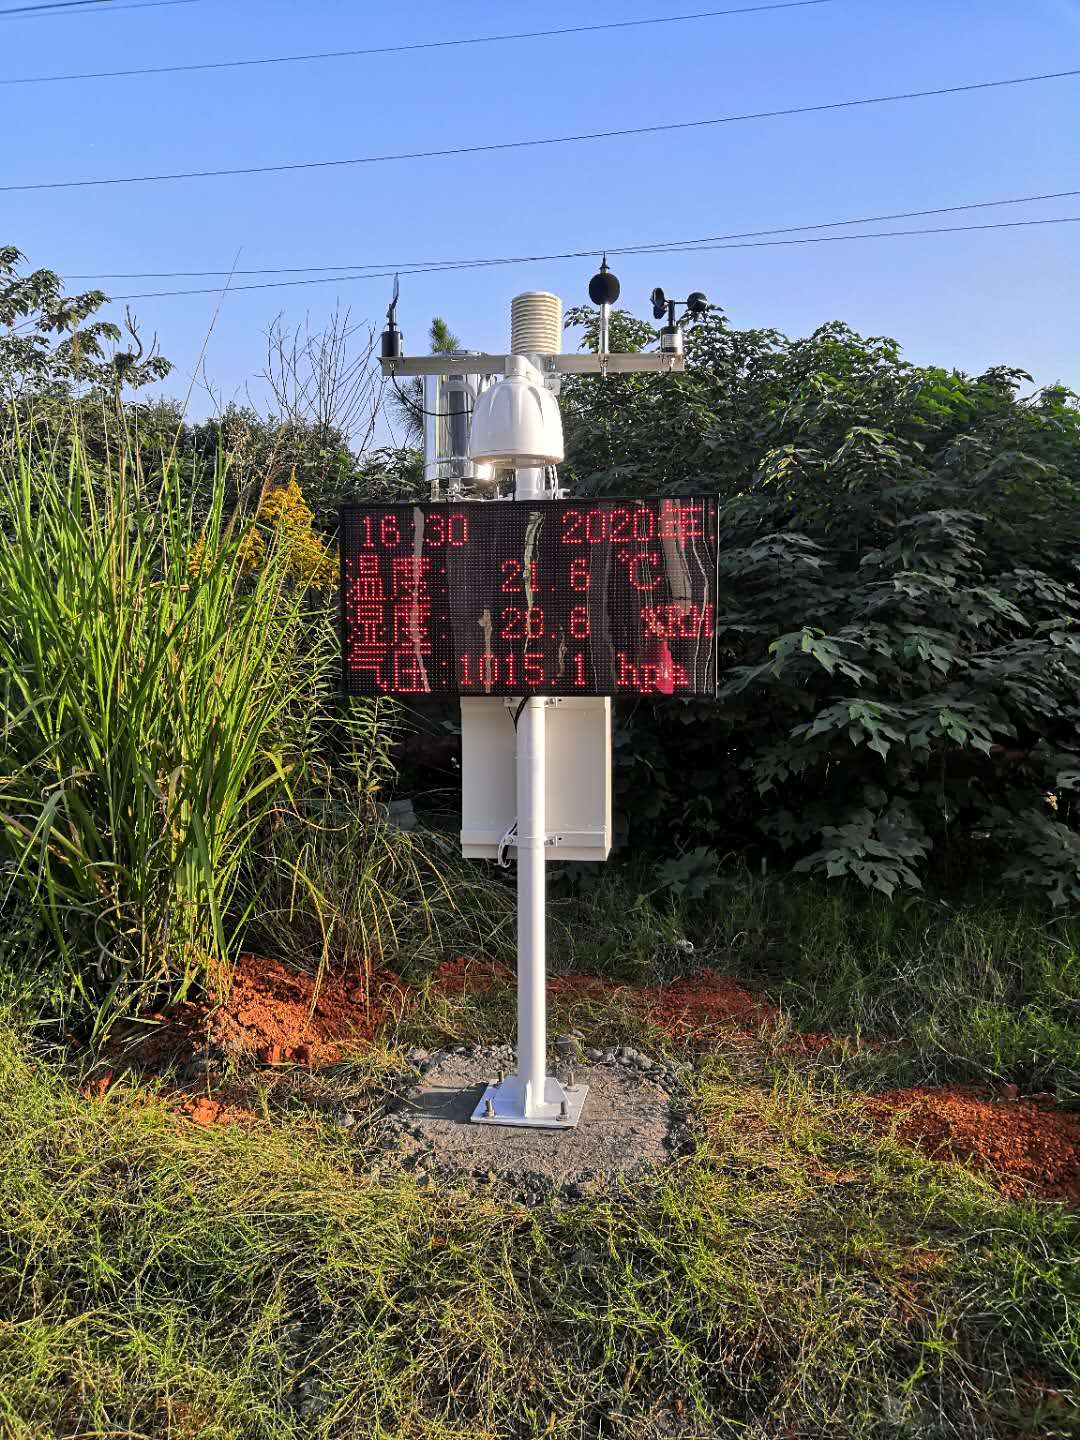
| Component | Selected specification | Operational consequence |
|---|---|---|
| NBL-W-LBTH | Air temperature -40°C to 80°C, ±0.5°C; humidity 0-100%RH, ±5%RH; DC 12-24 V; RS485 Modbus RTU version | Shield condition and exposure still matter; repeated acquisition is not automatic calibration. |
| NBL-W-SS | 0-45 m/s or 0-70 m/s version; IP65; selected RS485, analog or pulse output | Match the ordered output to the logger and retain access for mechanical inspection. |
| NBL-W-RS | 0.2 mm rainfall increment; 0-4 mm/min intensity range; operating temperature 0°C to 50°C | Funnel blockage and frozen precipitation are not resolved by more frequent uploads. |
| NBL-W-TG462 series logger | RS485 inputs; DC 5-35 V; IP30 logger enclosure | Use appropriate outdoor protection; agree storage, connection and export settings for the ordered version. |
These are component specifications, not a single accuracy or environmental rating for the assembled station. RS485 describes an electrical interface; compatible Modbus RTU settings and decoding are also required. During commissioning, compare a sensor value with its decoded logger channel, then with the exported record. This identifies an integration error before it becomes a recurring reporting task.
Keep the old workflow available for a defined comparison period. Record staff time under named tasks instead of estimating a percentage reduction from memory. Include setup, corrections, cleaning and fault investigation. A trial that excludes every maintenance visit cannot establish the likely workload of an unattended site.
Do not force a local station to match a distant reference by applying an unexplained offset. Differences in exposure, height and averaging period may be real. Investigate those differences before changing calibration. Automatic cross-comparison is useful for flagging a suspicious channel, but a flag is not a calibration procedure.
If acquisition is complete but exports require manual repair, improve field naming, file format or receiver mapping before buying more stations. If local records are sound but remote gaps remain, investigate network service, reconnection behavior and storage recovery. If staff time is dominated by blocked collectors, maintenance access and inspection intervals deserve attention.
Expansion is justified when the existing configuration delivers the required observations with an understood service workload. Send NiuBoL an example of the required export, sensor list, site power arrangement and receiving system when requesting a configuration. Price depends on those supplied functions; a generic station price does not identify whether the reporting bottleneck will be addressed.
A station's value is not simply the number of readings it produces. For a field program that currently sends staff to download loggers, record travel time, missed visits, manual transcription and the time needed to correct data. For a plant that already has remote telemetry, a new station may instead be justified by an unavailable measurement, a better exposure point or a reliable export path. These are different purchasing cases and should not share one generic savings claim.
Test one representative site before ordering a fleet. Define the period of observation, the number of usable records expected, the response to network interruption and the time needed to resolve one simulated fault. Include replacement sensor access and calibration documentation in the trial. If the pilot only demonstrates a dashboard, it does not prove that the customer's maintenance team can sustain the system.
The comparison sheet should include the hardware offer, installation and power work, communications charges, platform access, inspection effort and ownership of exported data. It should also say which old task disappears and which new task appears. Automatic collection can reduce visits, but it also creates new responsibilities for configuration, data quality and cybersecurity. A buyer can then decide whether efficiency comes from this configuration at this site, rather than from the word 'automatic' in the product name.
Only when the additional samples serve a defined analysis or operational need. They also increase data handling and may exceed the useful response rate of a sensor. Specify the required statistic and interval, then check the physical response and logger settings.
No. It repeats readings according to the configuration. Reference checks, exposure assessment and any justified calibration remain separate activities. Agreement between two displayed channels is not proof that both are accurate.
Demonstrate the ordered configuration during a controlled communications outage. Check local retention, reconnection, timestamp preservation and duplicate handling. Do not assume that having memory automatically provides backfilling to every receiving platform.
Use measured time for the existing and proposed workflows, including recurring maintenance and corrections. Apply the project's actual labor and travel costs if a financial comparison is required. No fixed percentage can be inferred from the sensor list.
Provide the required channels, recording and reporting intervals, acceptable data gaps, output format, receiving platform and site power and connection conditions. Include any existing instruments that must remain connected so the acquisition interfaces can be checked.
Measure the existing workflow: manual visits, data retrieval time, rejected records and time spent correcting bad timestamps or units. Compare the proposed station against those same tasks during a trial. Avoid a generic percentage saving if the project has not measured its own labor and data-quality baseline.
Only if it meets the required channels, access method and service conditions without hidden site work. Include installation, communications, power, calibration, replacement parts and data export in the comparison. A lower hardware quote can be outweighed by recurring field visits or a platform that the customer cannot integrate.
List the required channels and units, sampling and reporting intervals, data completeness rule, offline behavior and responsible party for faults. Observe the station over a representative operating period, not only during a short desk demonstration. The pilot is successful when the receiving workflow can use the records without manual repair.
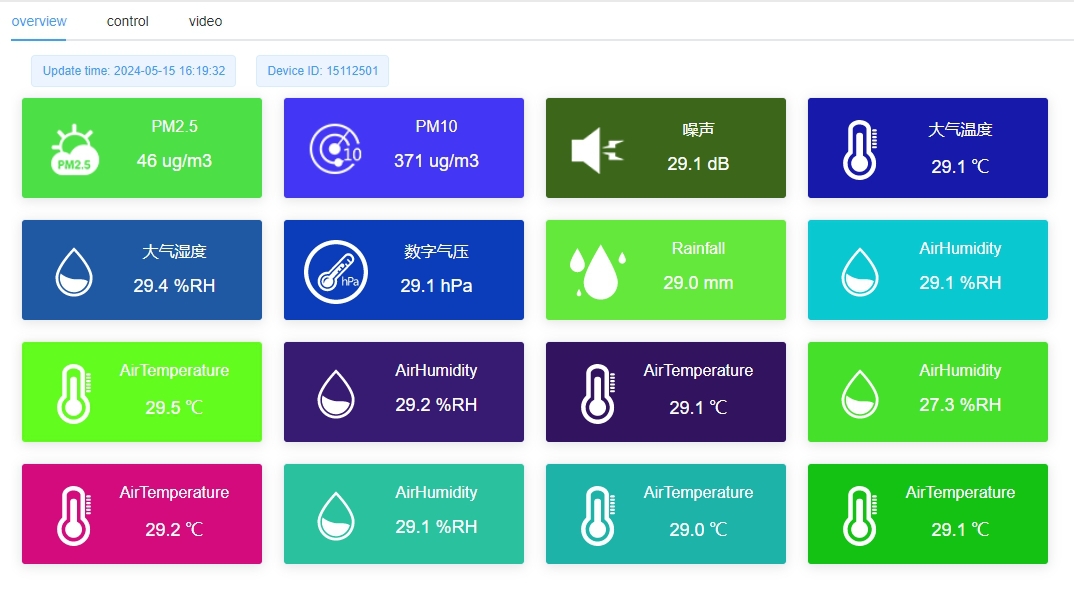
Automatic weather station efficiency is a workflow result: usable observations arrive when needed, with a measured and manageable service workload. Test record coverage, delay and operator effort separately. Correct the identified acquisition, reporting or maintenance constraint before multiplying the same configuration across a network.
Prev:Small Weather Station Site Constraints: When a Compact Layout Is Not Enough
Next:Automatic Weather Station Functions: What Works Without an Operator?
Related recommendations
Sensors & Weather Stations Catalog
 Agriculture Sensors and Weather Stations Catalog-NiuBoL.pdf
Weather Stations Catalog-NiuBoL.pdf
Agriculture Sensors Catalog-NiuBoL.pdf
Water Quality Sensor Catalog-NiuBoL.pdf
Related products
 Combined air temperature and relative humidity sensor
 TDR Soil Moisture & Temperature Sensor for irrigation| RS485 |4-20mA| NBL-S-THR
 Soil pH sensor RS485 soil Testing instrument soil ph meter for agriculture |NBL-S-PH
 Wind Speed sensor Output Modbus/RS485/Analog/0-5V/4-20mA
 Tipping bucket rain gauge for weather monitoring auto rainfall sensor RS485/Outdoor/stainless steel
 Pyranometer Solar Radiation Sensor 4-20mA/RS485


Screenshot, WhatsApp to identify the QR code
WhatsApp number:+8615367865107
(Click on WhatsApp to copy and add friends)

