





— Blogs —
—Products—
 Consumer hotline +8618073152920
WhatsApp:+8615367865107
Address:Room 102, District D, Houhu Industrial Park, Yuelu District, Changsha City, Hunan Province, China
Product knowledge
Time:2025-04-09 11:19:28 Popularity:1550
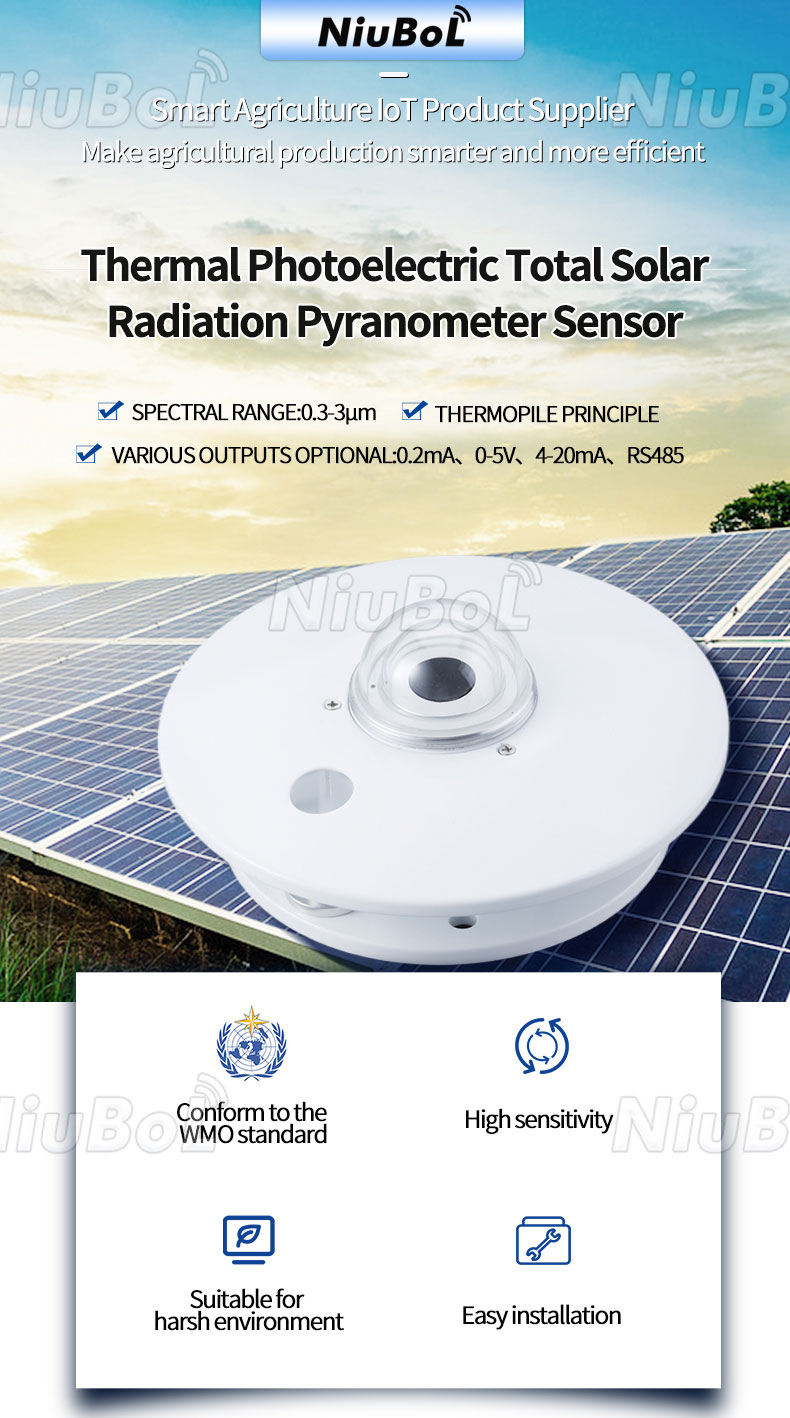
A PV pyranometer signal chain starts with a defined output, not merely a sensor name. The NiuBoL NBL-W-HPRS can be supplied with different electrical interfaces. A raw millivolt signal uses the individual sensitivity coefficient; a conditioned voltage or current output uses its specified transfer function; an RS485 version needs the correct digital interpretation. Applying the wrong conversion can produce a plausible-looking but incorrect irradiance record.
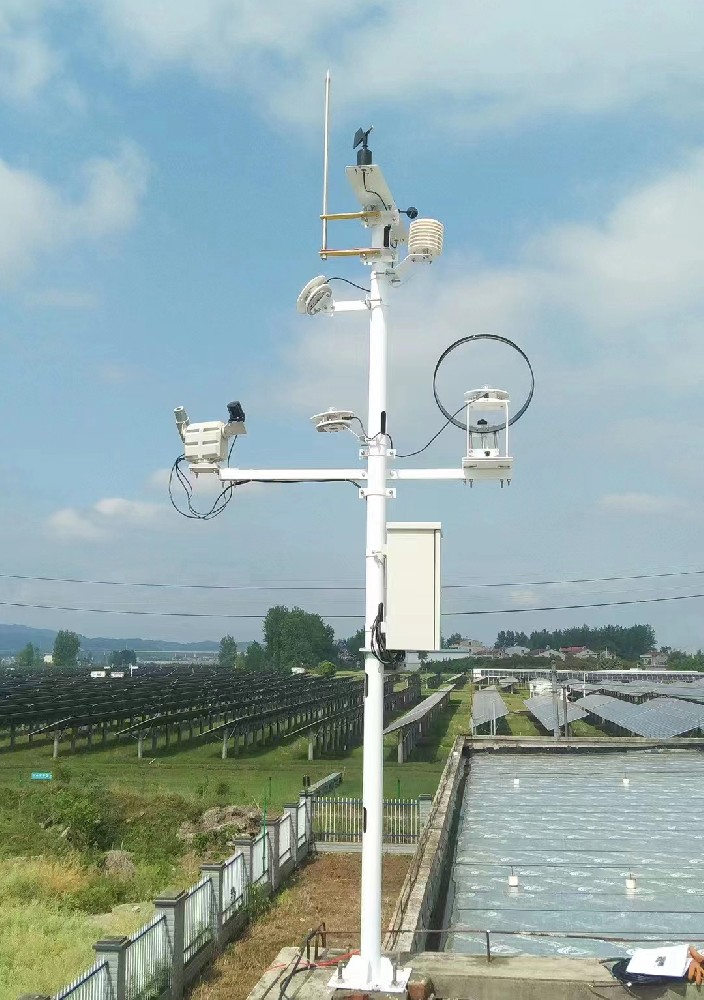
The thermopile develops a small electrical signal in response to irradiance. A raw-output configuration passes that signal to a suitable measuring input. A transmitter configuration conditions it into a selected current, voltage or digital signal. The logger then converts or decodes the input, assigns a timestamp and sends the observation to the receiving application.
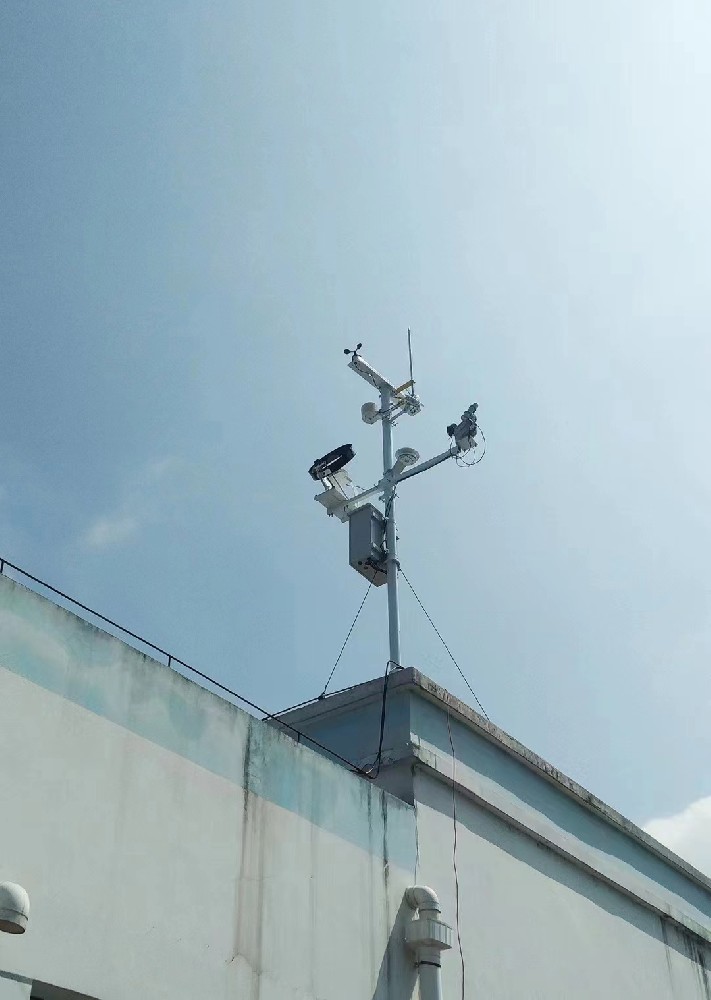
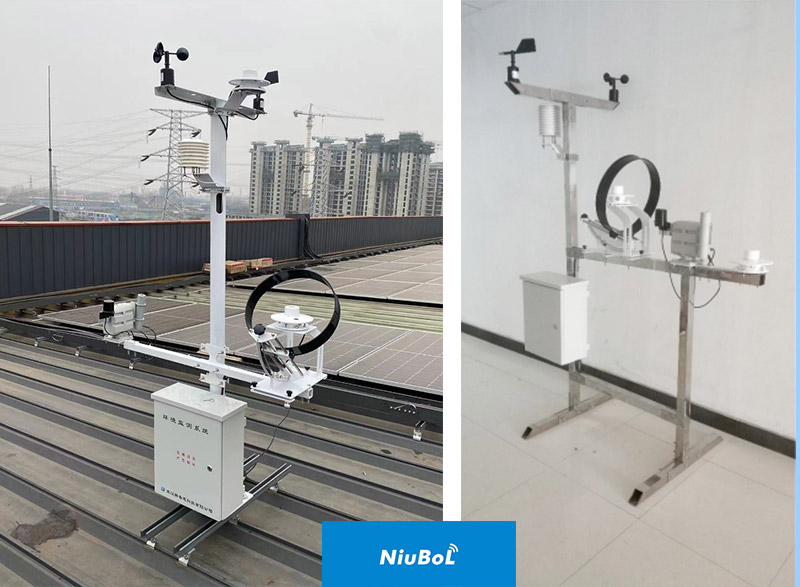
Those stages have different responsibilities. The mounting defines whether the pyranometer observes a horizontal plane or an inclined plane. The electrical configuration defines how the observation reaches the logger. The server label defines how operators interpret it. A working connection cannot correct a sensor mounted in the wrong plane, and a correctly mounted head cannot prevent an incorrect software multiplier.
The HPRS is a broadband irradiance instrument with a 0.3-3 µm spectral range. It does not separately return every radiation quantity mentioned in a station proposal. Diffuse or reflected measurements require the appropriate physical arrangement; a single ordinary head does not independently provide horizontal, inclined, direct and diffuse channels just because the logger has spare inputs.
For the raw signal, irradiance E can be calculated as E = V / S when voltage V and sensitivity S use matching units. If V is entered in mV and S in µV per W/m², the equivalent expression is E = 1000 × V / S. Keep the individual calibration coefficient with the sensor identification rather than using a nominal coefficient for every head.
For illustration, a head with S = 10 µV per W/m² and a measured 8 mV gives 800 W/m². This is a scaling example, not a customer reading or a coefficient assigned to all HPRS sensors. The specified sensitivity range of 7-14 µV per W/m² does not identify which coefficient belongs to a particular unit.
The receiving input must be suitable for that small signal. Do not assume that a general 0-5 V channel has adequate resolution and input characteristics for a raw thermopile. Verify the complete measurement input and expected signal range. A cable extension, junction or grounding change should be reviewed as part of this low-level signal path rather than treated as a purely mechanical alteration.
| Defined configuration | Conversion for the stated 0-2000 W/m² scale | Illustrative check |
|---|---|---|
| 0-5 V transmitter | E = V / 5 × 2000 | 2 V gives 800 W/m². |
| 4-20 mA transmitter | E = (I - 4) / 16 × 2000, with I in mA | 10.4 mA gives 800 W/m². |
| Raw millivolt output | E = 1000 × V / S, with V in mV | 8 mV gives 800 W/m² only when S is 10 µV per W/m². |
| RS485 version | Decode the supplied digital format and its engineering scale. | Compare the decoded value with the same channel at the logger and server. |
These voltage and current examples apply only to the defined transmitter ranges. Confirm the ordered version before entering the formula. The raw detector sensitivity must not be applied a second time to an already conditioned output. Conversely, a raw millivolt channel should not be given a 0-5 V transmitter formula merely because both are called voltage signals.
Check current units as well. A software input reporting 0.0104 A must be converted appropriately before using a formula expressed in mA. A current-loop input should also distinguish an abnormal electrical value from a valid low-irradiance observation, using the supported transmitter and input behavior rather than an assumed universal fault code.
| Item | Specification | Practical consequence |
|---|---|---|
| Irradiance range | 0-2000 W/m² | Keep the physical unit consistent through the measurement chain. |
| Spectral range | 0.3-3 µm | Not a set of independent UV, visible and long-wave channels. |
| Raw sensitivity | 7-14 µV per W/m² | Use the coefficient for the individual raw-output head. |
| Response time | ≤35 s to 99% | Serial polling speed does not determine the physical response. |
| Digital interface | RS485 Modbus RTU version; default 9600 bps | Confirm the supplied settings and register interpretation. |
| Digital communication interval | At least 1000 ms | Schedule polling accordingly. |
| Transmitter supply | DC 12 V or 24 V configurations | Match the selected interface and supplied wiring identification. |
| Operating temperature | -40°C to 50°C | Review the logger and field cabinet separately. |
Order the signal version together with the receiving equipment. The TG462-series data logger provides digital and analog interfaces, but each input still needs the appropriate configuration. A list of available analog channels is not proof that an unconditioned millivolt head can be connected directly with the required measurement quality.
For analog scaling tests, use an appropriate controlled electrical test with the sensor safely isolated where necessary. Mark simulated values so they are not retained as real sunlight observations. A signal-injection test verifies the receiving chain; it does not calibrate the pyranometer's optical response. Keep those two tests separate when defining acceptance.
A new raw-output head may have a different sensitivity coefficient. A replacement transmitter may have a different selected output. If a step appears after replacement, compare the old and new configurations before applying an offset to the historical series. A wrong multiplier should be corrected at its source rather than hidden by an unexplained database adjustment.
Keep the original signal definition, scale, sensor identification and replacement date in the service record. For an enquiry, provide the existing logger input type, cable route, required irradiance plane and whether the project needs a raw head or a transmitter. NiuBoL can then review a compatible HPRS configuration instead of quoting an electrically different version with the same general product name.
For a raw thermopile signal, the acquisition specification needs more than a terminal label. Put the individual sensor sensitivity from its document next to the input range, polarity, shield termination and engineering-unit formula in the logger record. The project should state whether the recorded value is a momentary irradiance measurement or a statistic over an interval. A trend can look smooth and plausible even when a copied sensitivity or unit conversion is wrong.
For a transmitter version, identify its selected output and configured span. The PLC's input scale must match that version; a current-loop card should not be configured from the voltage example in another manual. For RS485, check address, serial settings, register order and scaling using the exact ordered model. These are three different acquisition contracts for the same physical quantity. The term 'pyranometer' alone does not tell a systems engineer which one is arriving at the cabinet.
Keep a short commissioning record showing the sensor serial number, signal type, controller channel, displayed unit and one checked reading through to the final export. If the pyranometer is later replaced, repeat the conversion review before accepting the new data. That avoids a subtle discontinuity in a PV performance series being mistaken for a change in the array.
No. Raw millivolts, conditioned voltage and current outputs require different receiving-input arrangements and scaling. Confirm the ordered output and the actual input capability before connection.
No. It is the illustrative coefficient used here. The raw sensitivity range is 7-14 µV per W/m²; use the individual head's calibration coefficient for its raw signal conversion.
Not for its defined conditioned output. Use the transmitter's current-to-irradiance relationship. Applying the raw thermopile coefficient again would introduce a second, incorrect conversion.
No. It replaces analog conversion with digital interpretation. Confirm the supplied Modbus RTU settings, register format, scale and polling interval, then check that the server displays the same engineering value.
Compare output version, coefficient, input range, scaling and installation plane before assuming drift. Record the replacement event and correct any configuration error without silently modifying the earlier observations.
Keep the individual sensor sensitivity, input range, wiring polarity, conversion formula and the unit of the resulting irradiance channel with the logger configuration. A generic sensitivity copied from another pyranometer can produce a plausible but wrong number. Verify the entire channel against the supplied sensor document and record the configuration version at handover.
It can be useful when the existing controller has a suitable current or voltage input but no reliable low-level millivolt acquisition. The transmitter still needs its selected range, supply and scaling checked. It is not automatically preferable to RS485: the right choice follows the receiving hardware, cable route, diagnostics and maintenance plan.
Compare a documented input or reference reading with the logger value, platform value and exported record at the same time. Confirm the unit and whether the channel is instantaneous irradiance or an interval statistic. If the system applies an average, identify the interval rather than comparing it directly with a momentary reference.
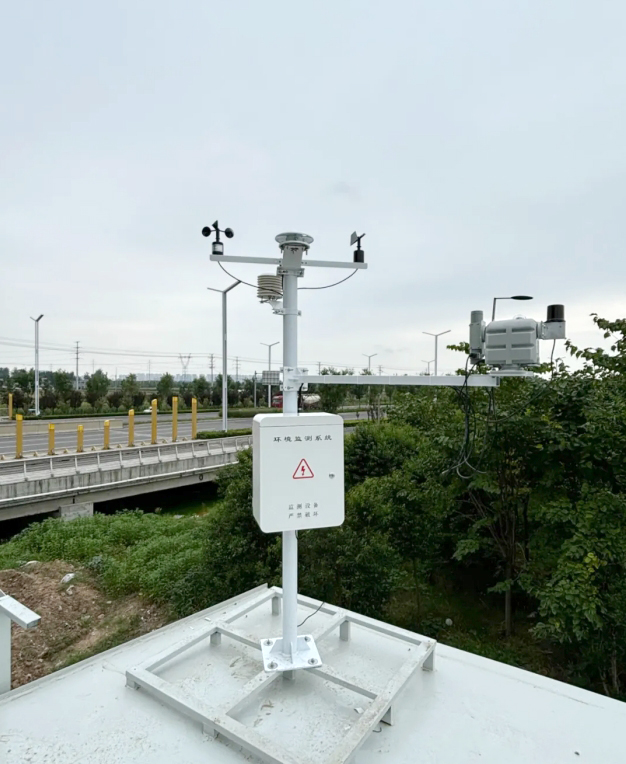
A reliable PV pyranometer signal chain uses one correct conversion for the ordered output and retains the measurement's physical meaning through the logger and server. For NBL-W-HPRS, distinguish raw sensitivity from transmitter scaling, verify the digital version where selected, and preserve the channel definition when equipment is replaced.
 NBL-W-SRS-Solar-radiation-sensor-instruction-manual-V4.0.pdf
NBL-W-HPRS-Solar-Radiation-Sensor-Instruction-Manual-V3.0.pdf
Prev:PV Temperature Correction: Avoid a Universal Power Loss Factor
Next:PV Weather Station Alarms: Weather Change or Sensor Fault?
Related recommendations
Sensors & Weather Stations Catalog
Agriculture Sensors and Weather Stations Catalog-NiuBoL.pdf
Weather Stations Catalog-NiuBoL.pdf
Agriculture Sensors Catalog-NiuBoL.pdf
Water Quality Sensor Catalog-NiuBoL.pdf
Related products
 Combined air temperature and relative humidity sensor
 TDR Soil Moisture & Temperature Sensor for irrigation| RS485 |4-20mA| NBL-S-THR
 Soil pH sensor RS485 soil Testing instrument soil ph meter for agriculture |NBL-S-PH
 Wind Speed sensor Output Modbus/RS485/Analog/0-5V/4-20mA
 Tipping bucket rain gauge for weather monitoring auto rainfall sensor RS485/Outdoor/stainless steel
 Pyranometer Solar Radiation Sensor 4-20mA/RS485


Screenshot, WhatsApp to identify the QR code
WhatsApp number:+8615367865107
(Click on WhatsApp to copy and add friends)

