





— Blogs —
—Products—
 Consumer hotline +8618073152920
WhatsApp:+8615367865107
Address:Room 102, District D, Houhu Industrial Park, Yuelu District, Changsha City, Hunan Province, China
Product knowledge
Time:2025-03-24 21:25:12 Popularity:1814
Small weather station data errors should be traced through exposure, the sensor output, the logger conversion and the displayed record before a sensor is replaced or a correction is applied. Start with a timestamped example of the discrepancy. A disagreement with a distant station is not, by itself, evidence of sensor drift.
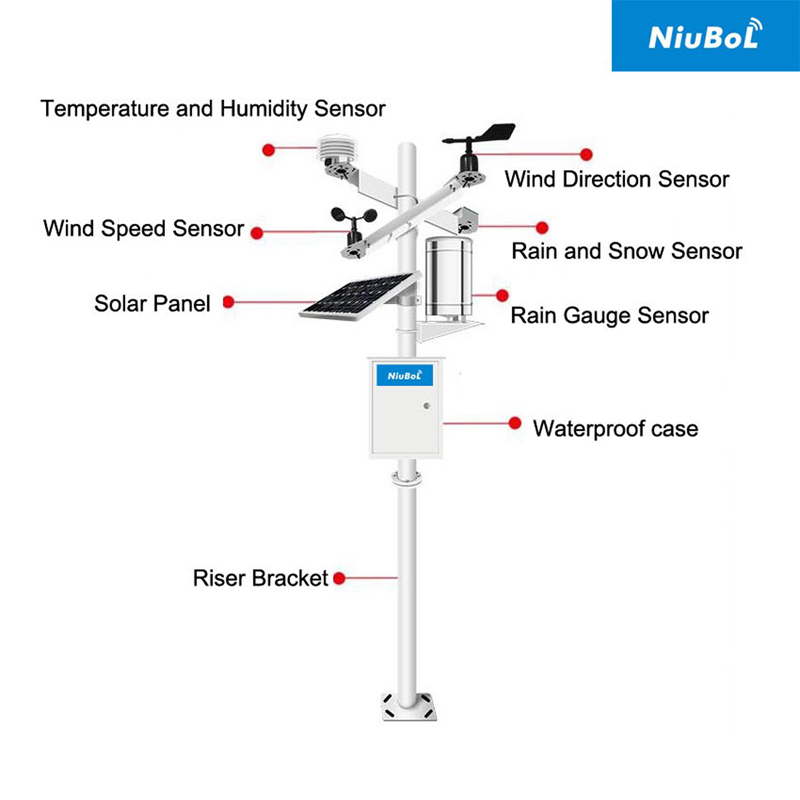
"The temperature is wrong" is not enough to choose a repair. Record which channel is affected, the expected and observed values, the comparison instrument, the time and the conditions. Identify whether the problem is a constant offset, a changing difference, a stale value, a missing event or a difference between the local and remote displays.
Those patterns point to different tests. A temperature difference concentrated in strong sunshine may warrant an exposure and shield inspection. A remote value frozen while the local reading changes suggests a data-path problem. A rainfall total that differs only across midnight may reflect different daily boundaries. Changing a calibration coefficient before separating these cases can introduce another error.
| Observed pattern | First comparison | Do not conclude yet |
|---|---|---|
| Air temperature diverges mostly in sunshine | Compare shield condition, ventilation, nearby heat and matching observation times. | That the sensing element needs a fixed offset |
| Wind direction differs by a similar angle | Check physical reference, software offset and how direction averages are formed. | That the vane has lost sensitivity |
| Rain total differs by a repeatable multiplier | Check bucket increment, pulse factor and whether both systems use the same units. | That the collector area or rainfall event must be wrong |
| Remote values stop changing | Compare a fresh local reading, logger record and server timestamp. | That unchanged weather proves the station is healthy |
| Several channels fail together | Check shared power, bus and logger status before individual replacements. | That several sensing elements failed independently |
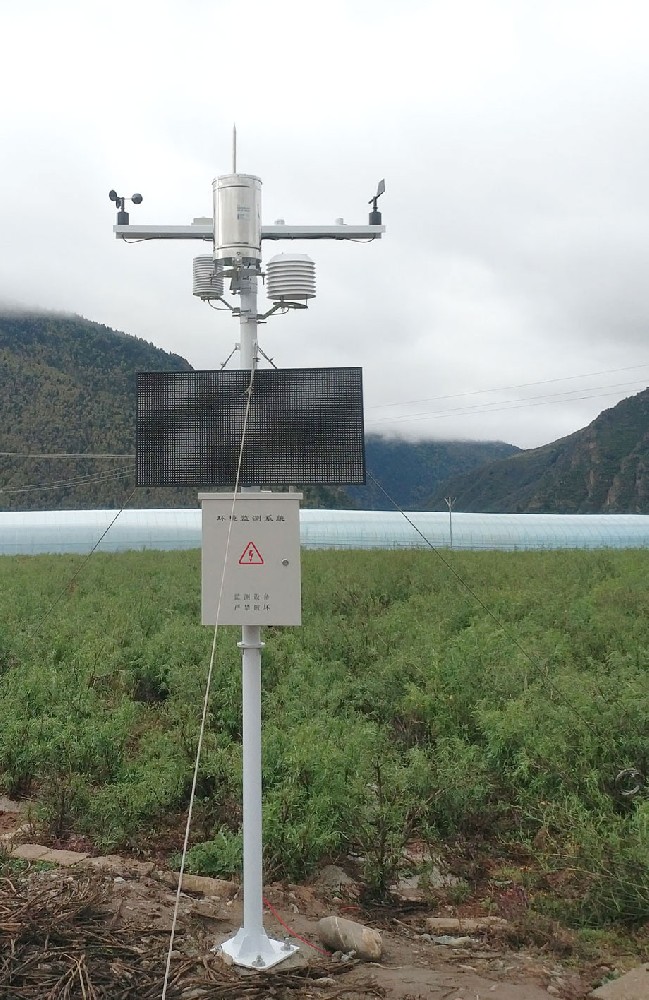
An indoor thermometer near a window is not a suitable field reference for a shielded outdoor air sensor. Nor should a rooftop wind measurement be expected to match an open-field sensor at another height. Bring the comparison as close as practicable to the same measurement conditions without letting the instruments shade, heat or obstruct each other. Record remaining differences.
Match the time treatment as well. An instantaneous screen value can differ legitimately from a ten-minute average. Comparing the maximum from one system with the mean from another is not an accuracy test. For air temperature and humidity, allow the instruments to respond to their surroundings before interpreting the difference; handling or moving them can create temporary offsets.
Use a comparison instrument with suitable calibration and uncertainty for the intended decision. Two unverified sensors agreeing does not prove that either is accurate. If the result is close to a contractual tolerance, use the agreed test procedure rather than judging the difference from a dashboard screenshot.
Suppose an air sensor reads 25.4 degrees C and a comparison instrument reads 25.0 degrees C at the same observation time. The indicated difference is +0.4 degrees C. That arithmetic alone cannot establish pass or fail. The comparison uncertainty, exposure and the project's decision rule still matter. It is an illustrative example, not an actual NiuBoL test record.
For a series of comparisons, retain the paired readings and conditions rather than only their average. A positive daytime difference and a negative nighttime difference can cancel numerically while indicating a real exposure problem. A single fixed correction would hide that pattern rather than resolve it.
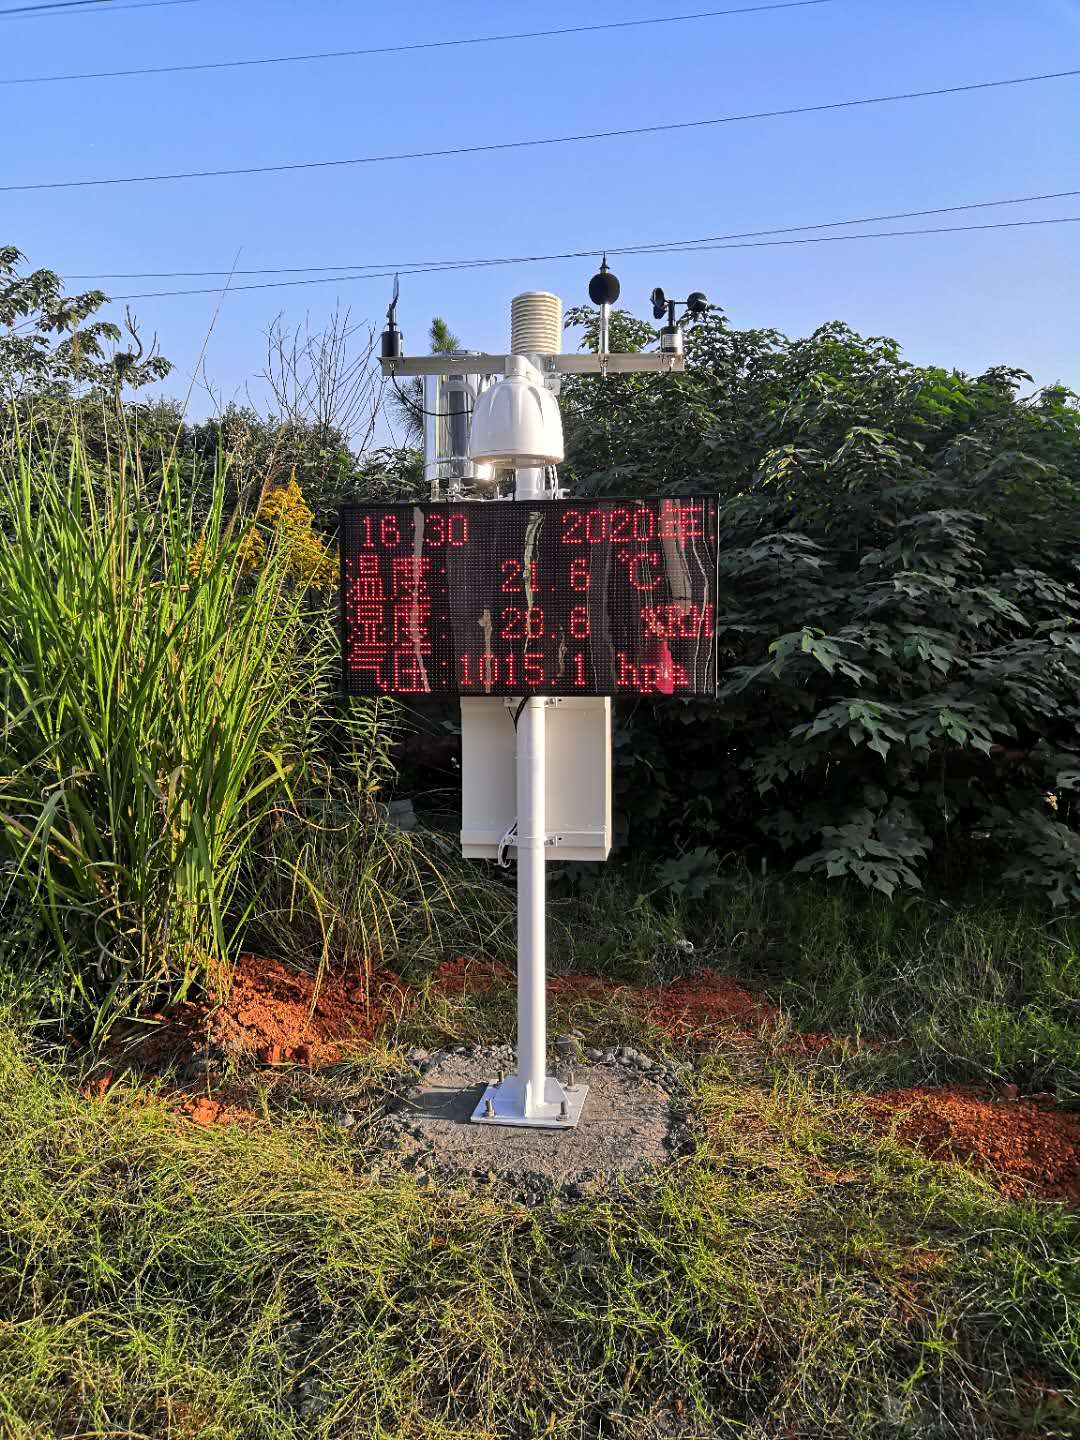
Read the electrical or digital output as close to the sensor as safely practicable, then compare what the logger records and what the application displays. For RS485 Modbus RTU, verify address, serial settings, register, signedness, multiplier and unit. A valid response with the wrong scaling is still a wrong measurement record.
For analog signals, confirm the selected output range and the receiver's conversion. A 4-20 mA loop should not be interpreted as 0-20 mA. A voltage measurement should use the supplied transmitter range rather than a default intended for another sensor. Check the voltage at the operating load if resets or simultaneous communication failures occur; an unloaded power-supply reading can miss a field problem.
The NBL-W-RS rain gauge has a 0.2 mm increment. For that configuration, 25 valid tips represent 5.0 mm. A logger set to 0.1 mm per tip would record 2.5 mm even with correct counting. This example checks the conversion only: it does not test whether the gauge caught all the rain or remained accurate at the event intensity.
| Component parameter | Value | How to use it in diagnosis |
|---|---|---|
| NBL-W-LBTH air temperature | -40 to +80 degrees C; accuracy +/-0.5 degrees C | Separate sensor specification from installation and comparison uncertainty. |
| NBL-W-LBTH relative humidity | 0-100% RH; accuracy +/-5% RH | Check the reference and exposure before treating a small difference as a fault. |
| NBL-W-RS rain increment | 0.2 mm | Verify pulse-to-rain conversion; resolution is not rainfall accuracy. |
| NBL-W-RS accuracy condition | +/-4% in an indoor static test at 2 mm/min | Do not use this as a universal field-event tolerance. |
A documented unit conversion or an identified logger scale error can justify reprocessing affected records. Record the original factor, corrected factor, affected dates and the reason for the change. Keep the original export available. Do not silently overwrite historical values merely to make a graph agree with another station.
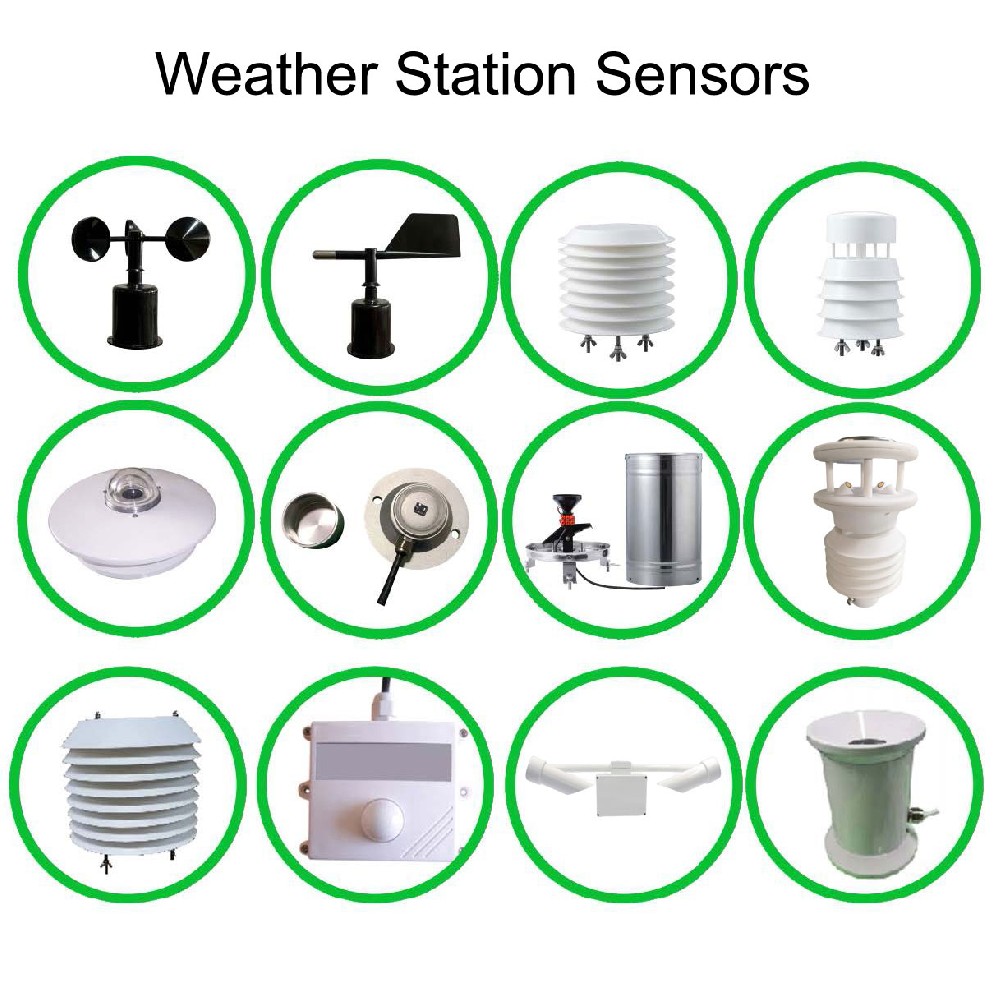
Suspected drift needs a suitable verification or calibration procedure. Relocating a sensor, cleaning an obstruction and replacing an instrument are different actions and should remain distinguishable. For replacement of NBL-W-SS wind sensors or a separate direction sensor, check the interface and mechanical exposure as well as the IP65 protection requirement.
After repair, repeat the test that reproduced the fault and observe the channel through relevant conditions. A single good reading does not show that a sunshine-dependent error, intermittent restart or midnight aggregation problem has been resolved. Define the observation period around the fault, not around a convenient fixed duration.

No. Nearby stations can observe genuinely different conditions. Identify whether the difference comes from exposure, timing, conversion or calibration before applying a documented correction.
No. Communication can succeed while the application reads the wrong register or applies the wrong scale. Compare the decoded value and units at the sensor, logger and final application.
Usually not. First check collector condition, level, pulse conversion, time boundaries and event intensity. A controlled functional test can isolate counting faults, but full accuracy assessment requires a suitable test method.
Use calibration when the suspected change concerns measurement response and the required accuracy cannot be established by the field comparison. Do not adjust a sensor to compensate for unsuitable exposure or uncertain reference readings.
Send model and output details, timestamped paired readings, raw or local values if available, logger settings, installation photographs and recent changes. This helps NiuBoL distinguish an instrument problem from wiring, scaling or exposure before proposing parts or service.
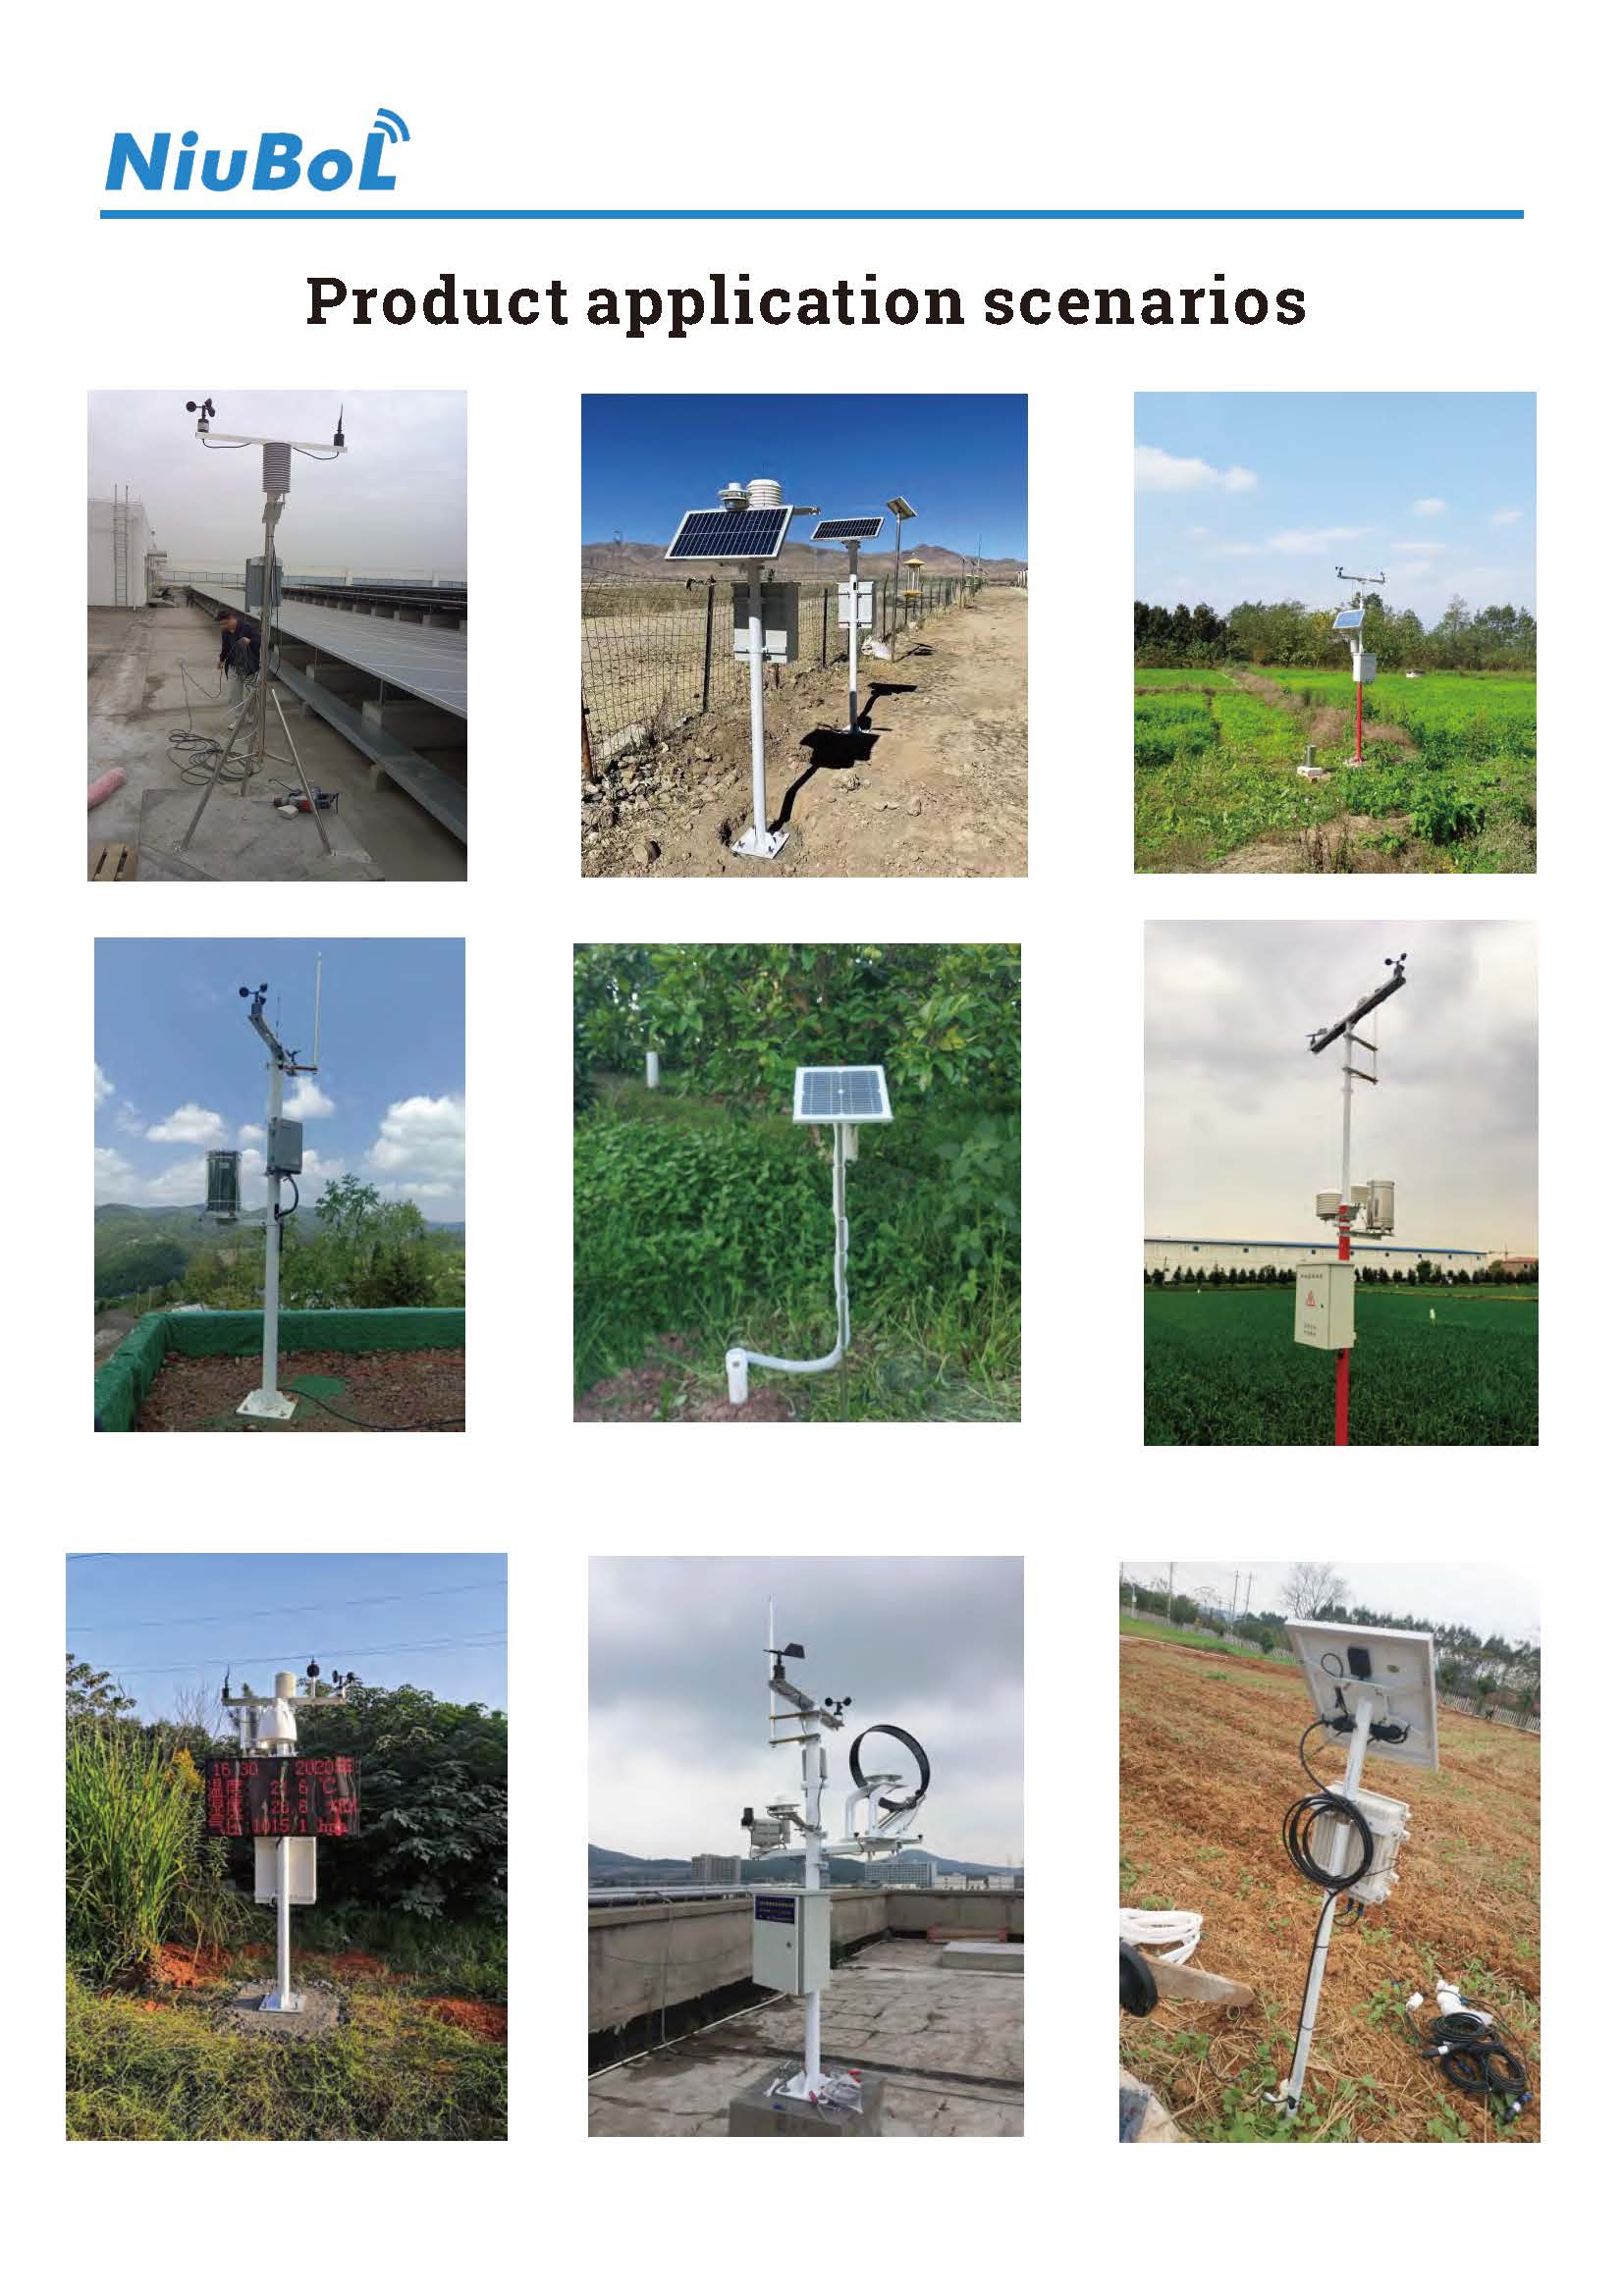
Small weather station data errors are easier to resolve when the discrepancy is reproducible and the measurement chain is visible. Test the comparison conditions, conversion and data path before replacing hardware. Keep original records and documented corrections so the repair improves the usefulness of the data rather than just the appearance of a graph.
Prev:Small Weather Station Components: What a Complete Supply Includes
Next:Solar Radiation Monitoring Station: Define Each Measurement Channel
Related recommendations
Sensors & Weather Stations Catalog
 Agriculture Sensors and Weather Stations Catalog-NiuBoL.pdf
Weather Stations Catalog-NiuBoL.pdf
Agriculture Sensors Catalog-NiuBoL.pdf
Water Quality Sensor Catalog-NiuBoL.pdf
Related products
 Combined air temperature and relative humidity sensor
 TDR Soil Moisture & Temperature Sensor for irrigation| RS485 |4-20mA| NBL-S-THR
 Soil pH sensor RS485 soil Testing instrument soil ph meter for agriculture |NBL-S-PH
 Wind Speed sensor Output Modbus/RS485/Analog/0-5V/4-20mA
 Tipping bucket rain gauge for weather monitoring auto rainfall sensor RS485/Outdoor/stainless steel
 Pyranometer Solar Radiation Sensor 4-20mA/RS485


Screenshot, WhatsApp to identify the QR code
WhatsApp number:+8615367865107
(Click on WhatsApp to copy and add friends)

