





— Blogs —
—Products—
 Consumer hotline +8618073152920
WhatsApp:+8615367865107
Address:Room 102, District D, Houhu Industrial Park, Yuelu District, Changsha City, Hunan Province, China
Product knowledge
Time:2024-11-02 16:24:42 Popularity:1828
A smart weather station dashboard should show which instrument and location each value represents, its unit, observation time and current data status. A station-online indicator does not prove every channel is updating. Before accepting the dashboard, trace representative readings into the displayed fields and check how missing, delayed and calculated values are identified.
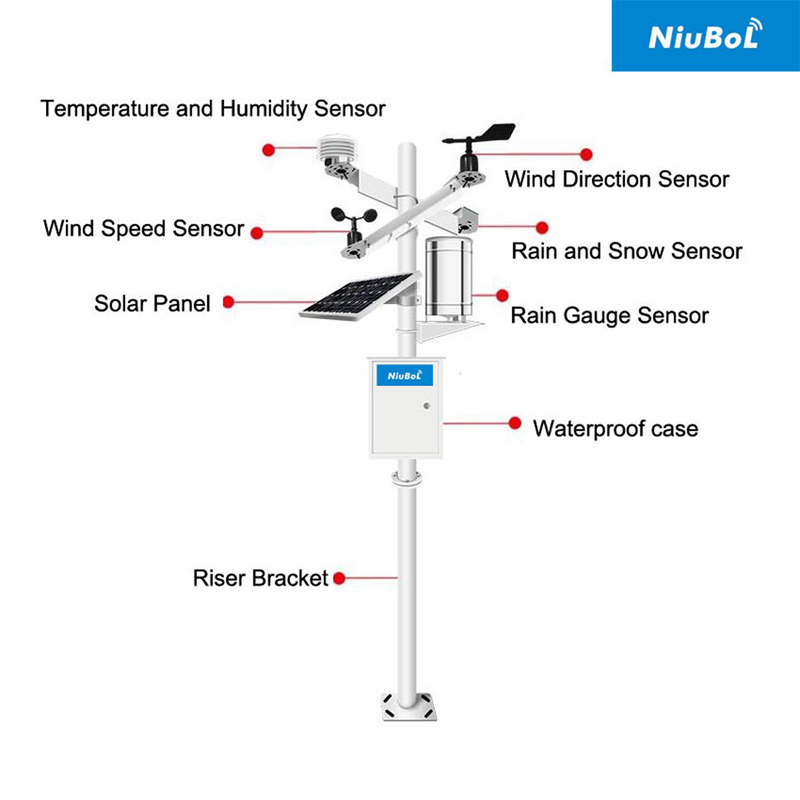
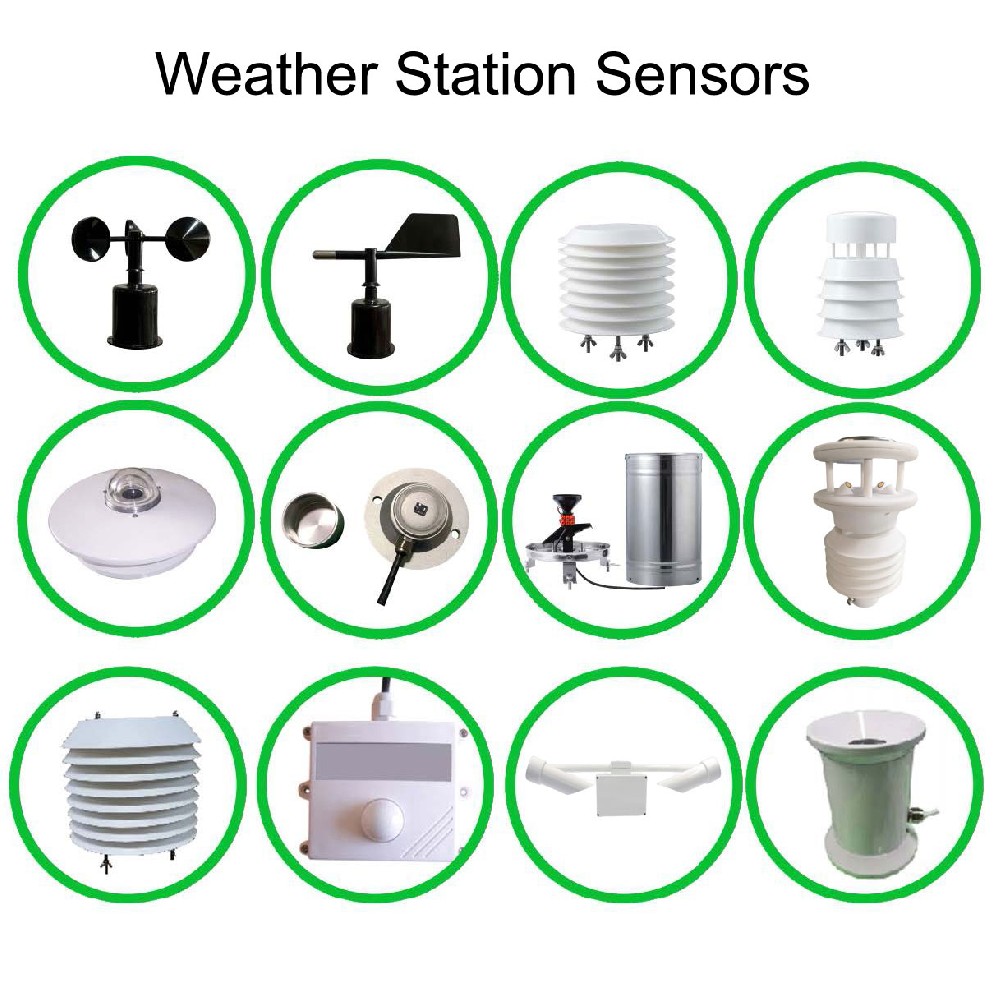
A weather station can combine wind, air temperature, humidity, pressure, rainfall and optional soil or radiation measurements. The dashboard should represent the actual ordered configuration. Empty positions in a generic template are not installed sensors, and several temperature tiles may belong to different locations rather than duplicate observations of outdoor air.
Give every field a physical meaning: site, instrument, quantity and, where relevant, height or depth. For example, an outdoor air-temperature channel and soil temperature at a specified depth need different names. A screen labelled only temperature makes records harder to interpret when the station is expanded or a sensor is replaced.
| Field | What the operator needs | Check during commissioning |
|---|---|---|
| Channel identity | Site, quantity and measurement position | Match the tile and export to the fitted instrument. |
| Value and unit | A decoded engineering value | Check scaling and unit labels against the instrument definition. |
| Observation time | When the measurement was taken | Distinguish sampling from upload or screen-refresh time. |
| Validity or freshness | Whether the value remains usable as current data | Check a disconnected channel without assuming a particular display behaviour. |
| Statistic or period | Current, average, maximum, increment or cumulative value | Compare the same statistic over the same interval. |
| Data origin | Measured, calculated or imported information | Identify calculations and external services separately. |
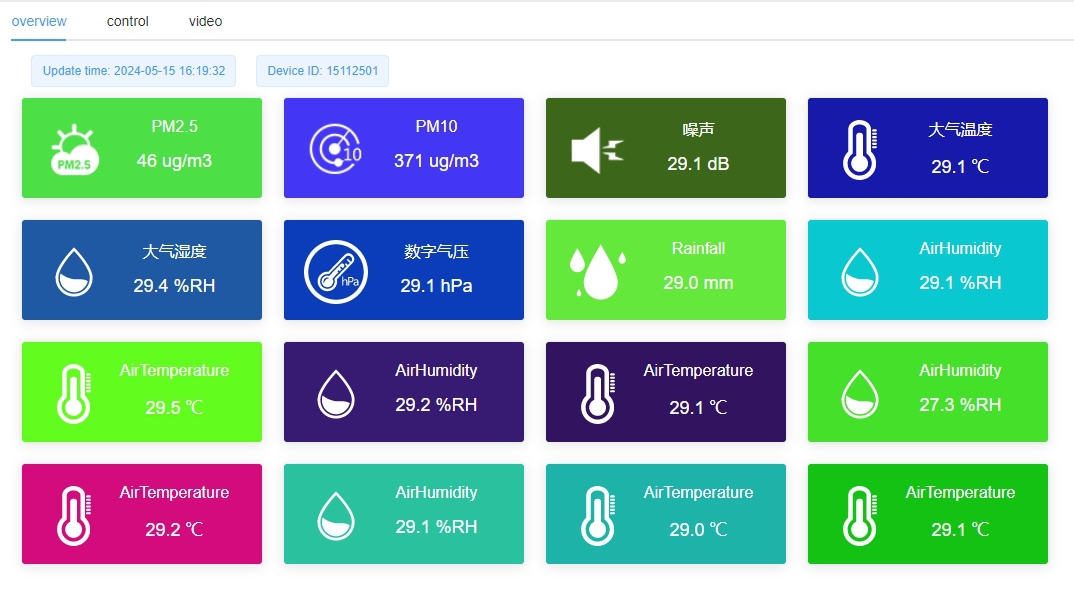
The screen illustration below shows the type of multi-channel presentation used in environmental monitoring. Its tile count is not a specification for every station. The configured interface must identify the project's actual channels rather than relying on repeated default labels or the position of a coloured tile.
NBL-W-LBTH provides air temperature, relative humidity and barometric pressure. Those quantities need separate fields and units. The selected digital version supports RS485 Modbus RTU; the receiving device must use its model-specific interpretation. A connection to the station does not establish that an application has decoded every field correctly.
Rainfall requires a period definition as well as a unit. An accumulated amount, an interval increment and a rainfall rate should not share an unexplained rain label. Likewise, a wind average and a maximum over a period are different statistics. Put the period and statistic where the operator can identify them before making a comparison.
A zero wind speed or zero interval rainfall can be a valid observation. A disconnected instrument is not equivalent to either. Agree how the receiving system will identify unavailable data and how long an old observation may remain labelled current. Do not assume this behaviour from the gateway's communication protocol alone.
During commissioning, interrupt one channel under controlled conditions while leaving the station connection active. Check that the interface can distinguish that channel's condition from a whole-station outage. Then reconnect it and examine the recovered time stamps. This tests the presentation of data status without requiring a genuine weather event.
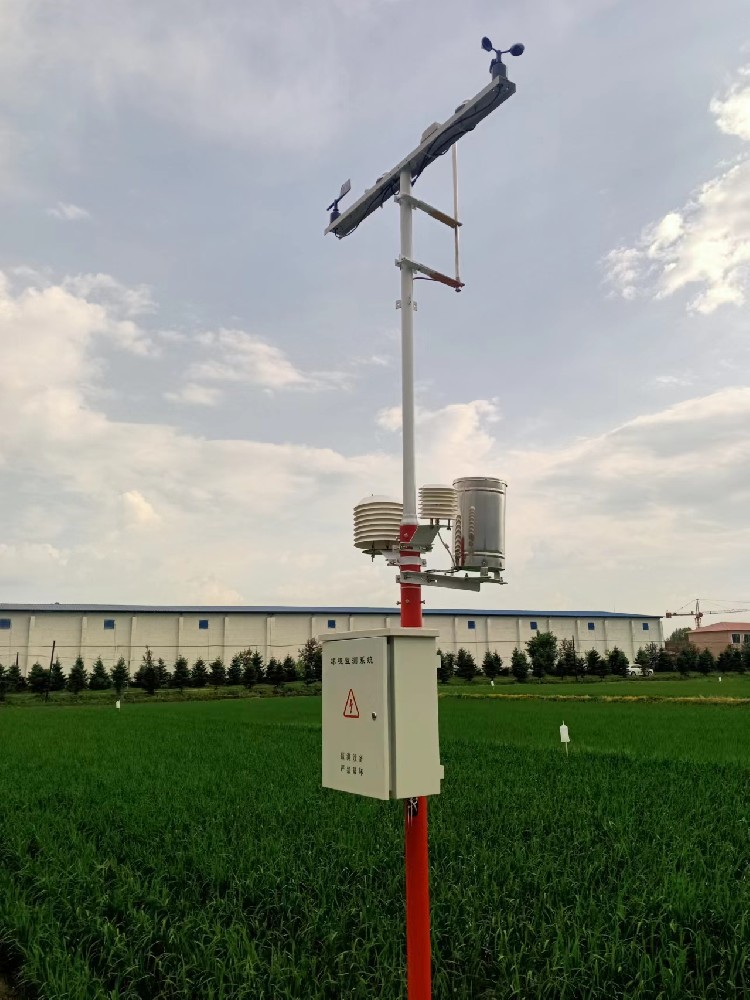
Measured air conditions come from the installed instruments. A calculated index depends on a defined method and input set. A forecast or imported regional observation comes from another data source or service. Displaying them together can be useful, but their origins should remain visible; an on-site sensor does not inherently produce an accurate forecast.
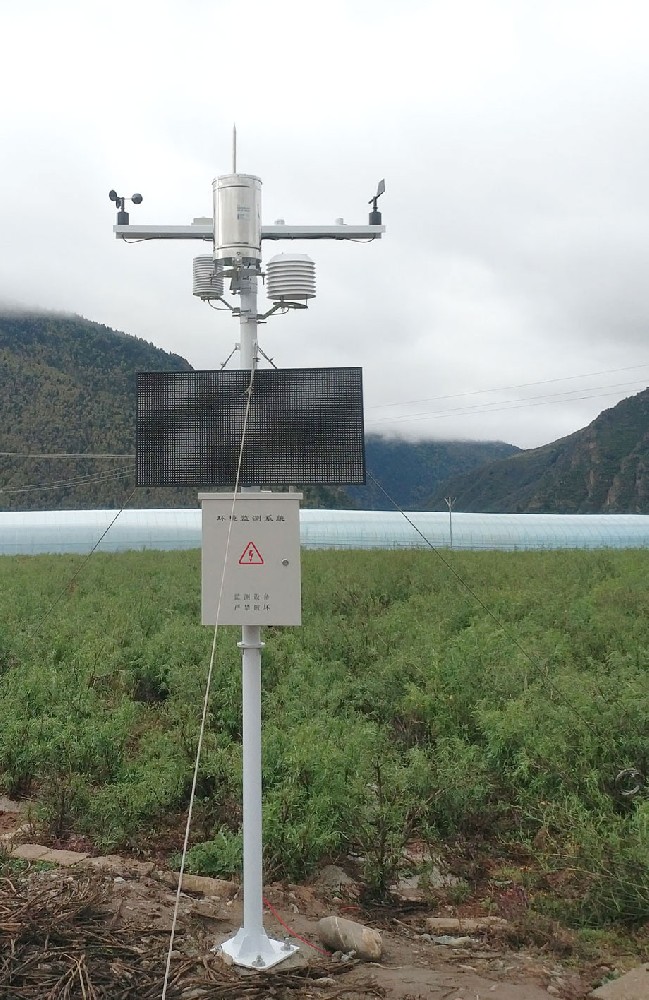
For an industrial or roadside installation, also identify specialist channels separately. Ordinary air temperature does not measure pavement temperature, and weather measurements do not establish every road-surface hazard. The application should not present an unfitted measurement as though it were available merely because the dashboard includes a suitable icon.
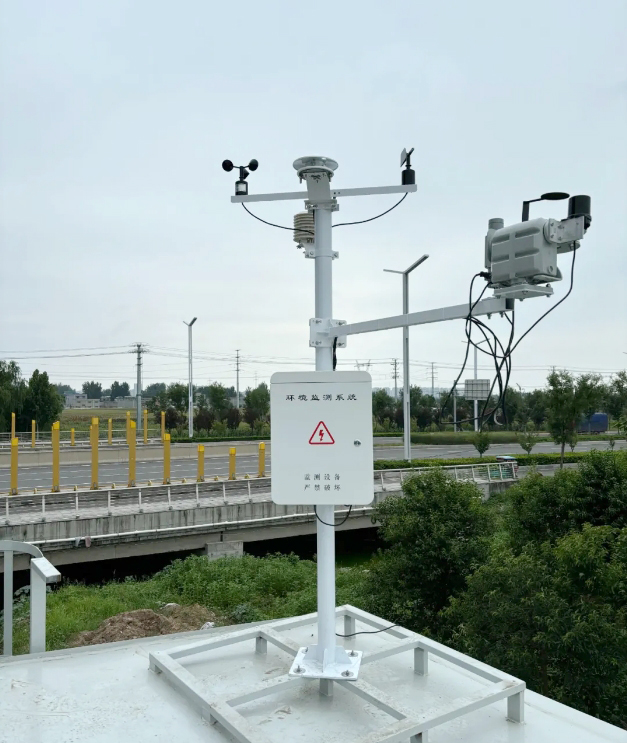
The TG462 / TG462S data logger provides industrial acquisition and configurable communications. TG462S includes a local touchscreen. A local screen, a remote dashboard and an exported history are separate presentation routes; specify which ones the project requires and check the configuration of each.
Export a representative group of records and compare the channel identities, units and time zone with the dashboard. Check whether the export contains observations or chart aggregates. A screenshot can demonstrate a screen layout, but it cannot replace the history required for engineering analysis or later review.
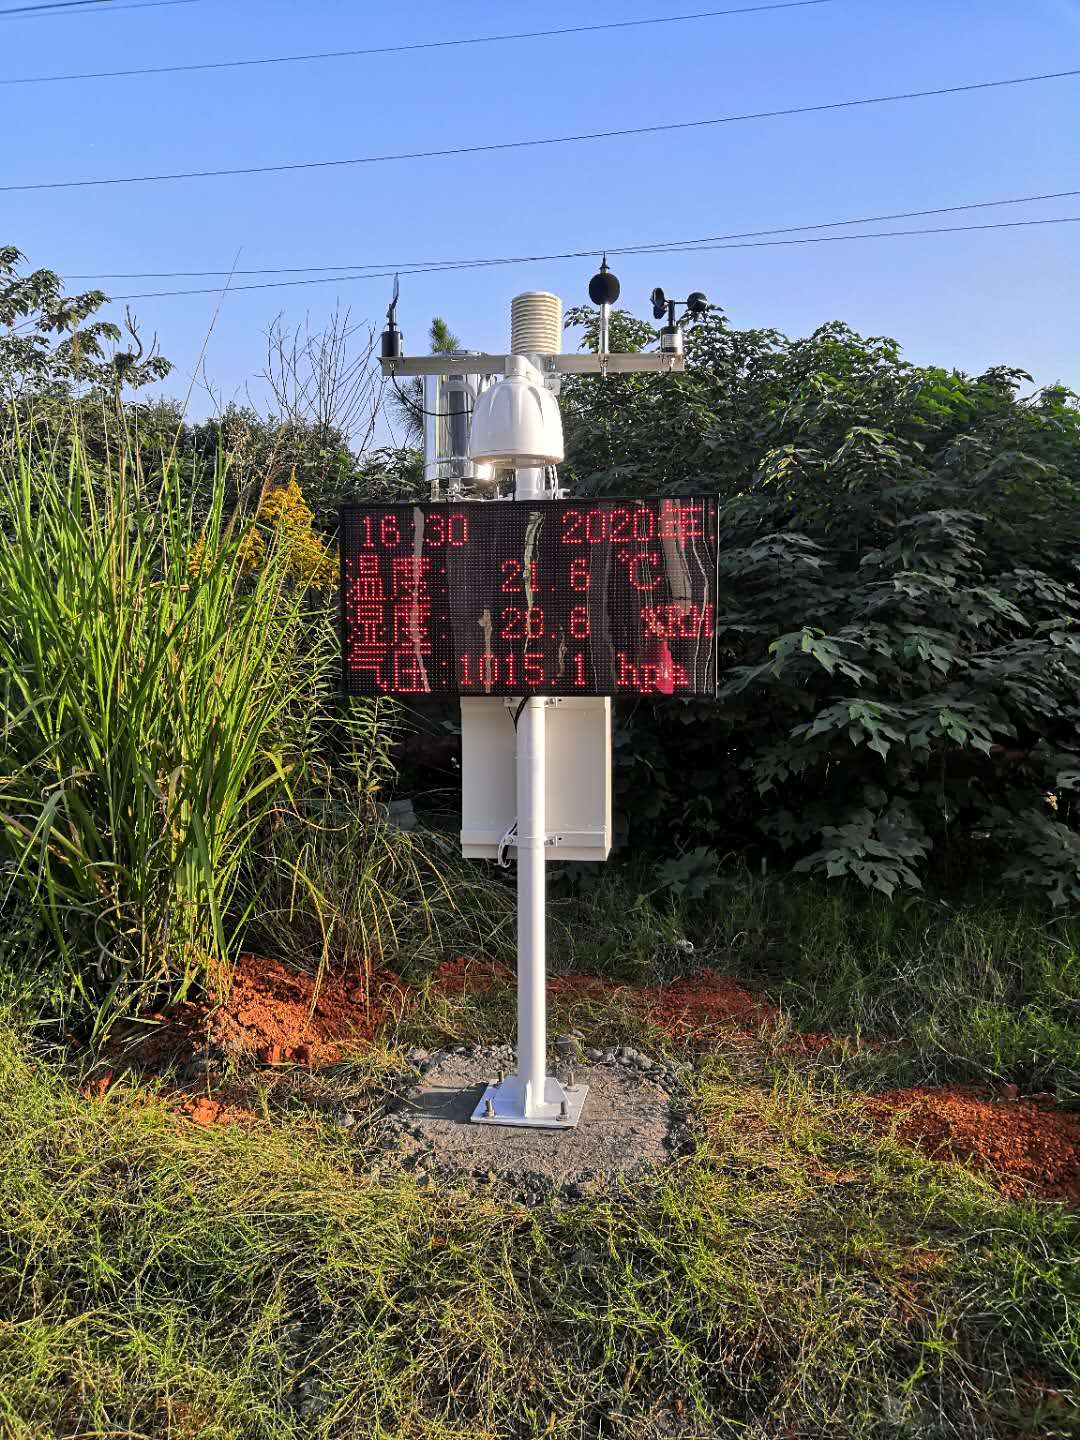
A farm operator may need to view conditions without changing acquisition scaling. A project engineer may need configuration access. Establish these roles for the selected receiving system and test them if access control is part of the order. Do not infer permissions, encryption or remote configuration features from the word smart.
For a NiuBoL inquiry, provide the channel list, intended users, required local or remote views, and any customer-owned receiving system. Identify export and status-display requirements separately from sensor accuracy. These details allow the acquisition and presentation scope to be discussed before a visually convincing screen is mistaken for a complete operating specification.
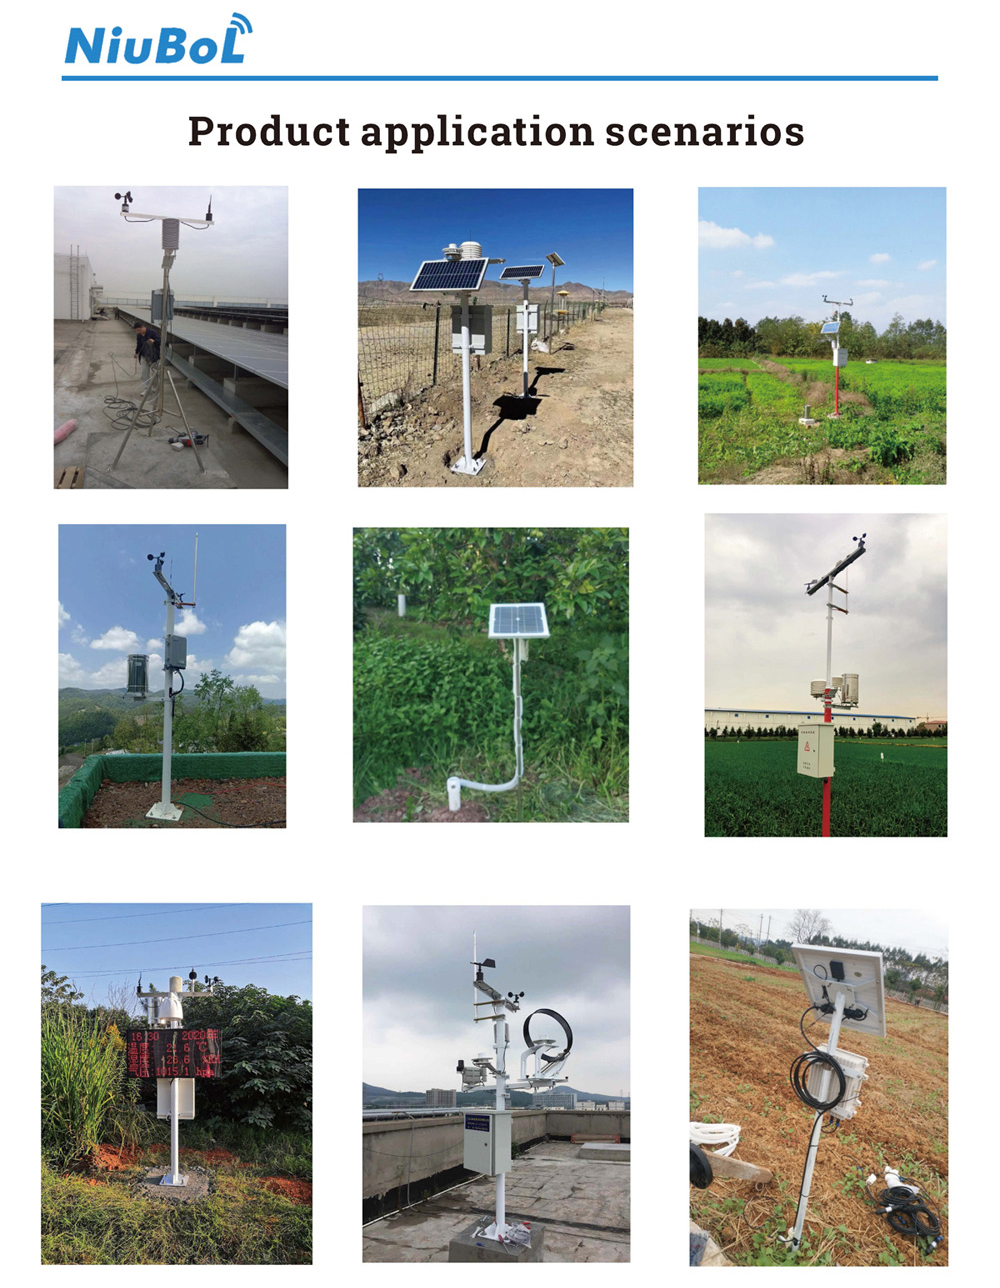
No. It may describe only the station connection. Check channel-level observation times and status so an old value is not mistaken for a current observation.
They may represent different instruments, locations or depths, or unused template positions. Each active field should have a unique physical identity that matches the installed channel list.
Not without explicitly distinguishing it from a valid zero. The project should define its missing-data presentation and freshness rule, then test that behaviour in the receiving system.
Not by definition. Forecasting requires a separately identified analytical service or model and suitable inputs. Keep that information distinguishable from measurements made by the station.
Trace selected installed channels into their displayed fields and exports, then test a controlled interruption. Verify identity, units, time and status rather than accepting only a screen of plausible numbers.
A useful smart weather station dashboard preserves the meaning and status of the measurements. Select clear channel identities, time and period definitions, and distinguish observations from calculations or imported services. Verify the underlying records and missing-data behaviour so the screen can support project decisions rather than only display numbers.
Prev:10 Elements of Weather and Their Measuring Instruments
Next:Soil Moisture Monitoring Equipment: Build a Complete Field Point
Related recommendations
Sensors & Weather Stations Catalog
 Agriculture Sensors and Weather Stations Catalog-NiuBoL.pdf
Weather Stations Catalog-NiuBoL.pdf
Agriculture Sensors Catalog-NiuBoL.pdf
Water Quality Sensor Catalog-NiuBoL.pdf
Related products
 Combined air temperature and relative humidity sensor
 TDR Soil Moisture & Temperature Sensor for irrigation| RS485 |4-20mA| NBL-S-THR
 Soil pH sensor RS485 soil Testing instrument soil ph meter for agriculture |NBL-S-PH
 Wind Speed sensor Output Modbus/RS485/Analog/0-5V/4-20mA
 Tipping bucket rain gauge for weather monitoring auto rainfall sensor RS485/Outdoor/stainless steel
 Pyranometer Solar Radiation Sensor 4-20mA/RS485


Screenshot, WhatsApp to identify the QR code
WhatsApp number:+8615367865107
(Click on WhatsApp to copy and add friends)

