





— Blogs —
—Products—
 Consumer hotline +8618073152920
WhatsApp:+8615367865107
Address:Room 102, District D, Houhu Industrial Park, Yuelu District, Changsha City, Hunan Province, China
Product knowledge
Time:2025-04-02 11:43:32 Popularity:1508
Quick Answer: Soil moisture monitoring instruments should be compared by the quantity they measure, their response in the actual soil and the way observations will be used. A water-content probe, a water-potential instrument and a complete monitoring station are different purchases. Choose the measurement first, then the number of sensing points, acquisition interface and installation method.
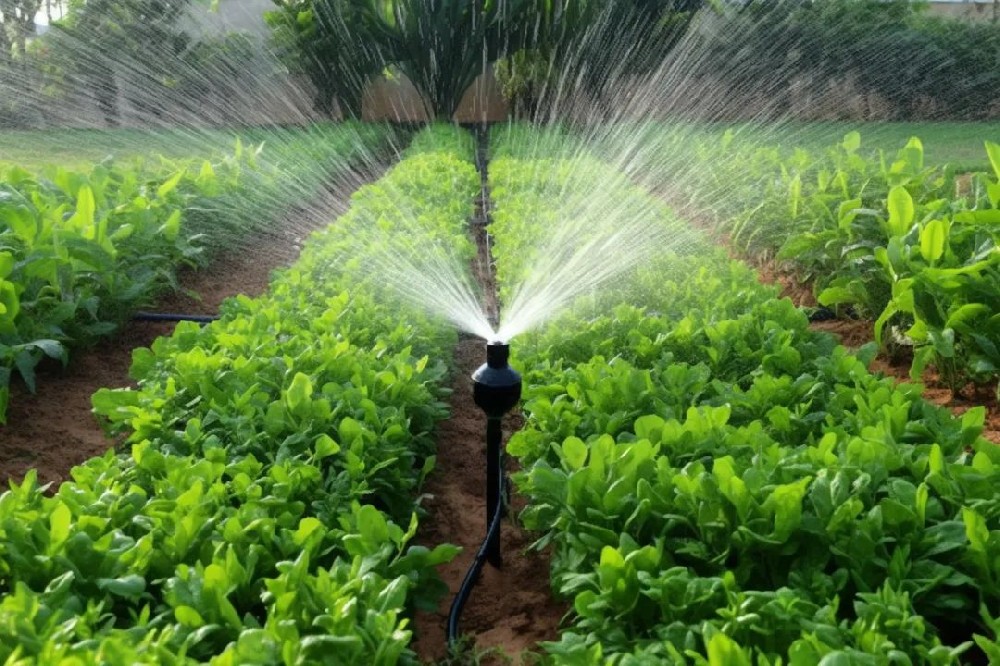
Volumetric water content, often written VWC, is the volume of water divided by the bulk volume of soil. A value of 0.25 m3/m3 is 25% by volume. It is not a percentage of field capacity, a direct measure of plant stress, or a statement that the soil contains one quarter of all the water it could hold.
Gravimetric water content uses water mass relative to dry soil mass. Comparing that result directly with a volumetric probe value is inappropriate without the required conversion and sampling information. Bulk density connects mass-based and volume-based quantities, but an assumed density can introduce a comparison error.
Water potential describes the energy state of soil water rather than the amount stored. Its relationship to water content depends on the soil and conditions. A project using a water-potential threshold should not substitute a VWC percentage simply because both instruments are marketed for irrigation.
| Instrument or method | Useful output | Selection question |
|---|---|---|
| Dielectric water-content probe | An estimate of VWC from the soil's electrical response | How is the estimate affected by soil properties, salinity and installation contact? |
| Water-potential instrument | Water potential for the instrument's measurement range and method | Does the method support the intended threshold and field maintenance? |
| Gravimetric reference sampling | Water content from an appropriate sampling and drying procedure | Are units, sample location and bulk density suitable for comparison? |
| Profile monitoring assembly | Observations at several specified sensing positions | Do those positions describe the relevant soil layers and root zone? |
| Complete monitoring station | Logged and optionally transmitted records from selected instruments | Which sensors, storage, communication and energy functions are actually included? |
Capacitance, frequency-based and time-domain methods use different ways of observing the soil's dielectric response. Conductive or resistive approaches are particularly dependent on the electrical path through the medium. The method name alone does not establish the installed accuracy or suitability of a particular product.
Check the actual offered instrument's range, calibration basis and relevant soil limitations. Do not apply a performance figure from a laboratory medium to every field without verification. High salinity, unusual substrate, stones and poor contact can affect interpretation; corrosion-resistant construction does not make those effects disappear.
A small digital resolution can make a trend appear detailed even when uncertainty is much larger. The display step, repeatability and absolute agreement with a reference are different characteristics. A stable number in a uniform test is useful, but it does not establish representative coverage of a heterogeneous field.
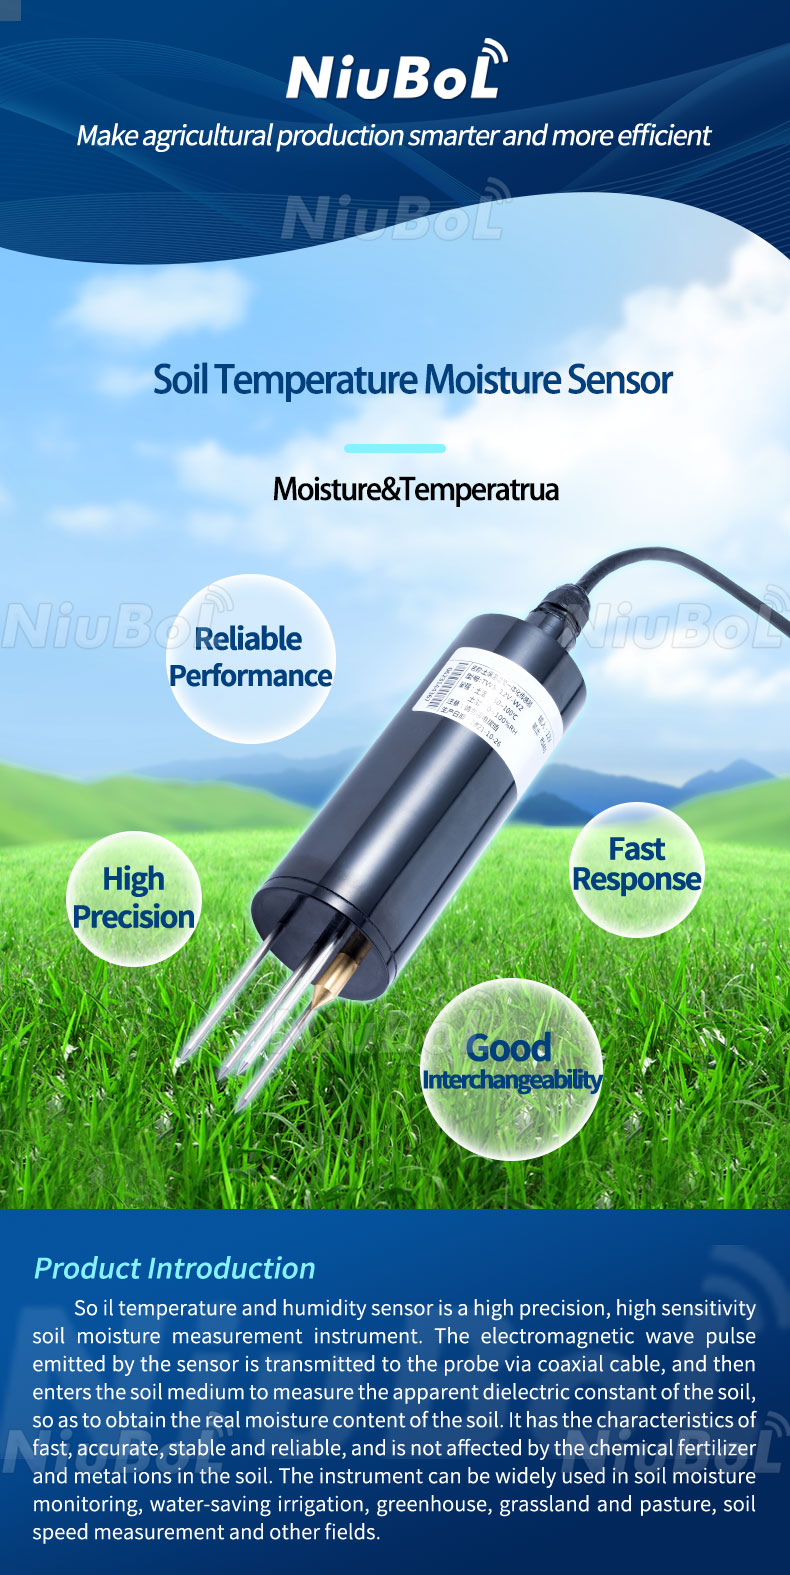
The NBL-S-THR soil moisture and temperature sensor is one NiuBoL option for fixed points or a controlled field measurement procedure. Its specification should not be assigned automatically to the separate EC, profile or water-potential instruments.
| NBL-S-THR characteristic | Value | What to check |
|---|---|---|
| Moisture | Range 0-100%; stated accuracy +/-3%; resolution 0.1% | Keep the delivered output definition and evaluate performance in representative soil. |
| Temperature | Measurement -50 to +100 degrees C; +/-0.5 degrees C; 0.1 degrees C resolution | Do not confuse measurement limits with permitted operating conditions. |
| Operating environment | -40 to +80 degrees C | Review the logger, supply and cable terminations independently. |
| Supply and consumption | 12-24 V DC; approximately 0.3 W | Include multiple probes and voltage drop in the actual distribution design. |
| Output versions | RS485, 4-20 mA or 0-5 V | Choose the required version and verify serial exchange or analog input scaling. |
| Field construction | IP68 probe; cable length and jacket to be specified | Choose a serviceable installation and separately protect field connections. |
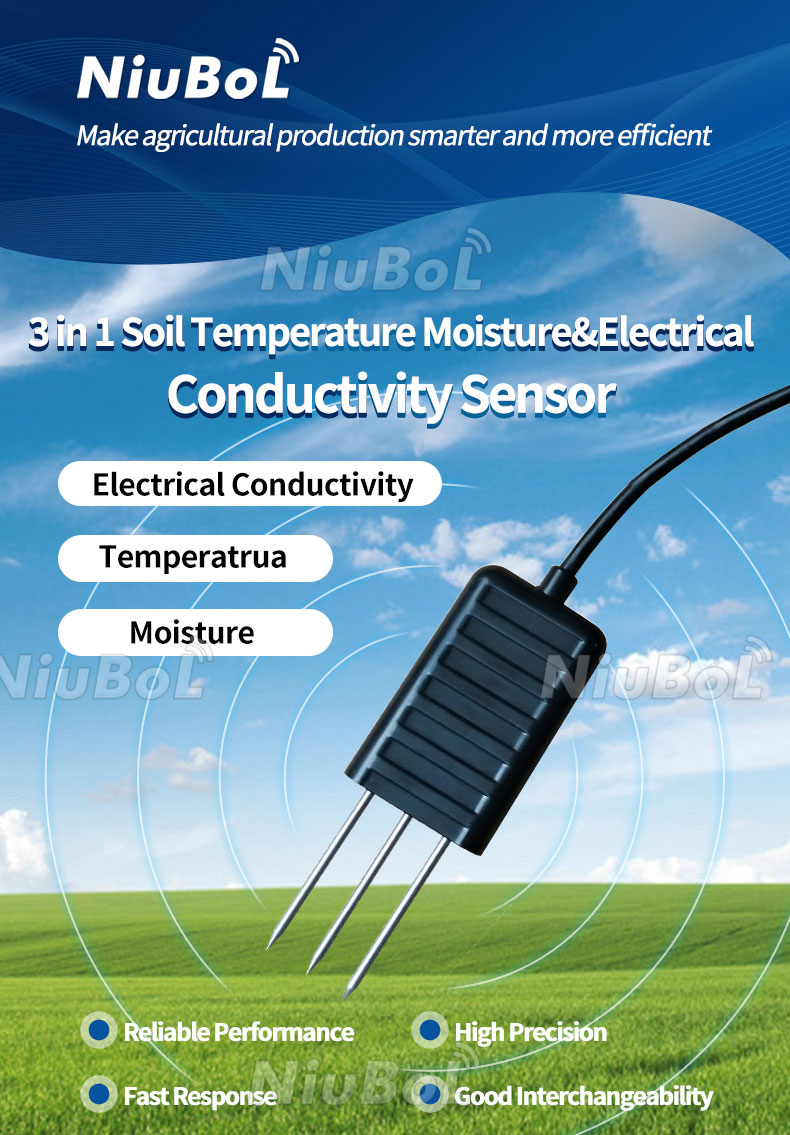
The related soil temperature, moisture and EC option adds an electrical-conductivity measurement. EC can provide additional context but is not itself a complete nutrient analysis or a fertilizer-dose instruction. Specify whether that extra channel will change a decision before selecting it.
A single point describes a local volume. Soil texture, compaction, slope, crop and irrigation distribution can make neighboring locations behave differently. Divide the intended monitoring area into meaningful zones before deciding how many instruments are needed. A universal probe-per-hectare claim is not a defensible layout method.
Depth matters as well as position. A shallow observation can show surface wetting while deeper roots remain in a different condition. A profile system can help compare layers, but extra layers do not automatically increase horizontal coverage. Identify the sensing positions of the actual assembly and relate them to the soil profile.
For a greenhouse or container crop, assess the growing medium and its geometry. A calibration or insertion arrangement suitable for mineral soil may not describe a highly porous substrate. Request compatibility information for that medium and use an appropriate comparison procedure before adopting a control threshold.
A uniform VWC change of 0.03 m3/m3 across a 0.4 m layer corresponds to 12 mm of water storage change: 0.03 x 0.4 x 1000. This is an illustrative layer calculation, not proof that one point represents a field or that all of that water was available to roots.
Plant-available storage also depends on soil water retention and rooting depth. The FAO soil-water framework distinguishes total available water from the fraction that can be depleted before stress. A sensor's 0-100% range therefore should not be used as an irrigation operating target.
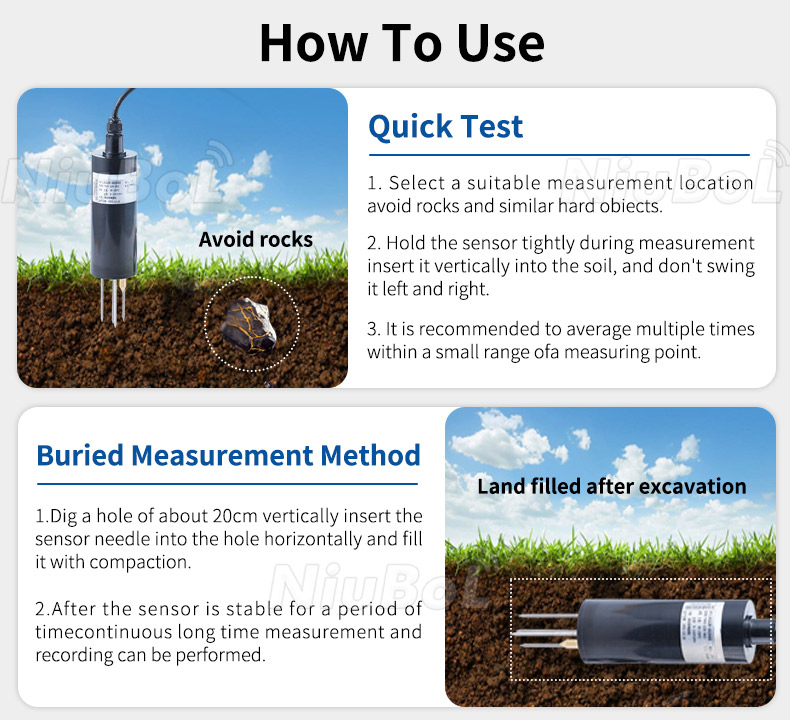
Install the probe using the selected instrument's geometry and a method that produces consistent soil contact. Avoid forcing prongs against stones or leaving a void around the sensing section. Disturbed backfill can initially behave differently from undisturbed surrounding soil; observe the response rather than declaring the installation valid from one plausible number.
For a reference comparison, identify the sampled soil volume, depth and time. A small sample from a dry surface is not a suitable comparator for a deeper probe in a wetted zone. Match units and retain the conditions before deciding that an offset should be applied.
As an illustrative example, take a gravimetric water content of 0.18 kg/kg and a dry bulk density of 1400 kg/m3. Using a water density of 1000 kg/m3 gives a volumetric content of 0.18 x 1400 / 1000 = 0.252 m3/m3, or 25.2%. Comparing the original 18% mass-based value directly with a volume-based probe would create an apparent difference before instrument error is considered.
The conversion is only useful when the density and sample describe the relevant soil. Compacted and loose locations can have different bulk densities. Do not select an assumed value merely to force agreement with the sensor. Match the sampling volume and procedure, then investigate remaining differences.
A controlled comparison should also distinguish repeatability from bias. Repeated values close together show consistency under those conditions; they can still differ systematically from the intended reference. If a correction is needed, establish where it is valid and avoid applying one offset to a different soil, depth or growing medium without evaluation.
For RS485 Modbus RTU acquisition, confirm the actual device exchange, scaling and units with the logger or PLC. A value of 250 may mean 25.0% under a declared scale, but it could mean something else in another register. Use the delivered mapping rather than inferring a unit from a plausible display.
Check whether the platform presents the observation time or only the most recent upload time. Missing records and stale values should remain identifiable. Increasing wireless reporting frequency does not improve poor probe contact or turn a nonrepresentative point into a zone average.
For irrigation review, prioritize representative points and a usable wetting-and-drying record. For a research comparison, specify the reference method and uncertainty requirement. For a distributor supplying a system integrator, match the customer's inputs, cable requirements and environmental conditions before adding a new data platform.
Send NiuBoL the soil or substrate, crop, intended quantity, installation depths, acquisition interface and required operating conditions. Include whether the instrument will remain buried or be used for repeated spot checks. Compare the probe and complete-station costs separately so optional communication does not obscure the sensing decision.
No. VWC is water volume divided by soil volume. Field capacity is a soil-specific condition. Establish the relevant soil relationship before converting a probe value into an irrigation decision.
No. Compare the actual model's performance, soil limitations, installation, output and maintenance requirements. A method name does not establish the uncertainty of a particular installed point.
Check location, depth, timing, units, bulk density where required and soil contact. The probe and sample may describe different volumes or different water-content definitions before any calibration error is considered.
Only when conductivity information supports the intended interpretation. It can add useful context in a suitable application, but it does not directly establish all nutrient concentrations or replace agronomic assessment.
No. Multiple depths describe a local profile. Horizontal representativeness still depends on soil, terrain, crops and irrigation zones, so a layout requires more than a layer count.
Verify identity, units, interface, stable acquisition and representative field response using an agreed comparison. A plausible value on a phone proves neither correct installation nor an appropriate irrigation threshold.
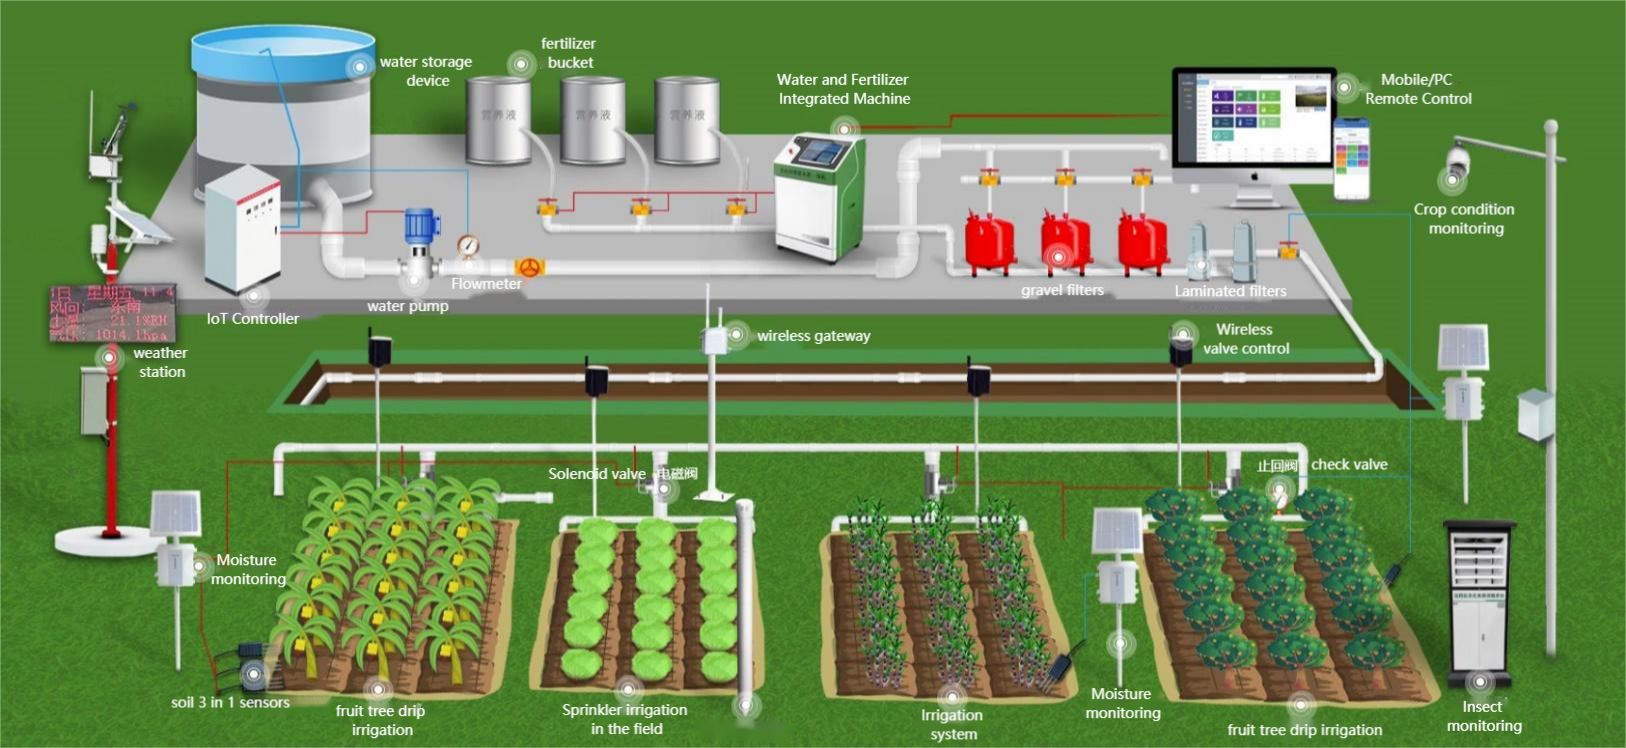
Choose soil moisture instruments by quantity, field behavior and the decision they support. Match water-content and reference definitions, install representative points with consistent contact, and verify the acquisition scale. Those choices matter more than an isolated accuracy label or the largest channel count.
 NBL-S-THR-Soil-temperature-and-moisture-sensors-Instruction-Manual-V4.0.pdf
NBL-S-TMC-Soil-temperature-and-moisture-conductivity-sensor.pdf
NBL-S-TM-Soil-temperature-and-moisture-sensor-Instruction-Manual-4.0.pdf
NBL-S-TMCS-Soil-Temperature-Humidity-Conductivity-and-Salinity-Sensor.pdf
Prev:Soil Moisture Sensors: Key Tools for Smart Agriculture
Next:Reservoir Water and Rainfall Monitoring: Level Is Not Stored Volume
Related recommendations
Sensors & Weather Stations Catalog
Agriculture Sensors and Weather Stations Catalog-NiuBoL.pdf
Weather Stations Catalog-NiuBoL.pdf
Agriculture Sensors Catalog-NiuBoL.pdf
Water Quality Sensor Catalog-NiuBoL.pdf
Related products
 Combined air temperature and relative humidity sensor
 TDR Soil Moisture & Temperature Sensor for irrigation| RS485 |4-20mA| NBL-S-THR
 Soil pH sensor RS485 soil Testing instrument soil ph meter for agriculture |NBL-S-PH
 Wind Speed sensor Output Modbus/RS485/Analog/0-5V/4-20mA
 Tipping bucket rain gauge for weather monitoring auto rainfall sensor RS485/Outdoor/stainless steel
 Pyranometer Solar Radiation Sensor 4-20mA/RS485


Screenshot, WhatsApp to identify the QR code
WhatsApp number:+8615367865107
(Click on WhatsApp to copy and add friends)

