





— Blogs —
—Products—
 Consumer hotline +8618073152920
WhatsApp:+8615367865107
Address:Room 102, District D, Houhu Industrial Park, Yuelu District, Changsha City, Hunan Province, China
Product knowledge
Time:2022-05-10 19:44:23 Popularity:2196
Quick answer: A soil moisture sensor may show data on a portable meter, a local panel, a data logger, a PLC/SCADA system or a cloud dashboard. The display method is separate from the sensing method. Select the output and viewer by deciding who needs the data, where they need it and whether continuous records or control are required.

A useful soil moisture sensor display tells the operator more than a percentage. It identifies the measurement point and depth, distinguishes a new reading from an old one, and gives enough history to interpret wetting and drying. A large screen cannot compensate for a probe installed outside the irrigated root zone. Equally, a correctly installed probe has limited operational value if its readings cannot be traced to the right field block.
| Method | Suitable use | Limit |
|---|---|---|
| Portable meter | Spot surveys and troubleshooting | Depends on manual visits and consistent technique |
| Local digital display | Operators who need an immediate reading at the site | May not provide long-term storage |
| Data logger | Continuous records, remote stations and later export | Requires compatible inputs and configured timestamps |
| PLC or SCADA | Industrial irrigation and process integration | Needs scaling, alarms and control logic |
| Cloud dashboard | Multi-site viewing and notifications | Depends on gateway, network, security and data service |
Choose the viewer around the working routine. An irrigation technician standing at a valve manifold may need a local indication without signing into a remote platform. A farm manager comparing blocks needs consistent trends and exportable records. A research team may require access to the recorded values rather than only daily charts. These requirements affect the logger and software scope even when the same sensing principle is used below ground.
Volumetric water content, or VWC, expresses water volume relative to soil volume. A value of 0.25 m3/m3 is 25% VWC. It is not 25% of the water available to the crop, and it is not air relative humidity. Soil-water tension is another measurement, normally expressed in pressure units. Changing a display label cannot convert a water-content sensor into a tensiometer.
The same VWC can have different agricultural significance in different soils. A trend screen should therefore keep soil or management-zone identity available alongside the value. Avoid giving every field the same red, amber and green bands simply to make the dashboard consistent. The irrigation thresholds need to reflect the crop, rooting depth and soil conditions. FAO soil-water guidance distinguishes moisture content from the water available to plants.
A change from 25% to 28% VWC is three percentage points. It is not a three-percent relative increase. This distinction matters when setting a trend alarm or comparing two instruments. Display resolution is also different from accuracy: showing a decimal place does not establish that a small change is larger than the sensor's uncertainty or that two locations should agree within that decimal place.
A portable soil temperature and moisture tester suits spot surveys, checks around an emitter and investigations of differences between blocks. The operator can visit several locations with one instrument. Record location, depth and measurement time during the visit; otherwise a list of percentages becomes difficult to compare later. Use consistent insertion and soil-contact technique instead of treating every nearby reading as an equivalent repeat.
A permanently installed sensor is more useful for observing the sequence before and after irrigation. It can show when water reaches a selected depth and how the point dries between events. It still observes a limited volume, not every root in the block. Position and depth should be recorded when commissioning the station, and any later relocation must be visible in the history rather than silently joining two different locations into one continuous trend.
Portable and fixed instruments can complement one another, but disagreement does not immediately identify a failed probe. Confirm that they measure the same quantity at comparable depths and locations. A reading beside an emitter shortly after irrigation may differ from a fixed probe farther away. A comparison made after pulling a buried sensor out of the soil can also destroy the soil contact being evaluated.

RS485 sensors commonly use Modbus RTU and can share a bus when addresses and serial settings are correct. Analog versions may use 4-20 mA or voltage output and require one compatible input per signal. Confirm the exact output, supply, cable and register or scaling document before ordering.
For example, the NiuBoL NBL-S-THR soil temperature and moisture probe has separate output-version choices. A panel designed only for analog signals cannot read the RS485 version without a suitable converter or acquisition device. Check whether the panel is just an indicator or also records data. A second screen connected to the same logger is another view of that logger's measurement, not an independent reference instrument.
| NBL-S-THR characteristic | Value or output option | Display implication |
|---|---|---|
| Moisture range / resolution | 0-100% / 0.1% | Label the soil-water quantity clearly; do not label it air RH. |
| Temperature range / resolution | -50 to +100 degrees C / 0.1 degrees C | Use a distinct temperature channel with signed-value handling where required. |
| Accuracy | Moisture +/-3%; temperature +/-0.5 degrees C | Do not interpret an extra display digit as improved measurement accuracy. |
| Supply / consumption | 12-24 V DC; approximately 0.3 W | The receiving indicator or logger needs its own power allowance. |
| Output versions | RS485 / Modbus RTU, 4-20 mA or 0-5 V | Specify the ordered version and compatible receiving inputs. |
| Operating environment / protection | -40 to +80 degrees C; IP68 probe | The measurement span does not extend the ambient operating rating or protect the display cabinet. |
For digital values, agree where scaling occurs. In the NBL-S-THR V4.0 data format, the measurement words use a factor of ten: a valid moisture word of 272 becomes 27.2%. If the gateway has already performed that conversion, dividing again in the dashboard gives 2.72%. Have one defined conversion stage and compare the result through the complete path. Invalid values must be identified before numerical scaling, not converted into a plausible measurement.
At minimum, show the value, unit, sensor identity and timestamp. A remote platform should also indicate missing or invalid data instead of displaying the last value as though it were current. For irrigation, trend charts and threshold history are often more useful than a single number.
Name points consistently, for example by block, depth and probe identity. Keep shallow and deep readings on separately identifiable traces. A shallow rise followed by a deeper rise after an irrigation event can be useful context; averaging those traces into one number removes that sequence. Add a recorded irrigation start or operator note where available, but do not present a scheduled valve command as proof that water actually reached the soil.
Use the acquisition time for the trend's time axis when uploads are delayed. A batch received at 10:00 may contain observations collected earlier. Plotting all of them at receipt time makes the soil appear to change abruptly when only the connection recovered. Record the time zone in exported data and keep event times consistent across the irrigation controller and sensor logger. Preserve genuine gaps rather than drawing a continuous line through an extended outage without indicating the gap.
During acceptance, compare the local reading with the value shown remotely, including unit and timestamp. Disconnect one sensor to verify that the system reports a fault rather than a believable value. Export a sample file and confirm that column names, time zone and decimal scaling match the customer specification.
Routine review should identify stale values, flat trends and unexplained gaps. A display can look normal while showing the last stored value, so data age should always be visible.
Before relying on alarms, rehearse the expected operating situations. Confirm that a point changes on the correct trace, that the most recent acquisition time advances, and that an acknowledged alarm remains associated with the correct block. With automatic control disabled or placed in an approved test state, interrupt a sensor connection and confirm the intended missing-data indication. Reconnect and check recovery without erasing the fault period from the record.
Check a real exported file as well as the chart. It should retain the point identity, depth, unit, acquisition timestamp and quality status needed for later interpretation. Determine whether export access depends on a service account or subscription. If the receiving system applies smoothing, make the original recorded observations accessible where investigation requires them. A smooth chart can conceal short events or make a failing channel look more stable than it is.
For a quotation, distinguish the probe, portable meter or panel, data logger, remote-viewing software and any communication service. Ask whether the offer includes configuration of units and tag names, historical storage, export and alarms. These are separate deliverables; a price for an RS485 probe does not include a complete remote monitoring account. Conversely, a local-only project may not need a cellular modem or recurring remote service.
NiuBoL can review the sensor output and acquisition arrangement against the intended viewing method. Provide the number of blocks and depths, existing controller or logger, cable routes, who needs local access and who needs remote records. Include any requirement for operation without internet. A TG462S collector with a local display is one configurable acquisition option, not a guarantee that a soil dashboard is already programmed for a particular project.
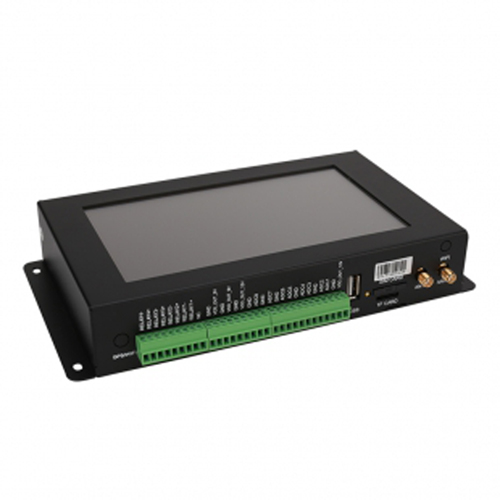
Only when local viewing is required and the existing controller or logger cannot provide it. A compatible receiving system can read the sensor without a dedicated indicator. Include a portable meter for site surveys if that is a separate maintenance requirement.
No universal target follows from that number. Establish the quantity, soil type, root-zone objective and validated threshold. A VWC value is not the percentage of plant-available water and should not be given a universal dry or wet label.
Check where the digital scale factor is applied. The value may have been converted in the logger and divided again in the application. Compare a time-matched decoded sensor value, logger value and displayed value before changing the probe calibration.
Yes, if the acquisition and software support the required point count. Keep each location and depth identifiable and verify the tag assignments individually. A combined average should not replace the separate traces needed to inspect wetting response.
Show a fault or stale-data state with the last valid acquisition time. A retained reading can remain available for reference, but must not appear current. Whether irrigation continues, pauses or uses another rule is a separate controller decision.
It can support an investigation, provided quantity, calibration basis, depth and soil conditions are comparable. Different measurement volumes or disturbed soil can explain a difference. Do not use a nearby spot reading alone as justification for applying a permanent offset.
Provide probe count and depths, output type, local or remote access needs, recording interval, storage and export requirements, site power and available network. State whether existing panels or software must be retained so compatibility work can be included explicitly.
Choose the soil moisture display around the field workflow and the meaning of the recorded value. Correct units, clear depth labels, visible data age and accessible trends are more useful than an attractive number alone. Match the probe output, acquisition device and viewing software as one measurement path, then verify that path before using its alarms.
Related recommendations
Sensors & Weather Stations Catalog
 Agriculture Sensors and Weather Stations Catalog-NiuBoL.pdf
Weather Stations Catalog-NiuBoL.pdf
Agriculture Sensors Catalog-NiuBoL.pdf
Water Quality Sensor Catalog-NiuBoL.pdf
Related products
 Combined air temperature and relative humidity sensor
 TDR Soil Moisture & Temperature Sensor for irrigation| RS485 |4-20mA| NBL-S-THR
 Soil pH sensor RS485 soil Testing instrument soil ph meter for agriculture |NBL-S-PH
 Wind Speed sensor Output Modbus/RS485/Analog/0-5V/4-20mA
 Tipping bucket rain gauge for weather monitoring auto rainfall sensor RS485/Outdoor/stainless steel
 Pyranometer Solar Radiation Sensor 4-20mA/RS485


Screenshot, WhatsApp to identify the QR code
WhatsApp number:+8615367865107
(Click on WhatsApp to copy and add friends)

