

— Blogs —
—Products—
 Consumer hotline +8618073152920
WhatsApp:+8615367865107
Address:Room 102, District D, Houhu Industrial Park, Yuelu District, Changsha City, Hunan Province, China
Product knowledge
Time:2026-09-16 08:00:00 Popularity:231
Quick Answer: To interpret COD meaning in water quality reports, read it as chemical oxygen demand: the oxygen equivalent of material oxidized under a specified chemical test, usually expressed in mg O2/L. COD is not the oxygen currently dissolved in the water and does not identify individual pollutants. An optical online COD reading is an estimate derived from light absorption, so its relationship to laboratory COD must be established for the water being monitored.
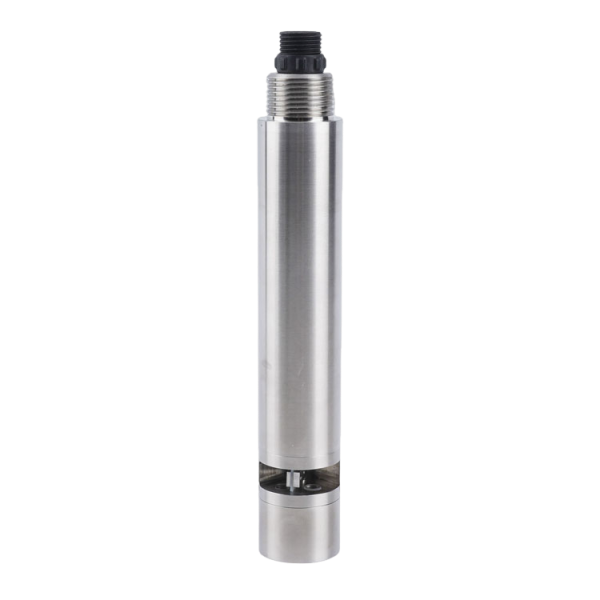
COD is used to describe oxidizable load in water and wastewater. A larger result means more oxygen equivalent is associated with the substances measured by that test. It does not directly state the mass of organic carbon, the concentration of one chemical or the oxygen supply that an aeration system must deliver.
Organic substances commonly contribute to COD, but some reduced inorganic substances can also contribute under the test conditions. Different compounds are not necessarily oxidized to the same extent. Treat COD as a method-defined aggregate measurement rather than a complete inventory of contamination.
A laboratory COD test uses a chemical oxidation procedure. For example, EPA Method 410.4 uses dichromate digestion followed by colorimetric measurement. That is fundamentally different from placing a UV absorption probe in a stream. The two can produce related trends, but a shared COD label does not make their methods interchangeable.
| Indicator | What it describes | What it does not establish alone |
|---|---|---|
| COD | Oxygen equivalent associated with chemical oxidation under specified conditions | Biodegradability, pollutant identity or immediate oxygen availability |
| Dissolved oxygen, DO | Oxygen present in the water at the measuring point | The amount of oxidizable material entering the process |
| Biochemical oxygen demand, BOD | Oxygen demand measured through a defined biological test | A universal conversion to COD or the same result as an optical BOD estimate |
| Total organic carbon, TOC | Organic carbon measured by the specified analytical procedure | A fixed oxygen-equivalent value for every water composition |
| pH | Acid-base condition expressed through hydrogen-ion activity | The magnitude of the COD load |
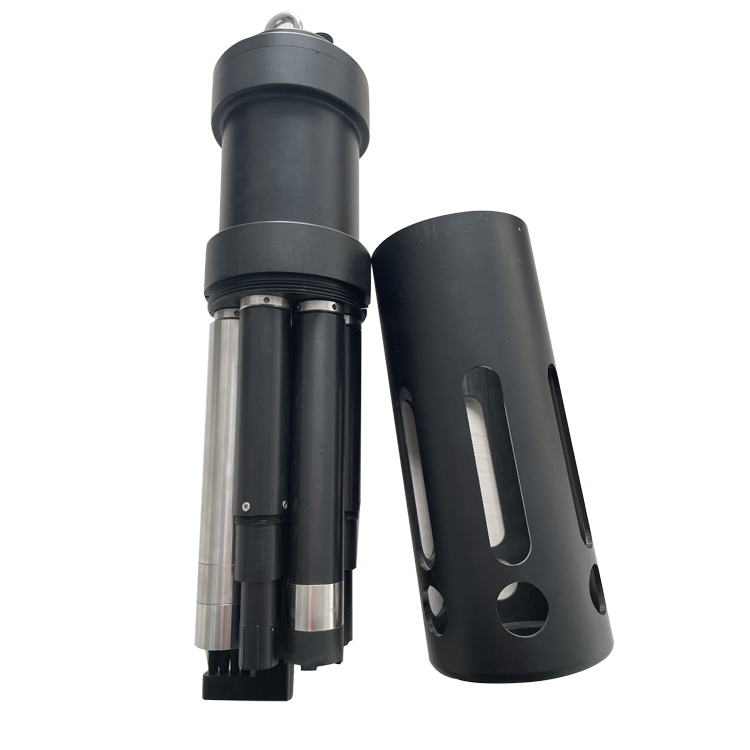
Water with high COD can still have measurable dissolved oxygen at a particular moment, especially where it is being aerated. Conversely, low DO can occur for reasons that a COD value alone cannot explain. Do not subtract the DO reading from COD or use COD directly as an oxygen-controller setpoint.
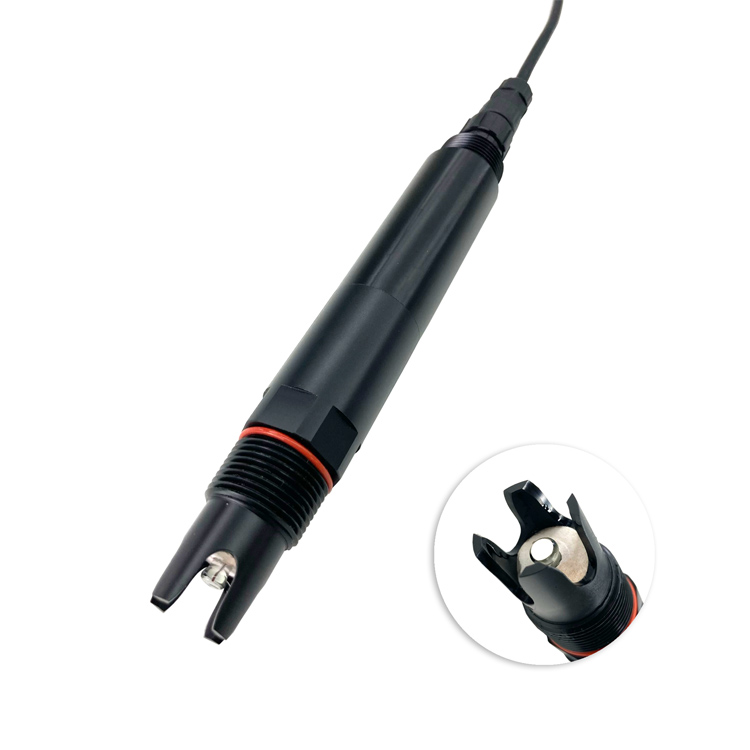
Likewise, a wastewater stream can have an acceptable pH while carrying a substantial organic load. pH helps identify conditions that may affect treatment, but it is not a substitute for COD monitoring. Adding a pH channel to a station provides a different piece of information rather than a second measurement of the same pollution indicator.
A COD value in mg/L is a concentration. To estimate mass loading, combine a representative concentration with the corresponding water flow. For a stable flow and concentration, the unit conversion is:
COD load (kg/day) = COD (mg/L) x flow (m3/day) / 1000.
As an illustrative calculation, 200 mg/L at 500 m3/day gives 100 kg/day of COD load. If dilution lowers the concentration to 100 mg/L while flow rises to 1000 m3/day, the load remains 100 kg/day. The lower concentration does not, in that example, show that treatment removed more oxidizable material.
For variable flows, calculate over matched time intervals rather than multiplying an unrelated spot sample by a daily flow total. A short high-load discharge can be hidden by a daily average. The sensor location, sampling time and flow measurement need to describe the same stream, with any transport delay considered.
A sustained increase at a stable inlet can indicate an increased oxidizable load, but it does not identify its origin. Compare production events, flow and other water-quality channels before deciding what changed. An abrupt optical COD increase accompanied by rising turbidity may require a sample check to distinguish a genuine composition change from an optical interference.
When comparing treatment inlet and outlet, allow for hydraulic travel time. Simultaneous readings at both ends may represent different batches of water. At equal, steady flow and with comparable measurements, a concentration decrease from 250 to 50 mg/L corresponds to an 80% decrease. That illustrative calculation is not valid evidence of removal if streams are diluted, diverted or sampled inconsistently.
COD also does not determine a universal aeration requirement. Biological response depends on the biodegradable portion of the load, process conditions and other oxygen demands. An oxygen probe helps operators observe the actual dissolved oxygen condition; COD provides complementary information about incoming or residual load. Use each indicator for the question it can answer.
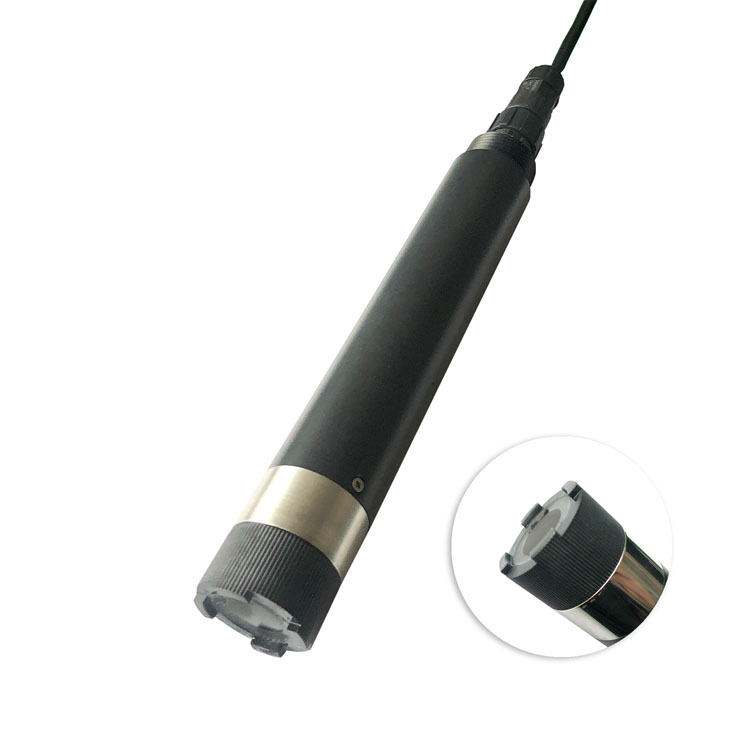
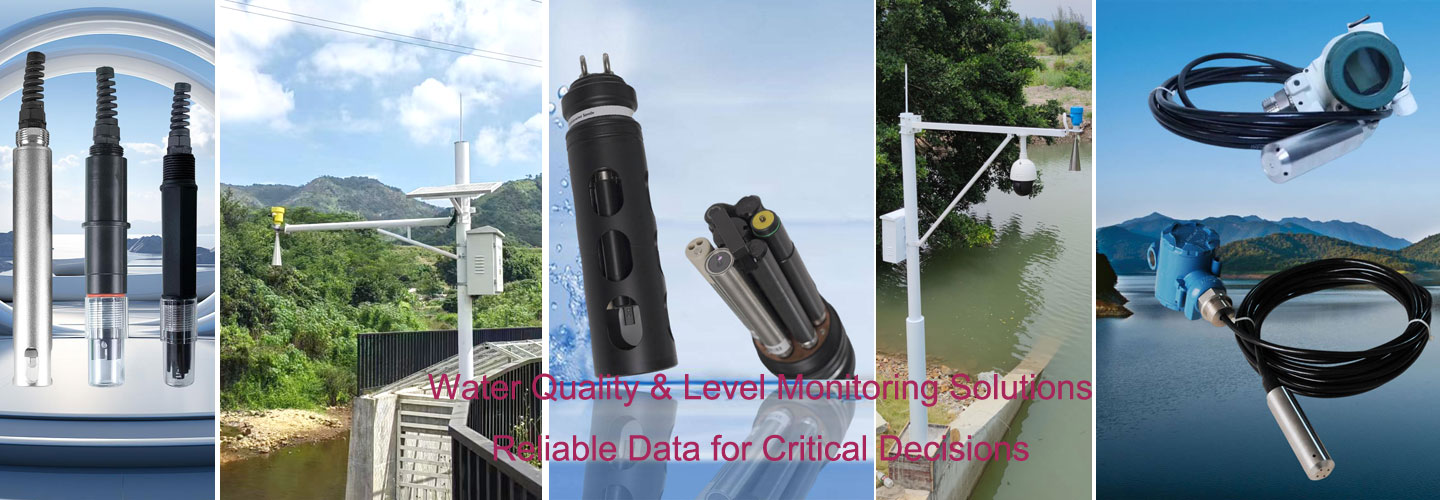
The NiuBoL NBL-WQ-COD measures ultraviolet absorption and uses a reference optical channel to help compensate for turbidity effects. Many organic compounds absorb UV light, so the response can be related to COD through calibration and sample-specific comparison. The instrument does not perform a chemical digestion on every reading.
That distinction explains both its usefulness and its limits. It can provide frequent observations of changes without routine reagent dosing at the sensing point. However, different mixtures of compounds can have different relationships between UV absorption and laboratory COD. A relationship established for one industrial stream should not automatically be applied after a major change in feedstock or treatment chemistry.
| NBL-WQ-COD specification | Value or condition | Interpretation |
|---|---|---|
| Measuring method | Dual-wavelength UV absorption | Continuous optical estimate, not a digestion measurement |
| Range options | 0-200 mg/L equiv. KHP with 0-100 NTU; or 0-500 mg/L equiv. KHP with 0-200 NTU | Select the paired COD and turbidity configuration |
| COD resolution | 0.1 mg/L | Resolution does not establish agreement with laboratory COD |
| COD accuracy | +/-5%; confirm the percentage basis and applicable conditions for the supplied version | Include the required error near the intended decision level in the enquiry |
| Supply / consumption | 12-24 V DC / 0.3 W at 12 V | Cleaner peak demand and station loads need separate assessment |
| Output | RS485, Modbus RTU | Host must apply the correct units and decimal scaling |
| Operating conditions | 0-45 C; pressure below 0.1 MPa | Do not assume suitability for a hot or pressurized process line |
| Housing / protection | 316L stainless steel / IP68 | Check chemical exposure and protect cable connections |
| Cable | 5 m standard; four-core twisted-pair shielded construction | Specify jacket compatibility and extensions for the installation |
The KHP-equivalent range identifies a calibration basis; it does not mean the process contains that concentration of potassium hydrogen phthalate. When reviewing the NBL-WQ-COD sensor configuration, distinguish reference-solution performance from performance in the actual wastewater. Ask for the accuracy basis to be explicit rather than treating an unqualified percentage as a complete uncertainty statement.
Suspended material can scatter or absorb light. A reference channel helps address some optical effects, but it does not make every particle distribution, colour change or deposit irrelevant. A fouled window can also change the signal even when the water itself has not changed. Inspect the measurement region and cleaner when a trend becomes inconsistent with other observations.
A separate turbidity measurement can help identify when particle conditions change. It cannot by itself correct every COD result. Avoid applying a universal NTU-to-COD conversion, and do not filter a comparison sample without recording that preparation. A filtered sample and an unfiltered online stream may represent different fractions of the water's oxidizable material.
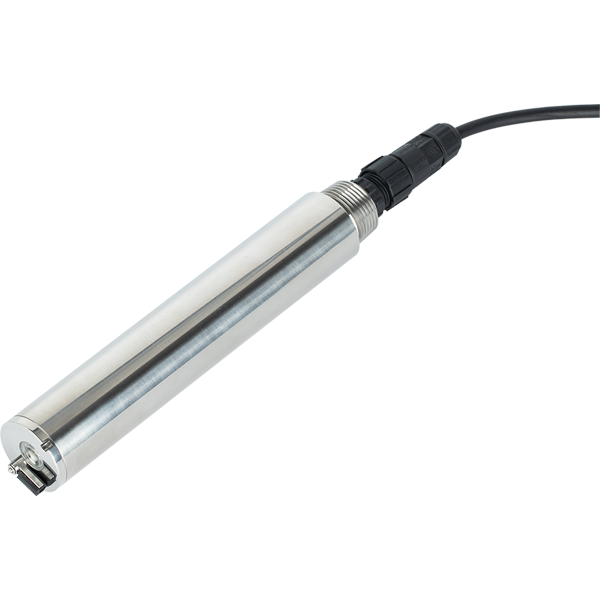
In municipal wastewater, the signal can help locate periods of changing inlet load and guide follow-up sampling. In an industrial equalization system, it can help flag departures from the established stream pattern. In surface-water observation, a change can prompt investigation, but the signal alone does not identify a pollutant or establish that the water is safe.
Connect the sensor to a PLC, RTU or data logger through its supported RS485 Modbus RTU interface. Label the channel so operators know that it is an optical estimate. Store the corresponding time, water temperature where available, cleaning events and invalid-data periods. Do not let a held value after communication loss appear to be a fresh measurement.
Use representative paired samples to establish whether the trend is useful over the expected conditions, and repeat the comparison when the water changes materially. For formal reporting, determine the required analytical method and acceptance conditions with the responsible project authority. Neither a Modbus connection nor a good correlation in one trial establishes regulatory acceptance of an optical method.
A multi-parameter station can add pH, oxygen, conductivity or turbidity where those channels help explain the process. Select the actual modules needed at that location. Shared packaging simplifies deployment, but every channel still has its own measurement limits and maintenance needs.

No. COD describes an oxygen-equivalent demand measured or estimated by a method. Dissolved oxygen describes oxygen present at the point of measurement. The two are related through process conditions but cannot be substituted for one another.
No. It is an aggregate oxygen-equivalent result, not the concentration of one substance. Compounds have different oxidation behaviour, and some inorganic reducing substances can contribute. Additional analysis is needed to identify particular contaminants.
Yes. Dilution can lower concentration while higher flow keeps the mass load unchanged. Compare concentration and matched flow before interpreting the change as treatment improvement. Use time-resolved calculations when the stream varies significantly.
No. Its UV-based estimate needs a suitable relationship to the water and the intended decision. Keep laboratory comparisons where method-specific results are required or where the sample composition changes. Online frequency and laboratory confirmation serve different purposes.
KHP is a reference compound used for COD calibration. A KHP-equivalent range describes that calibration basis rather than identifying the substances in the process. Actual wastewater agreement depends on its composition and the measurement method.
There is no universal threshold for every stream. Use the operating objective, normal variation and applicable project requirements, with allowance for measurement uncertainty. Separate an investigation alarm from an automatic control action and define how invalid data is handled.
Provide the water source, expected COD and turbidity, temperature, installation arrangement and the method used for comparison. Explain whether the value will support trend detection, process control or formal reporting. Those details determine whether an optical configuration is appropriate.
COD meaning in water quality is easiest to apply when concentration, load and measurement method remain distinct. Use COD to assess oxidizable load, DO to observe available oxygen, and paired comparisons to interpret an optical trend. NiuBoL online sensors can support continuous observation when their configuration and sample relationship match that purpose.
Prev:COD Detection Methods Water Quality Guide for Online Sensor Selection
Next:TDS Water Quality Range: How to Interpret Conductivity and TDS Monitoring
Related recommendations
Sensors & Weather Stations Catalog
 Agriculture Sensors and Weather Stations Catalog-NiuBoL.pdf
Weather Stations Catalog-NiuBoL.pdf
Agriculture Sensors Catalog-NiuBoL.pdf
Water Quality Sensor Catalog-NiuBoL.pdf
Related products
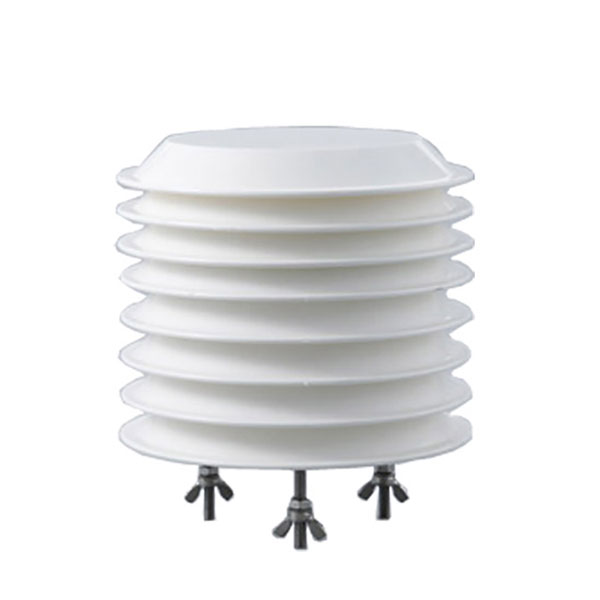 Combined air temperature and relative humidity sensor
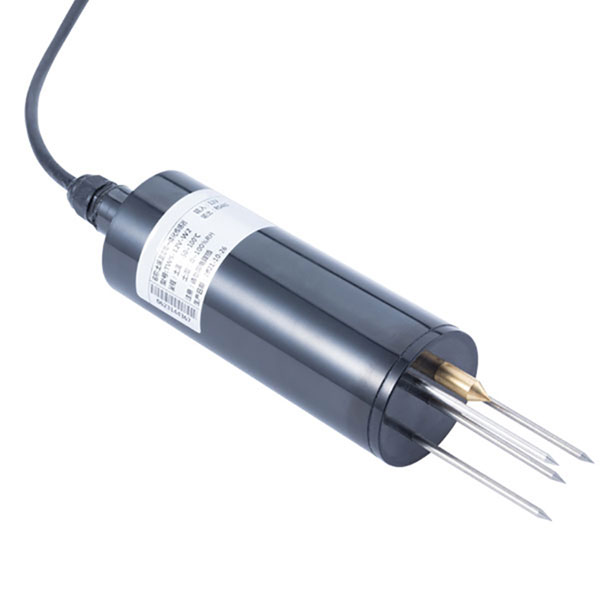 TDR Soil Moisture & Temperature Sensor for irrigation| RS485 |4-20mA| NBL-S-THR
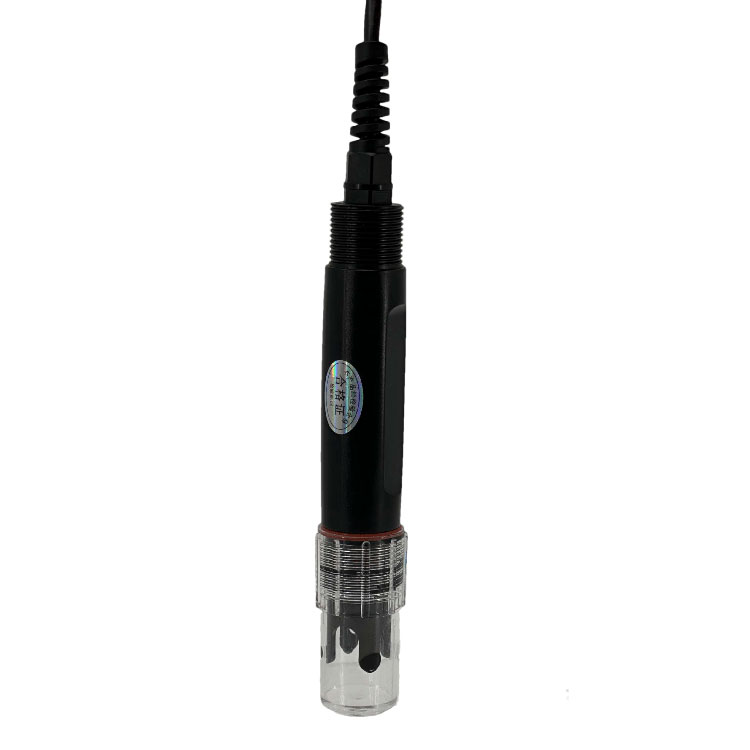 Soil pH sensor RS485 soil Testing instrument soil ph meter for agriculture |NBL-S-PH
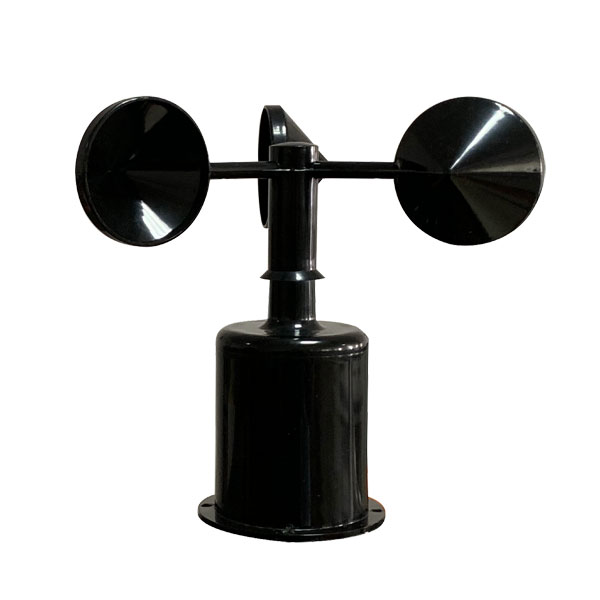 Wind Speed sensor Output Modbus/RS485/Analog/0-5V/4-20mA
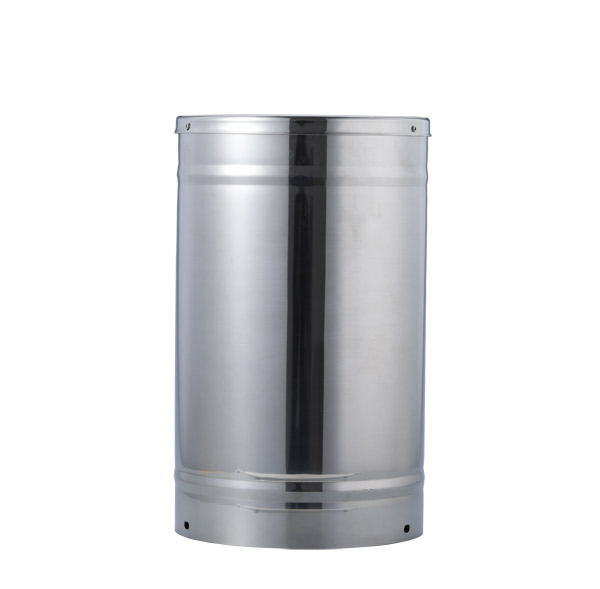 Tipping bucket rain gauge for weather monitoring auto rainfall sensor RS485/Outdoor/stainless steel
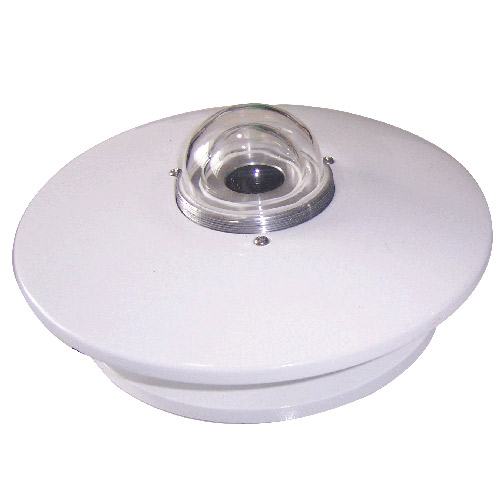 Pyranometer Solar Radiation Sensor 4-20mA/RS485


Screenshot, WhatsApp to identify the QR code
WhatsApp number:+8615367865107
(Click on WhatsApp to copy and add friends)