

— Blogs —
—Products—
 Consumer hotline +8618073152920
WhatsApp:+8615367865107
Address:Room 102, District D, Houhu Industrial Park, Yuelu District, Changsha City, Hunan Province, China
Product knowledge
Time:2026-09-16 15:00:00 Popularity:245
Select wastewater treatment station water quality instruments by process stage and the action each reading supports. Equalization, biological treatment, clarification and final discharge rarely need identical sensor packages. Put each probe where its sample represents that decision, then choose its range and method. A multi-parameter assembly is useful where several channels genuinely share one measuring point; it cannot replace instruments needed in different tanks.
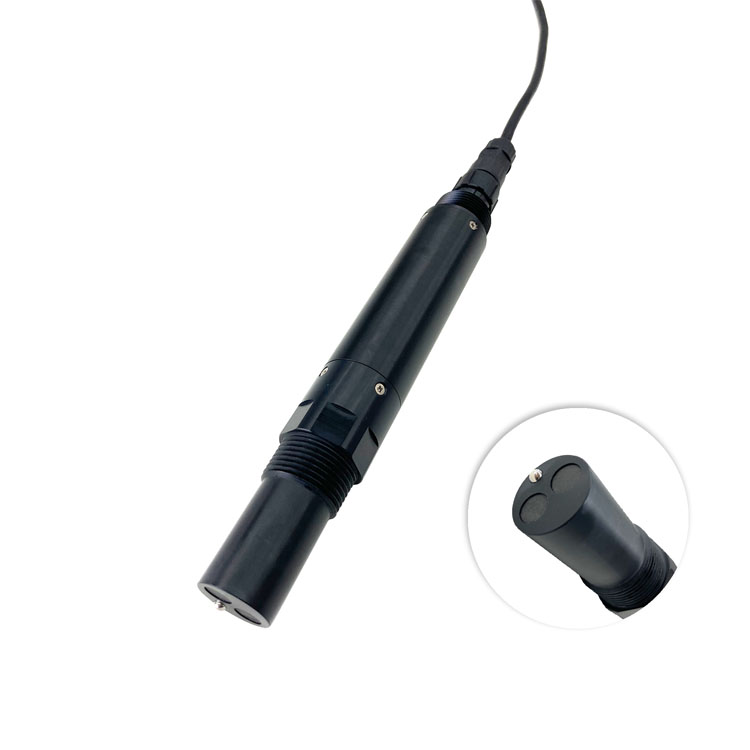
Begin with the treatment flow diagram and mark the points where an operator changes something: accepting an incoming stream, adjusting neutralization, changing aeration, investigating solids carryover or reviewing the final effluent. For each point, write the question beside the instrument tag. This exposes unnecessary channels and, more importantly, missing measurements that a generic package would overlook.
At an industrial equalization tank, conductivity can help identify a change in dissolved-ion loading. It does not identify the chemical responsible, and it cannot replace pH for neutralization control. In a municipal station with relatively stable incoming conductivity, that channel may have less operational value than reliable dissolved oxygen measurements in the biological stage. The instrument list should reflect those differences.
| Process location | Measurement to consider | Decision and limitation |
|---|---|---|
| Incoming stream or equalization | pH, conductivity, temperature; selected organic-load indicator | Identify changes before biological treatment; confirm the cause with appropriate sampling |
| Neutralization tank | pH at a representative mixed point | Support acid-base adjustment; a probe immediately beside chemical injection can misrepresent the tank |
| Aerobic biological stage | Dissolved oxygen, with ammonia or other process channels where justified | Assess oxygen availability and treatment response; one point may not represent every aeration zone |
| Anoxic stage | ORP and process-specific nitrogen measurements | Interpret redox conditions with the process design; ORP is not a direct nitrate concentration |
| Clarification or filtration outlet | TSS or turbidity, chosen for the reporting basis | Detect carryover or filtration change; optical units and dry mass are not interchangeable |
| Disinfection and final effluent | The required disinfectant residual and discharge measurements | Match the analytical method and sampling point to the site's operating and reporting requirements |
Organic-load instruments require particular care. An optical BOD estimate, optical COD estimate and laboratory BOD5 result do not describe the same test. An online estimate can provide a timely trend after a relationship has been established for the wastewater. It should not inherit the name or acceptance limits of a different analytical method simply because both results are displayed in mg/L.

Prioritize the points the operator can act on. Dissolved oxygen in the aerobic stage and a representative effluent solids measurement may be more useful than putting every available parameter in the final tank. If ammonia removal is a treatment objective, evaluate an ammonia channel at the stage where its trend can distinguish a changing load from poor treatment. Check the electrode's matrix sensitivity before using its result for a control change.
Changes in pH, conductivity, temperature and organic loading can arrive at different times. Record batch discharge and mixing conditions alongside the measurements. A probe in the equalization outlet describes what leaves that tank, not necessarily the short peak at its inlet. Additional inlet monitoring is justified when the station must identify the source or timing of a batch excursion.
The useful solids range after filtration may be much lower than in the biological basin. Select the outlet instrument for the expected effluent and the smallest change that warrants action. Keep a separate check for filter operating state or sample flow; a clear-water reading from a stagnant sample chamber does not demonstrate current filter performance.
Choose between TSS and turbidity according to the decision. A TSS sensor is evaluated against suspended-solids mass results for the actual wastewater. A turbidity channel reports optical cloudiness and can reveal a change without identifying its mass concentration. Neither channel directly measures dissolved salts or guarantees that a particle-size change will preserve an existing optical-to-mass relationship.

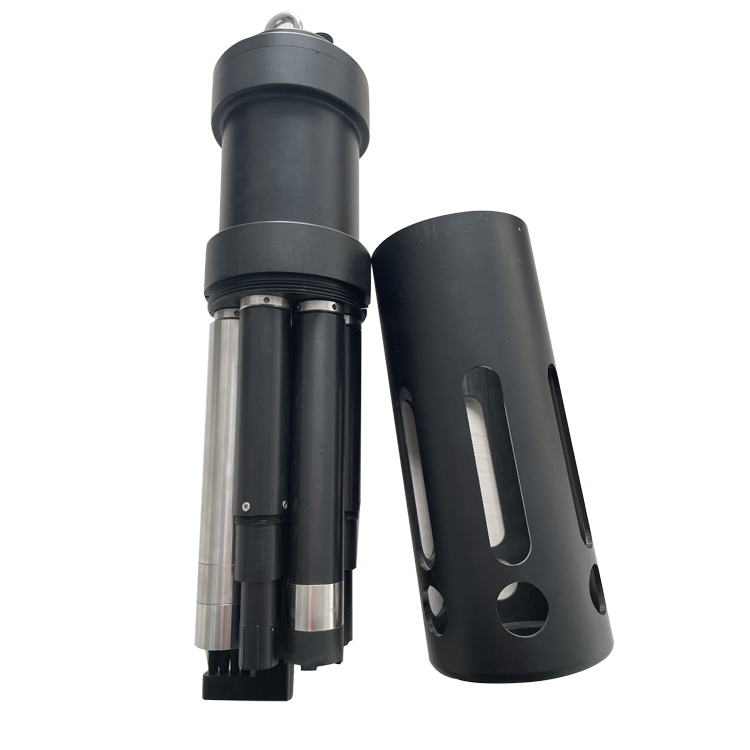
The NiuBoL NBL-WQ-MPS-5A combines selected sensors in a self-cleaning assembly for co-located measurements. It can be considered at an accessible tank or monitoring point where the configured channels share suitable water conditions. It is less suitable as the only instrument package when pH must be measured in neutralization, dissolved oxygen in aeration and turbidity after filtration.
| MPS-5A configuration item | Technical detail | Selection consequence |
|---|---|---|
| Parameter capacity | Up to eight parameters including temperature | Specify the fitted channels rather than assuming every option is included |
| Selectable measurements | Dissolved oxygen, COD, pH, ORP, conductivity/salinity, ammonia nitrogen and turbidity | Validate each selected method for the same sample location |
| pH option | 0-14 pH; +/-0.1 pH accuracy; 0.01 pH resolution | Choose service access suitable for electrode checks and calibration |
| ORP option | -1500 to +1500 mV; +/-6 mV accuracy | Interpret the result as redox potential, not a specific constituent concentration |
| Conductivity options | 0-5000 uS/cm or 0-200 mS/cm; +/-1.5% full scale | Select a range appropriate to normal readings as well as excursions |
| Temperature channel | 0-50 C measurement range; +/-0.3 C accuracy | The temperature-channel range alone does not define every module's operating limit |
| Power | 12 V DC +/-5%; 5 W at 12 V | Check voltage at the assembly and allow for the complete station load |
| Data interface | RS485, Modbus RTU | Map each fitted channel, unit and validity condition in the host |
| Cleaning and cable | Configurable automatic cleaning; standard 5 m four-core twisted-pair shielded cable | Keep inspection access; specify jacket compatibility and extensions separately |
Pressure, protection rating and wetted-material compatibility must be established for the complete ordered assembly and its modules. Do not transfer an IP68 statement or a pressure rating from a standalone probe to the entire multi-parameter installation. At a new site, compare the proposed assembly with representative water before committing to a location that is difficult to change.
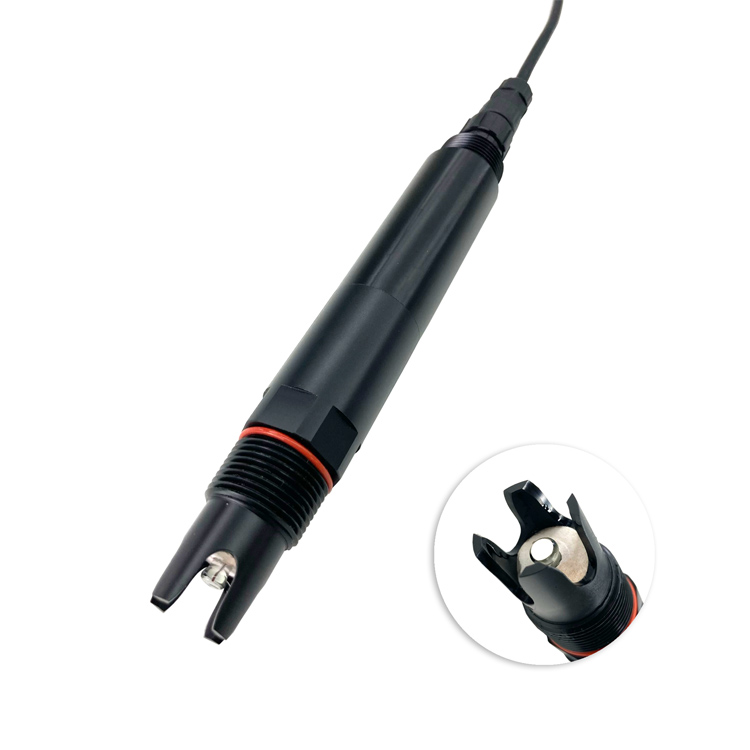
Place a pH control probe after enough mixing for the reading to represent the liquid being controlled. Chemical addition, mixing and transport create a delay between a dosing change and the measured response. Moving the probe closer to the injection nozzle can shorten the apparent delay while producing a locally extreme, misleading reading. Resolve the location with the process designer before tuning the controller.
For dissolved oxygen, examine gradients across the aeration zone and changes between operating states. Avoid a position dominated by direct bubble impingement. A commissioning survey with a suitable comparison instrument can establish whether one permanent point is representative or whether separate zones need their own probes. Do not assume a high reading near an aerator describes the far end of the basin.
For optical solids measurements, provide clearance from walls and the bottom according to the selected model, and keep the probe away from deposits and entrained air. A retractable holder or accessible bracket allows inspection without changing the measuring position each time. A cleaning brush can reduce surface deposits, but it cannot make a stagnant corner representative of the flowing process.
For wastewater treatment station water quality instruments, the PLC or RTU must distinguish a water-quality alarm from loss of measurement. A timed-out Modbus request is not a zero concentration. A channel under calibration should not continue to appear as a valid process input. Test those states on the actual receiving system, including any local display and historian.
Check units and numerical decoding separately for every instrument family. Some sensors return integer values with decimal-place information; a generic floating-point template may produce plausible but incorrect numbers. Compare the engineering value at the sensor interface with the PLC tag at more than one test condition. Where an analog output is supplied, verify its actual range assignment rather than assuming 4 mA and 20 mA represent the same limits as another probe.
Stage acceptance around the process question. Demonstrate the pH response through the relevant mixing interval, compare oxygen at the installed point, and pair optical estimates with appropriate samples. For a replacement instrument, preserve the old trend long enough to investigate differences, but do not adjust a new sensor merely to reproduce an unverified old bias.
A dedicated pH probe remains a practical choice when the neutralization point needs independent access or control availability. It can be serviced separately from an effluent multi-parameter assembly. That separation often matters more than reducing the total number of sensor housings on the purchase order.
Start with measurements tied to a defined operating action or reporting need. Mark the process points and consequences of missing each reading. There is no universal minimum package: an industrial neutralization plant and a biological treatment station have different priorities.
No. It measures the water at its installed point. It can combine compatible channels there, but it cannot represent separate tanks with different chemistry and operating conditions. Use distributed probes where the process requires separate locations.
Choose the analytical objective first. Online optical estimates can support trend monitoring after site validation; laboratory COD and BOD5 use different methods. Order both online channels only when each adds a distinct, validated decision, rather than treating two labels as independent proof of treatment performance.
No. Inspect the cleaning mechanism, sensor surfaces and sample conditions. Establish the service interval from observed fouling and comparison results. Automatic cleaning does not replace calibration, reference sampling or a safe way to retrieve the assembly.
Send the process diagram with measuring points marked, expected ranges, water composition, access conditions and existing PLC inputs. Identify which channels support control and which support investigation. This lets NiuBoL propose instruments by function instead of quoting an identical package for every tank.
Show that each channel represents its intended process point, agrees with the appropriate check method and reaches the host with correct units. Demonstrate maintenance and communication-loss states. Hand over the location-specific comparison results so operators can recognize a later change in sensor behavior.
A useful wastewater instrument schedule links each measurement to a process location and an operating decision. NiuBoL standalone probes and multi-parameter assemblies can be combined where their methods and limits fit the water. The process diagram, representative sample data and control requirements provide the basis for a configuration that operators can actually use.
Prev:Wastewater Treatment Plant Online Monitoring System: Retrofit Procurement
Next:Oil in Water Monitoring Wastewater Guide: Why It Matters and How to Specify It
Related recommendations
Sensors & Weather Stations Catalog
 Agriculture Sensors and Weather Stations Catalog-NiuBoL.pdf
Weather Stations Catalog-NiuBoL.pdf
Agriculture Sensors Catalog-NiuBoL.pdf
Water Quality Sensor Catalog-NiuBoL.pdf
Related products
 Combined air temperature and relative humidity sensor
 TDR Soil Moisture & Temperature Sensor for irrigation| RS485 |4-20mA| NBL-S-THR
 Soil pH sensor RS485 soil Testing instrument soil ph meter for agriculture |NBL-S-PH
 Wind Speed sensor Output Modbus/RS485/Analog/0-5V/4-20mA
 Tipping bucket rain gauge for weather monitoring auto rainfall sensor RS485/Outdoor/stainless steel
 Pyranometer Solar Radiation Sensor 4-20mA/RS485


Screenshot, WhatsApp to identify the QR code
WhatsApp number:+8615367865107
(Click on WhatsApp to copy and add friends)