

— Blogs —
—Products—
 Consumer hotline +8618073152920
 WhatsApp:+8615367865107
Address:Room 102, District D, Houhu Industrial Park, Yuelu District, Changsha City, Hunan Province, China
Product knowledge
Time:2026-08-10 08:05:47 Popularity:147
FDOM Sensor Selection for Source Water, River and Runoff Monitoring is written for buyers who need a working monitoring point, not a catalog comparison. The useful question is not only whether the device can measure FDOM Sensor; it is whether the selected package can survive the site, connect to the existing controller and produce data that the project team trusts after commissioning.
For NiuBoL projects, the normal selection path starts with the application environment, required output, installation method, maintenance access and data platform. Model choice comes after those conditions are clear. This approach prevents common procurement mistakes: buying a range that is too narrow, choosing a consumer interface for an industrial cabinet, or ignoring cable and mounting details until installation day.
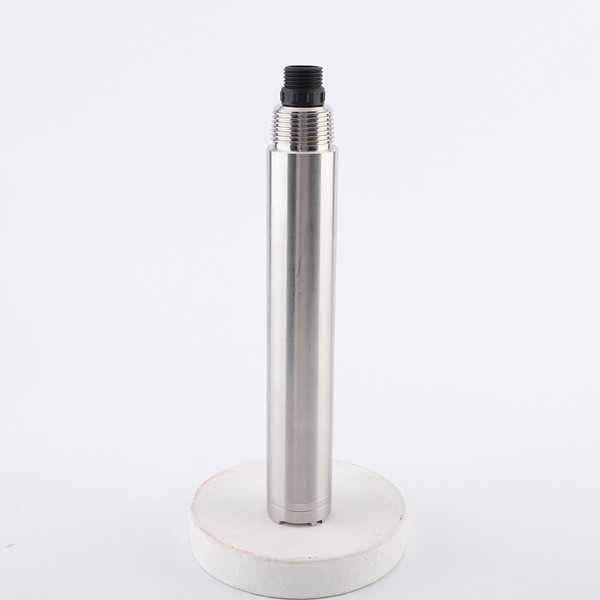
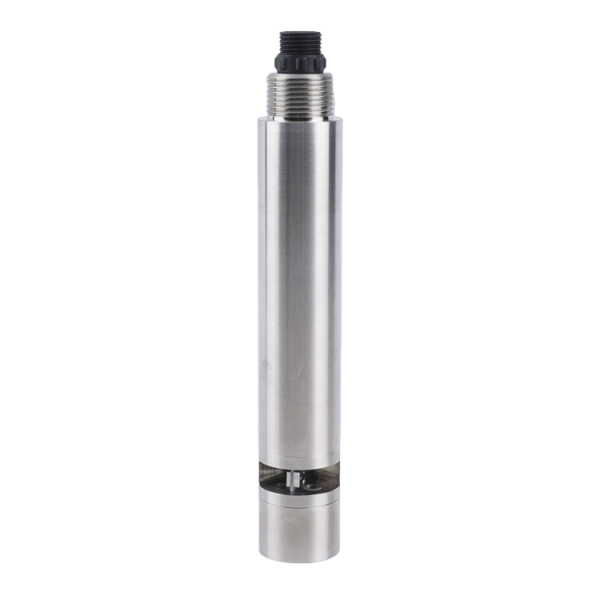
An FDOM sensor measures fluorescent dissolved organic matter and is useful when a project needs fast indication of organic inputs, runoff events or changes in source-water quality. It should be specified carefully because fluorescence is a trend signal influenced by water matrix, turbidity and algae.

NiuBoL fluorescence-based water quality sensors can be integrated into online stations with turbidity, chlorophyll, COD-related and conductivity sensors. This combination helps operators interpret whether a fluorescence increase is likely from organic inflow, algae-related change or general suspended matter interference.
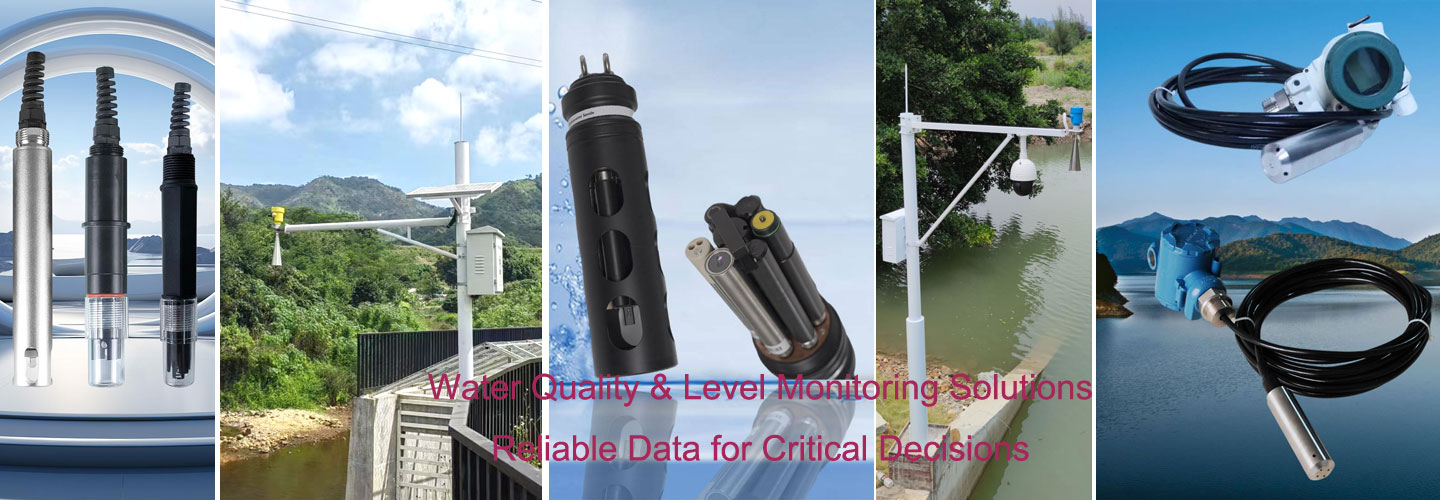
In a water quality station, the sensor is the measuring node between the water body and the data system. It connects to a controller, RTU or gateway, sends stable digital data and gives operators a continuous trend instead of isolated laboratory or handheld readings.
The practical value is highest when the sensor is specified together with power supply, cable length, mounting method, cleaning access, controller protocol and data acceptance rules. A technically correct sensor can still fail in a project if it is installed where the sample is not representative or if the data system cannot read the output reliably.
For industrial projects, RS485 Modbus RTU remains the preferred interface because it supports multi-drop wiring, long cable distance, stable register polling and direct connection to PLC, RTU, data logger or IoT gateway hardware. The buyer should confirm baud rate, parity, Modbus address, register map, unit definition and update interval before ordering.
Integration should also consider grounding, surge protection, waterproof junction boxes and separation from high-current pump or motor cables. Many field faults are not caused by the measuring element itself but by weak wiring practice, shared noisy power supplies or unprotected outdoor terminals.

| Measurement target | Fluorescent dissolved organic matter trend signal | Useful for tracking organic inputs, runoff events and source-water changes |
|---|---|---|
| Measurement method | UV fluorescence optical detection by configured sensor | Fast response with lower reagent demand than wet-chemical analysis |
| Power supply | DC 12-24 V | Compatible with remote buoy, station and cabinet power systems |
| Output signal | RS485 Modbus RTU | Supports continuous logging with other water quality parameters |
| Interference control | Turbidity, algae and colored water may require compensation or paired sensors | Prevents over-interpreting fluorescence as absolute concentration |
| Protection | IP68 optical probe or flow-through package by project | Installation method should match fouling, flow and access conditions |
FDOM is valuable for trend monitoring, but it should not be over-sold as a universal concentration measurement. Pairing it with turbidity and site sampling improves interpretation.
Field challenge: Low flow, biofilm and aeration bubbles can disturb readings.
Integration plan: Install sensors away from aerators, provide cleaning access and log DO, pH, EC or ammonia together.
User value: Operators can react before water quality stress becomes visible in stock behavior.
Field challenge: Solids, grease and changing load increase fouling risk.
Integration plan: Select industrial probes, mounting brackets and cleaning or sampling arrangements.
User value: The plant gains continuous trend alarms between laboratory sampling events.
Field challenge: Water level, debris and seasonal algae make maintenance difficult.
Integration plan: Use protected mounting, waterproof cables and Modbus data collection.
User value: The monitoring point supports early warning and long-term trend analysis.
Field challenge: Chemical background and temperature can bias readings.
Integration plan: Confirm wetted materials, temperature compensation and calibration method before order.
User value: The project avoids sensor mismatch and reduces commissioning delays.
Use FDOM monitoring for source-water protection, river runoff events, watershed warning and process intake control where fast change detection is valuable. Use laboratory TOC or COD sampling when the project needs certified absolute values.
Select the optical path, cleaning method and installation depth according to fouling and sunlight exposure. In high-turbidity water, compensation or paired measurements are important.
Provide monitoring purpose, expected organic matter source, turbidity range, algae risk, installation method, cable distance, power supply, output protocol and whether the station will include turbidity, chlorophyll or COD-related sensors.
Commissioning should include baseline recording, comparison with site samples, cleaning check, Modbus communication verification and definition of alert thresholds based on local history.
An FDOM sensor is not the right choice if the buyer only needs pH or salinity control. It is also weak where the water matrix changes so much that no local correlation can be maintained.
A system integrator can use the article to define signals, Modbus communication, mounting and commissioning checks. A distributor can use it to qualify customer requirements before asking for a price. A project owner can use it to compare complete packages rather than isolated devices. A purchasing team can use the RFQ checklist to reduce revisions and avoid missing accessories.
FDOM is strong for detecting change, especially when a water source receives runoff, wastewater influence or organic-rich inflow. It is weaker when buyers expect it to behave like a universal concentration meter. The project should build a local baseline and compare fluorescence changes with rain events, turbidity, temperature and occasional laboratory samples.
In source-water protection, the practical value is response time. If the FDOM trend rises quickly, operators can increase sampling, change intake strategy or investigate upstream activity. For this purpose, the sensor does not need to replace laboratory TOC; it needs to provide stable early warning and a clear maintenance routine.
For rivers and lakes, installation should avoid direct sunlight on the optical window, heavy sediment impact and areas where floating debris can strike the probe. A protective bracket and cleaning access may matter more than a small difference in nominal optical resolution.
FDOM monitoring should begin with baseline collection. During the first operating period, record normal dry-weather values, rainfall response, turbidity changes and any known upstream discharge events. This baseline makes later alarms more meaningful because the operator can compare new events with site history rather than a generic threshold.
A stronger station pairs FDOM with turbidity, temperature, conductivity and sometimes chlorophyll or COD-related monitoring. The combined data helps separate organic inflow from algae growth or sediment disturbance. For project owners, this reduces false conclusions and makes reports easier to defend.
A clear FDOM procurement file should state that the sensor is for fluorescence trend monitoring of dissolved organic matter, not a universal laboratory replacement. It should also name supporting parameters, cleaning method, mounting depth, expected turbidity range, data output and alarm review process. This prevents over-promising and gives the supplier enough information to recommend the right optical package.
For procurement comparison, ask suppliers how the sensor should be cleaned, how baseline drift is checked and how data should be interpreted during heavy rain. These questions are more useful than comparing only optical wavelength or housing material, because the site result depends on operation as much as hardware.
Q1: Why should an online water quality sensor be selected differently from a handheld meter?
A: A handheld meter is designed for spot checks. An online sensor must handle continuous immersion, cable routing, cleaning, Modbus communication, power stability and maintenance access. Procurement should compare the complete monitoring loop, not only the measuring range.
Q2: Is RS485 Modbus RTU required for all water quality projects?
A: It is not mandatory, but it is the practical default for industrial monitoring because many PLCs, RTUs, data loggers and gateways can read Modbus registers directly. Analog output is useful only when the controller has limited inputs.
Q3: What information is needed before selecting a sensor range?
A: Provide expected minimum and maximum values, water type, temperature, salinity or chemical background, flow condition, installation method and alarm thresholds. Without this information, the selected range may have poor resolution or overload.
Q4: How should sensors be installed in channels or tanks?
A: Install the probe where water is representative and moving enough to avoid stagnant deposits. Avoid bubbles, direct chemical dosing points, dead zones and locations where maintenance staff cannot safely remove the sensor.
Q5: What causes unstable online readings?
A: Common causes include fouling, bubbles, poor grounding, long unshielded cables, incorrect Modbus settings, insufficient warm-up, missing temperature compensation and calibration that does not match the site water.
Q6: What affects quotation for a complete monitoring point?
A: Cost depends on sensor model, range, cable length, mounting bracket, cleaning device, controller, solar power, cabinet, communication gateway, calibration accessories and spare parts.
Q7: When should sample pretreatment be added?
A: Use pretreatment when the water has heavy solids, grease, pressure fluctuation, high temperature or aggressive chemicals that would damage an immersed probe or make cleaning too frequent.
Q8: What should be checked during acceptance?
A: Check wiring, power voltage, Modbus address, register values, calibration record, comparison with a reference sample, alarm output, data upload and whether the maintenance method is practical.
An FDOM sensor is strongest as an early-warning and trend-monitoring tool. For project value, specify it with the right optical installation, RS485 data integration, cleaning plan and supporting parameters.
If the model is not obvious, send NiuBoL the site water or soil condition, expected measuring range, controller interface, power supply, installation method, cable length, quantity and project schedule. With those details, the quotation can match the engineering requirement instead of only naming a product.
Prev:TOC Sensor Selection for Online Organic Pollution Monitoring Projects
Next:Online Ammonia Nitrogen Sensor Range, Installation and Maintenance Guide
Related recommendations
Sensors & Weather Stations Catalog
 Agriculture Sensors and Weather Stations Catalog-NiuBoL.pdf
Weather Stations Catalog-NiuBoL.pdf
Agriculture Sensors Catalog-NiuBoL.pdf
Water Quality Sensor Catalog-NiuBoL.pdf
Related products
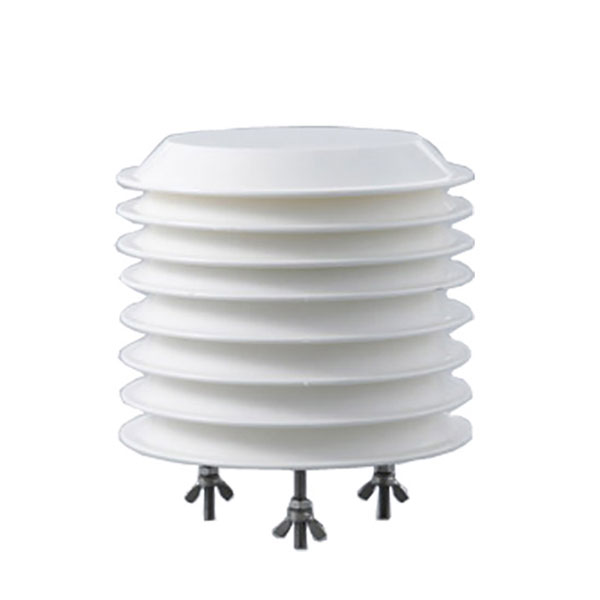 Combined air temperature and relative humidity sensor
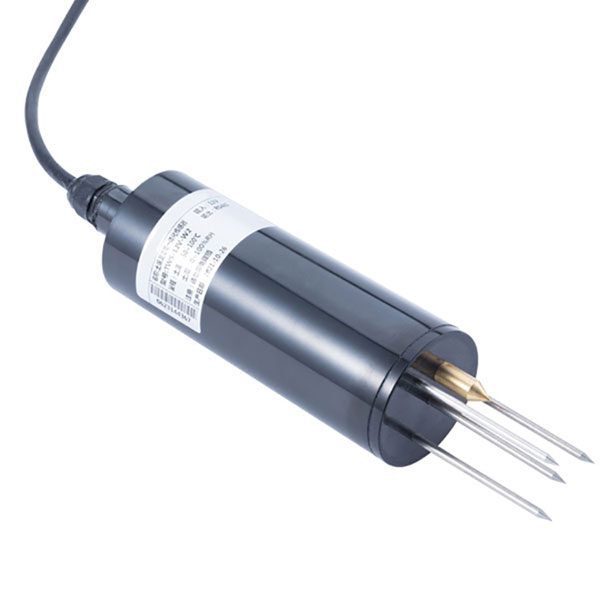 TDR Soil Moisture & Temperature Sensor for irrigation| RS485 |4-20mA| NBL-S-THR
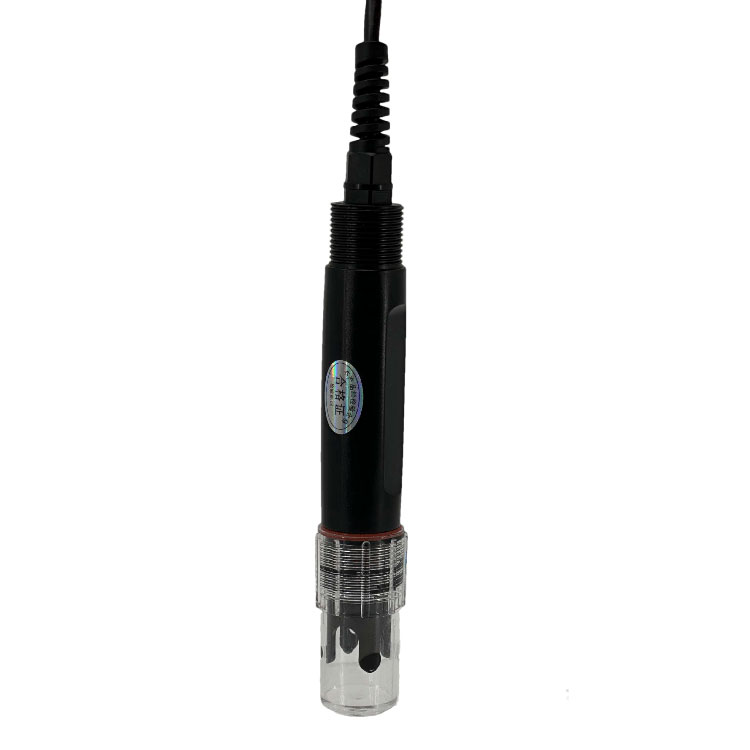 Soil pH sensor RS485 soil Testing instrument soil ph meter for agriculture |NBL-S-PH
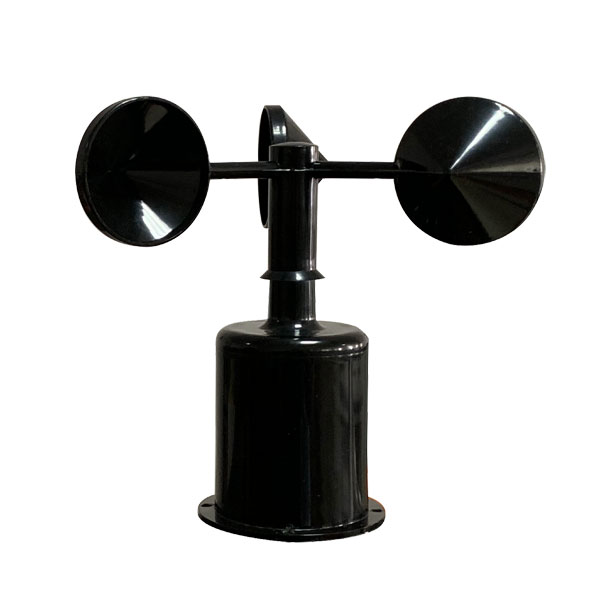 Wind Speed sensor Output Modbus/RS485/Analog/0-5V/4-20mA
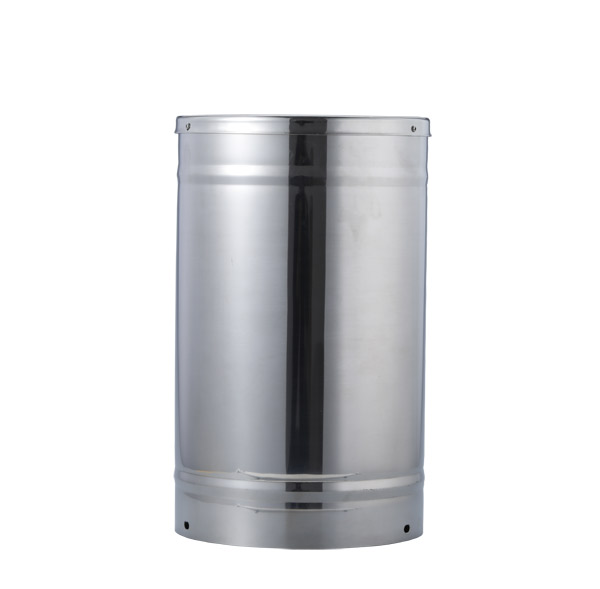 Tipping bucket rain gauge for weather monitoring auto rainfall sensor RS485/Outdoor/stainless steel
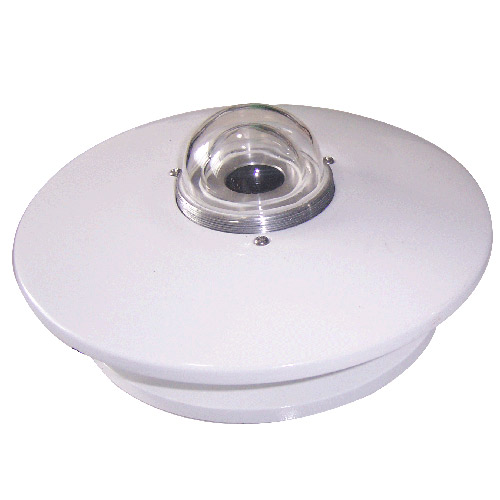 Pyranometer Solar Radiation Sensor 4-20mA/RS485

Screenshot, WhatsApp to identify the QR code
WhatsApp number:+8615367865107
(Click on WhatsApp to copy and add friends)