

— Blogs —
—Products—
 Consumer hotline +8618073152920
 WhatsApp:+8615367865107
Address:Room 102, District D, Houhu Industrial Park, Yuelu District, Changsha City, Hunan Province, China
Product knowledge
Time:2026-07-08 16:11:17 Popularity:263
A scenic area negative oxygen ion monitoring system helps parks turn environmental quality into visible, measurable data. Forest parks, wetlands, botanical gardens and eco-tourism sites often promote fresh air, but buyers need more than a slogan. They need continuous monitoring, reliable sensors, platform records, LED display and maintainable installation.
NiuBoL negative oxygen ion monitoring systems can collect negative oxygen ion concentration, temperature, humidity, PM2.5 and other environmental parameters, transmit data through GPRS/4G/5G or internet networks, and publish results through software platforms and LED displays. This is useful for scenic area management, ecological assessment and visitor information release.
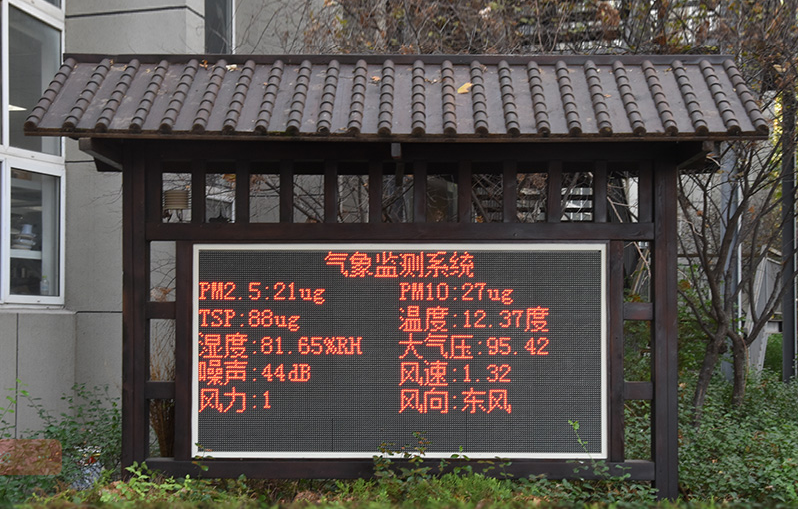
Many scenic areas want to show ecological value but lack continuous data. Manual sampling is not enough for daily display or long-term trend analysis. An online monitoring station solves this by collecting data automatically, storing historical curves and presenting air quality indicators to managers and visitors.
| System Element | Function | Buyer Value |
|---|---|---|
| Negative oxygen ion sensor | Measures air negative ion concentration | Core ecological freshness indicator |
| Temperature and humidity sensor | Records comfort and microclimate | Helps interpret ion concentration changes |
| PM2.5 sensor | Monitors particulate matter | Prevents one-sided air quality display |
| Wind speed and direction | Shows air flow and diffusion condition | Useful for site interpretation |
| 4G/5G or internet transmission | Sends data to platform | Supports remote operation |
| LED display | Shows data to visitors | Turns monitoring into visible visitor service |
| Modular structure | Allows sensor replacement and expansion | Reduces future maintenance difficulty |
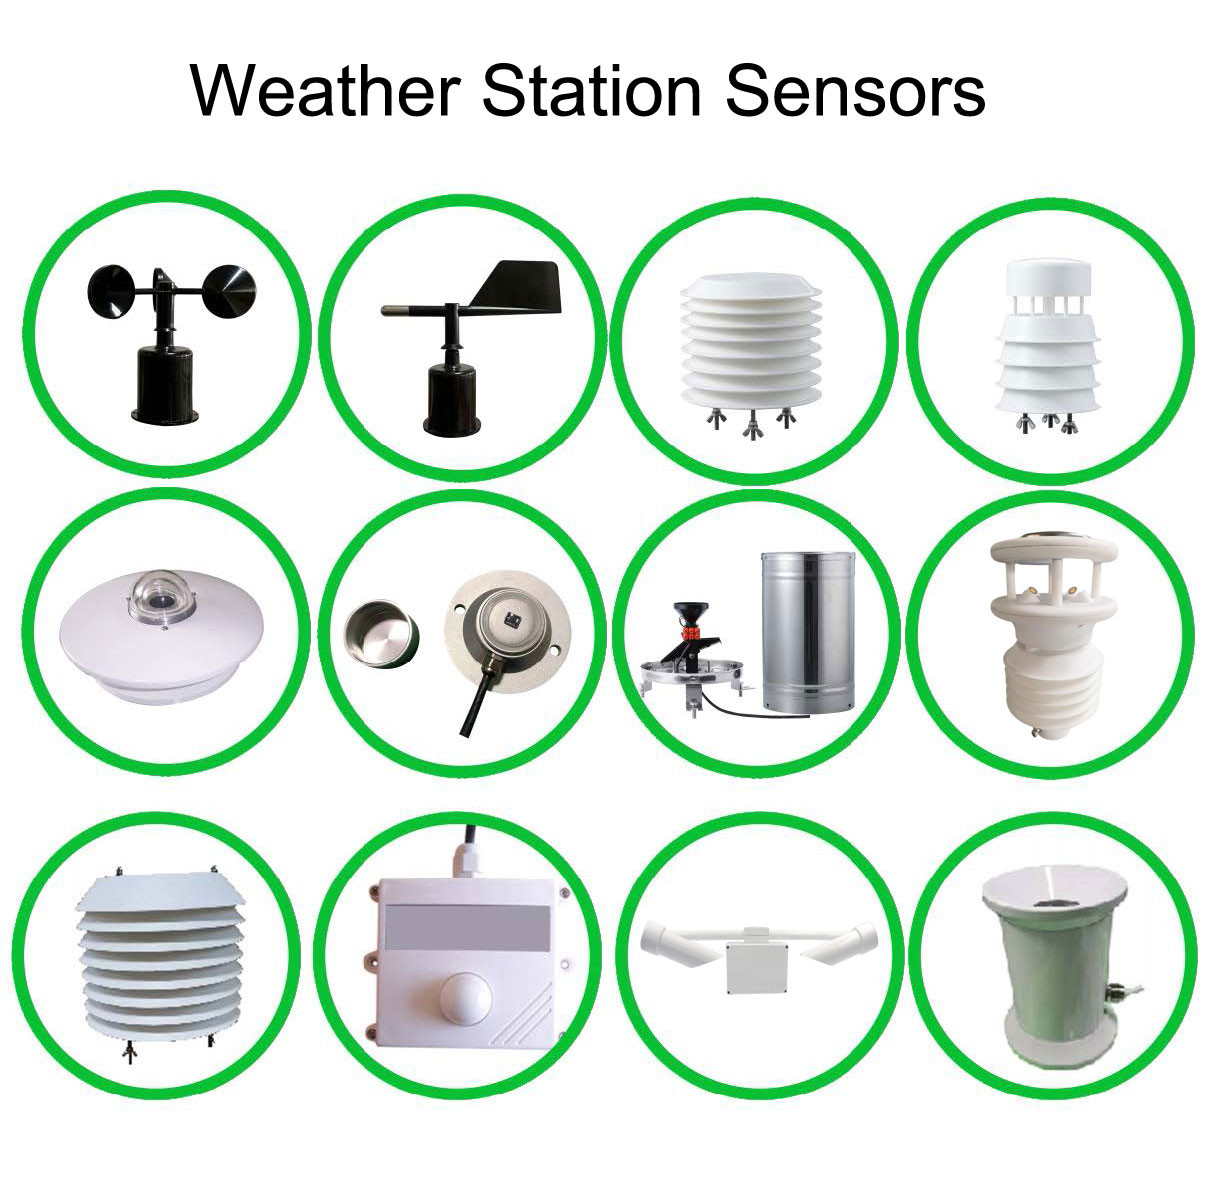
This solution is suitable for forest parks, scenic tourist attractions, ecological wetlands, botanical gardens, health tourism areas, nature education bases and municipal ecological parks. It is less suitable if the buyer only needs a one-time handheld test. For public display, seasonal trend analysis or multi-point park management, online monitoring is the better choice.
For visitor display: choose negative oxygen ion, PM2.5, temperature, humidity and LED screen.
For ecological research: add wind, rainfall, radiation and long-term data export.
For large scenic areas: use multiple stations and a cloud platform map.
For remote locations: consider solar power and 4G/5G communication.
For maintenance-sensitive projects: choose modular sensors and accessible brackets.
Price depends on monitoring parameters, station quantity, LED screen size, power method, communication method, bracket or pole design, platform functions, installation support and whether data must connect to an existing scenic area system. Customization can include parameter set, display layout, logo, alarm thresholds, platform account structure and data export format.
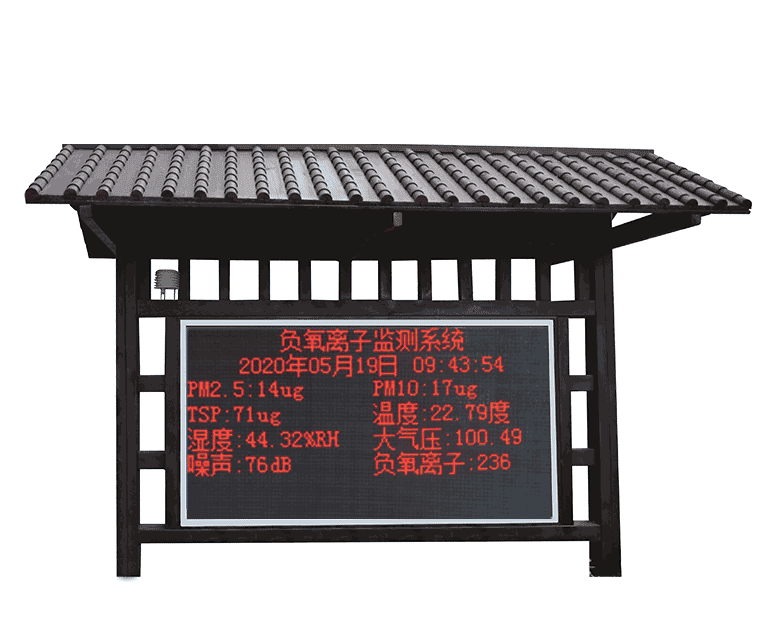
Negative oxygen ion data is most useful when it is connected to site management. Scenic areas can compare forest trails, wetland points, viewing platforms and visitor centers. If one area has stronger air freshness indicators, the park can use the data for visitor guidance, route planning and ecological education.
The data should not be displayed without context. Temperature, humidity and PM2.5 should be shown together when possible, because visitors and managers need to understand whether air quality is fresh, humid, dusty or affected by weather.
LED screen position visible to visitors.
Cloud dashboard for managers.
Historical trend curves for ecological reporting.
Alarm thresholds for PM or equipment faults.
Export format for weekly or monthly reports.
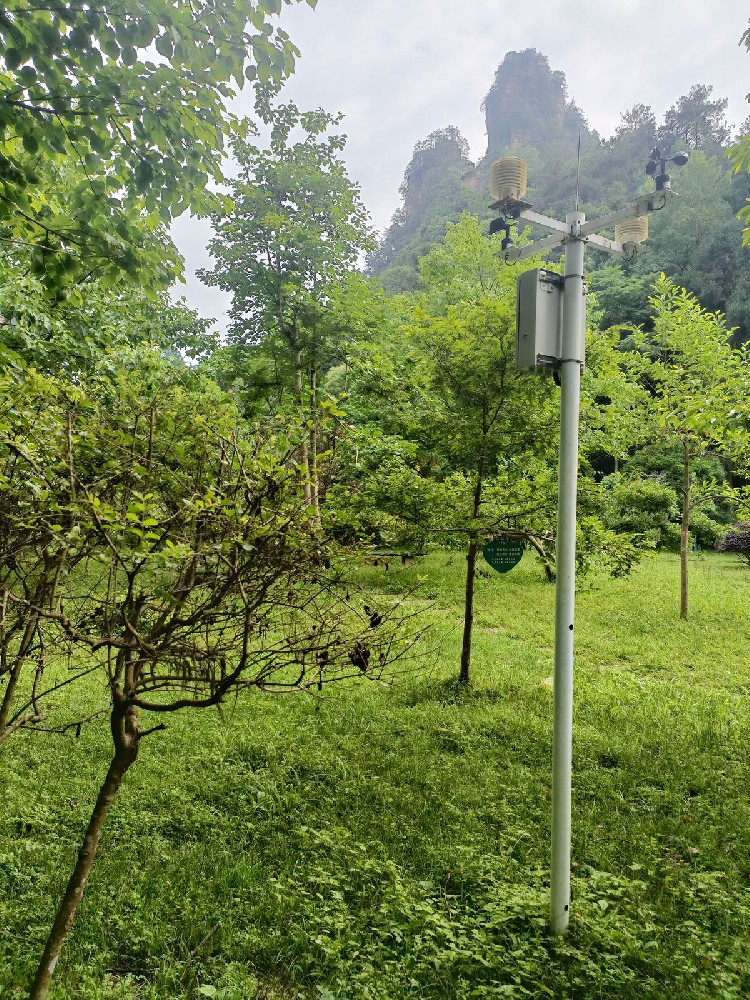
The system is suitable when the scenic area wants continuous environmental display, ecological evaluation or multi-point management. It is not necessary if the buyer only wants one marketing photo or a one-time air quality check. In that case, a handheld instrument is enough.
For public display, avoid showing negative oxygen ion data alone. Visitors understand the data better when PM2.5, temperature and humidity are displayed together. Managers also need historical curves, not only real-time numbers.
One station is enough only when the site is small and the goal is basic display. Larger scenic areas usually need several points because forest trails, waterfalls, wetlands, visitor centers and parking areas have different air conditions. Negative oxygen ion concentration can change with vegetation, humidity, wind, water flow and tourist density. A single value at the entrance cannot represent the whole park.
A practical layout often uses one display point near the visitor center and several monitoring points in ecological areas. Managers can compare locations and publish representative data. If the scenic area wants to build a natural oxygen bar brand, historical data from multiple points is more convincing than one occasional measurement.
Visitors do not need a complicated technical dashboard. A public LED screen should show negative oxygen ions, PM2.5, temperature, humidity and possibly a simple comfort or air quality message. Managers, however, need more detailed platform functions: historical curves, station status, data export, alarm records and device maintenance reminders.
For tourism projects, data credibility matters. The system should collect continuously and keep historical records. If the display only shows a manually entered number, visitors and authorities cannot treat it as reliable environmental monitoring.
Confirm whether the project needs public display, internal management or ecological reporting.
Decide the number of monitoring points from the site map and visitor route.
Select power method: mains, DC or solar according to site conditions.
Confirm communication: 4G/5G, Ethernet or local network.
Ask whether the platform supports logo, map view, multi-station comparison and data export.
The monitoring system can support daily operation in several ways. The visitor center can display real-time environmental data. The management office can compare historical curves and identify which areas have stronger ecological air indicators. Maintenance staff can receive device alarms. Marketing teams can use long-term data to support ecological tourism communication without relying only on subjective descriptions.
For wetland parks and forest parks, multi-point monitoring also helps ecological management. If negative oxygen ion concentration changes together with vegetation, humidity or particulate matter, managers can use the trend as one reference for vegetation restoration, visitor flow planning and environmental education.
A practical implementation starts with site survey, then parameter selection, station location planning, power and communication confirmation, LED display layout, platform account setup and acceptance testing. The station should be installed where airflow is representative and maintenance is possible. A beautiful location is not always a good measurement location.
Some scenic projects fail because the system is treated only as an LED screen. The display is useful, but the real value is continuous data collection. The platform should keep historical records, compare stations, show device status and allow export. Otherwise the scenic area cannot use the data for ecological reports, maintenance or long-term brand support.
A buyer should ask to see the management platform before ordering. The screen shown to visitors and the dashboard used by managers should serve different purposes.
If the scenic area plans to publish data publicly, confirm the display language, logo, data refresh interval and whether the platform can export monthly reports. These details make the system useful for both visitor service and internal management.
For a scenic area project, choose the configuration that matches the public communication plan. If data will be shown on LED screens, include display design and refresh logic. If data will be used for ecological reports, include historical export and multi-point comparison. If the project is mainly for internal park management, platform alarms and maintenance status may matter more than a large screen.
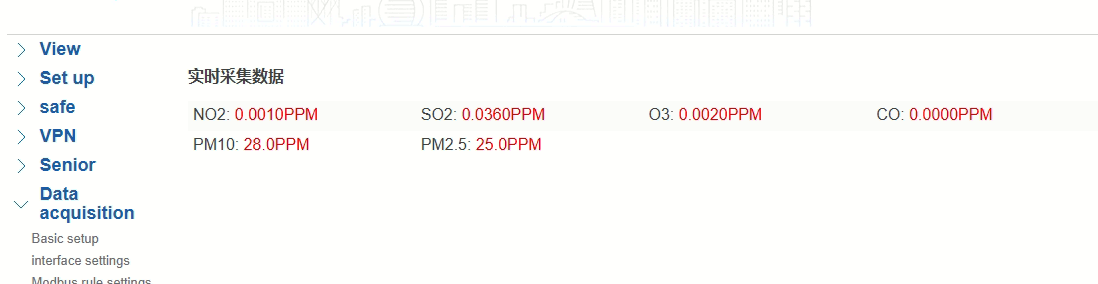
A: It is an online monitoring station that measures negative oxygen ions and related environmental parameters and displays or uploads the data.
A: They are commonly used as an ecological air freshness indicator and can support visitor information and environmental assessment.
A: Yes. Data can be shown through LED display, platform dashboard or mobile access depending on configuration.
A: Negative oxygen ion concentration, temperature, humidity and PM2.5 are common. Wind, rainfall, radiation and gases can be added.
A: Yes. Online stations are designed for continuous automatic collection and transmission.
A: Yes. Modular structure allows sensors and communication options to be added or replaced.
A: Parameter quantity, station quantity, LED display, power, communication, platform and installation affect price.
A: Yes, with solar power and wireless communication if local conditions allow.
A: Check representative location, airflow, power, network signal, display position and maintenance access.
A: Send site map, monitoring purpose, required parameters, display requirement, power condition, communication condition and number of points.
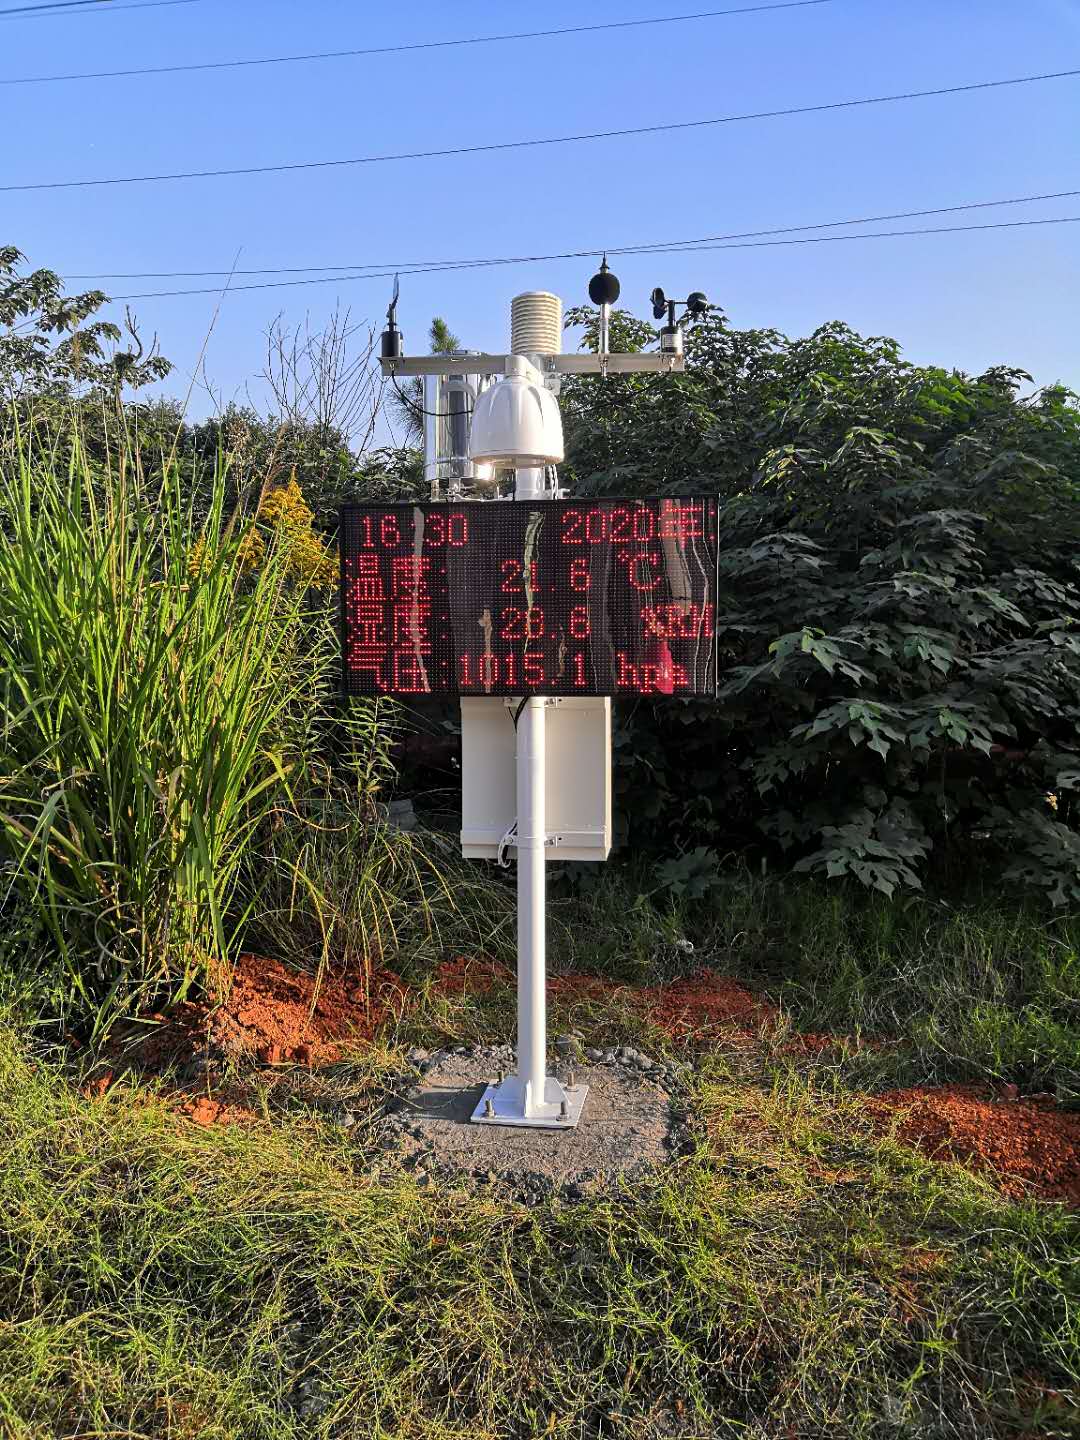
A scenic area negative oxygen ion monitoring system is useful when the buyer needs continuous ecological air data, public display and management records. The right configuration should match the park's visitor service, environmental monitoring and maintenance capacity.
Prev:Greenhouse Steel Frame Buying Guide: How to Avoid Weak Structures and Costly Rework
Next:Negative Oxygen Ion Sensor Manufacturer Selection Guide: Principle, Accuracy, and Industrial Use
Related recommendations
Sensors & Weather Stations Catalog
 Agriculture Sensors and Weather Stations Catalog-NiuBoL.pdf
Weather Stations Catalog-NiuBoL.pdf
Agriculture Sensors Catalog-NiuBoL.pdf
Water Quality Sensor Catalog-NiuBoL.pdf
Related products
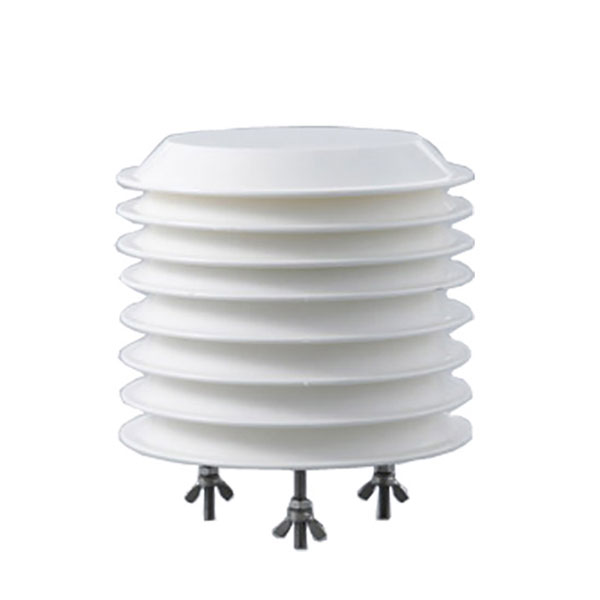 Combined air temperature and relative humidity sensor
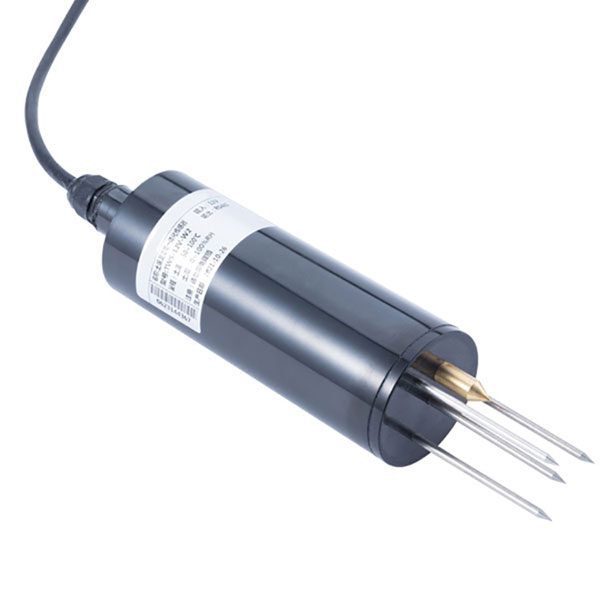 TDR Soil Moisture & Temperature Sensor for irrigation| RS485 |4-20mA| NBL-S-THR
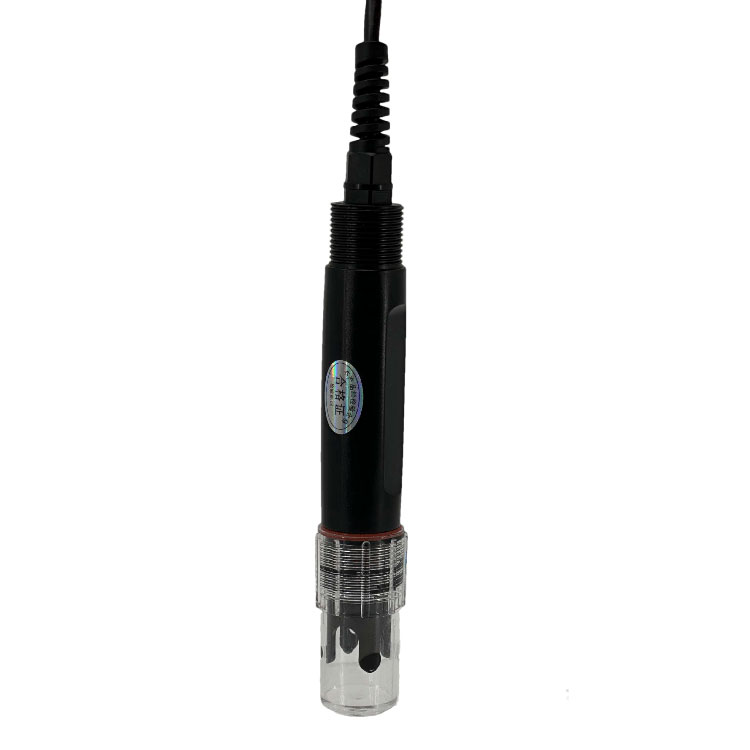 Soil pH sensor RS485 soil Testing instrument soil ph meter for agriculture |NBL-S-PH
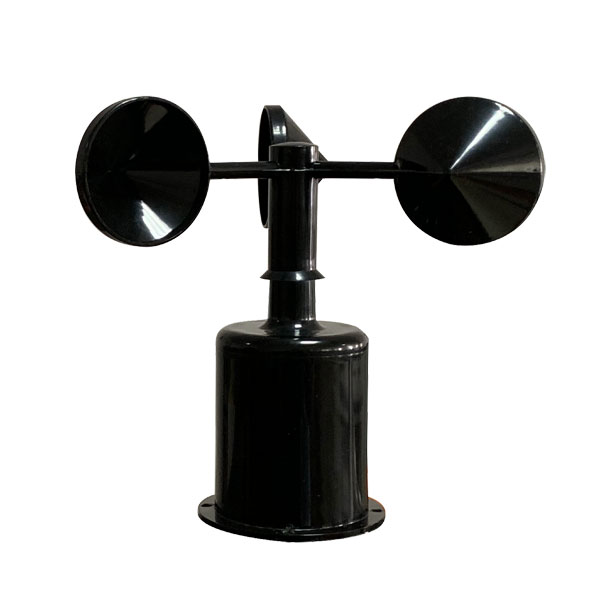 Wind Speed sensor Output Modbus/RS485/Analog/0-5V/4-20mA
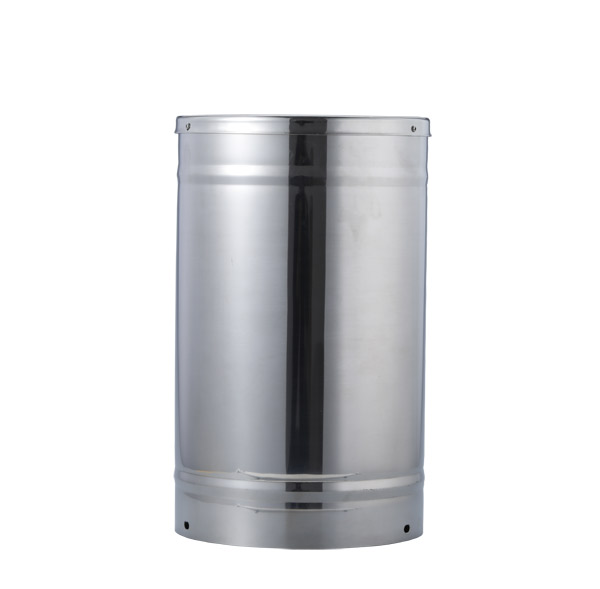 Tipping bucket rain gauge for weather monitoring auto rainfall sensor RS485/Outdoor/stainless steel
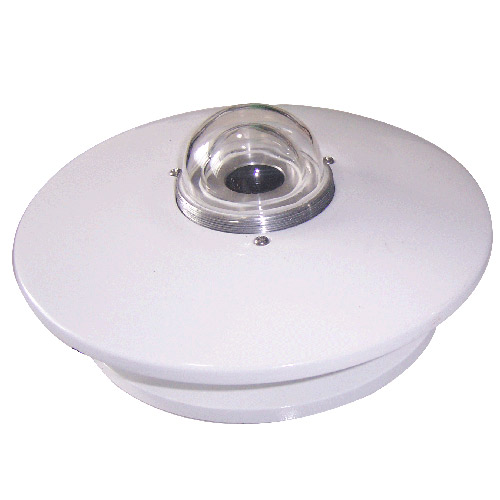 Pyranometer Solar Radiation Sensor 4-20mA/RS485

Screenshot, WhatsApp to identify the QR code
WhatsApp number:+8615367865107
(Click on WhatsApp to copy and add friends)