


— Blogs —
—Products—
 Consumer hotline +8618073152920
 WhatsApp:+8615367865107
Address:Room 102, District D, Houhu Industrial Park, Yuelu District, Changsha City, Hunan Province, China
Product knowledge
Time:2026-09-02 11:00:00 Popularity:196
An RFQ for sudden total phosphorus increase can look complete and still fail on site. The underlying problem is that chemical dosing, sludge carryover, influent change, poor settling and sampling errors can cause a sudden TP increase.
The project decision is to check solids and process events before changing coagulant dose. Define the measurement role, installation inputs and handover evidence around one constraint: a spectral TP trend or laboratory value must be interpreted with turbidity, TSS, flow and treatment history.
Particulate phosphorus can rise when biological solids escape the clarifier.
A low chemical dose, wrong pH or poor mixing can reduce phosphorus precipitation.
Matched TP, turbidity and TSS data help distinguish dissolved-treatment failure from solids carryover.
Together, these conditions define the engineering question for wastewater effluent: whether the proposed measurement and system scope can check solids and process events before changing coagulant dose.
| Project item | What the specification should state |
|---|---|
| Operating problem | Chemical dosing, sludge carryover, influent change, poor settling and sampling errors can cause a sudden TP increase. |
| Required decision | Check solids and process events before changing coagulant dose. |
| Method boundary | A spectral TP trend or laboratory value must be interpreted with turbidity, TSS, flow and treatment history. |
| Minimum evidence for total phosphorus outlet monitoring | Matched readings, installation record, units, timestamps and a documented acceptance method for the diagnostic measurement. |
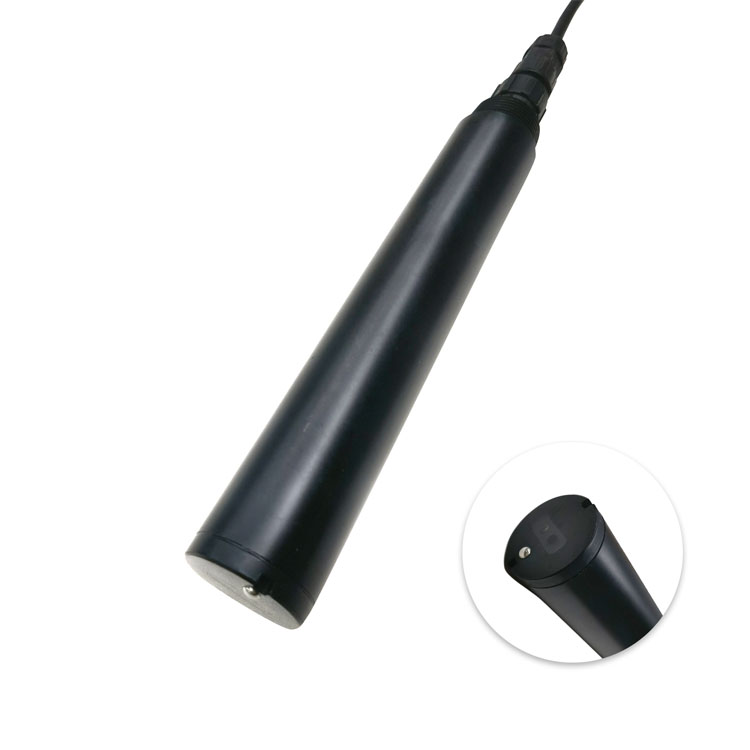
In the Sudden Total Phosphorus Increase at Wastewater Outlets acceptance plan, in a NiuBoL project, the multi-parameter assembly creates the field value. For the Sudden Total Phosphorus Increase at Wastewater Outlets measuring point, the controller applies units and scaling, while the PLC, RTU or logger transfers status and readings to the operating platform. The purchase order for total phosphorus outlet monitoring should assign every system layer to a named supplier. For context, Particulate phosphorus can rise when biological solids escape the clarifier.
When integrating Sudden Total Phosphorus Increase at Wastewater Outlets, a Modbus connection is complete only after the integrator verifies serial settings, register meaning, units and timeout behavior. Cable routing, earthing and surge protection for the wastewater effluent point remain field-installation responsibilities.
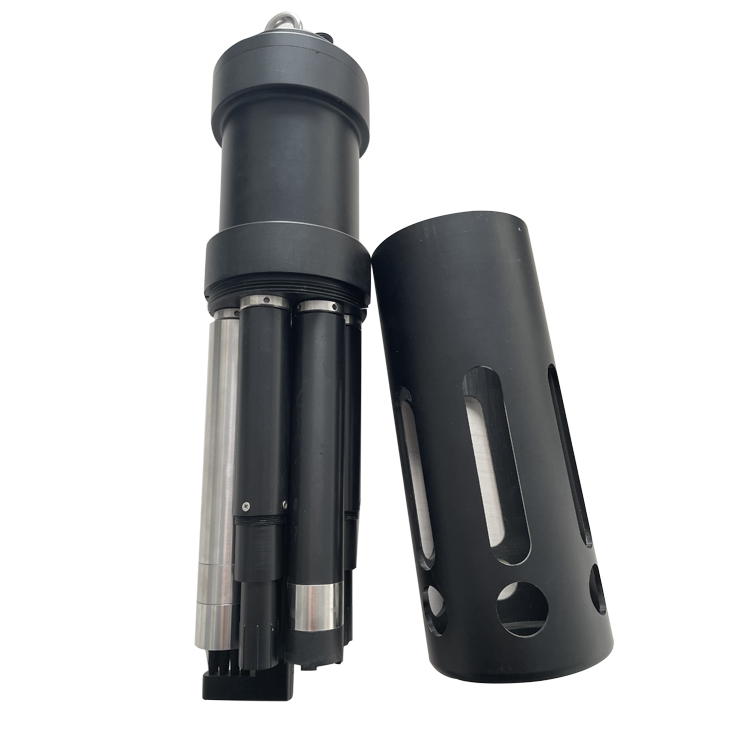
For sudden total phosphorus increase, the table uses the current NBL-WQ-MPS-5A self-cleaning sensor manual as a verified reference. It defines a realistic engineering option for wastewater effluent; it does not remove the project constraint described above. The proposed model, range and accessories should be confirmed against the quotation and project water data.
| Parameter | Verified reference |
|---|---|
| Reference model | NBL-WQ-MPS-5A |
| Capacity for total phosphorus outlet monitoring | Up to 8 parameters including temperature |
| Optional parameters for total phosphorus outlet monitoring | DO, COD, pH, ORP, conductivity/salinity, ammonia nitrogen and turbidity |
| DO | 0-20 mg/L; +/-2%; 0.01 mg/L |
| pH | 0-14 pH; +/-0.1 pH; 0.01 pH |
| ORP | -1500 to +1500 mV; +/-6 mV; 1 mV |
| Output | RS485, Modbus RTU |
| Cleaning — total phosphorus outlet monitoring | Configurable automatic cleaning |
| Power | 12 VDC +/-5%; 5 W at 12 V |
| Cable | 5 m standard; customizable |
For work in wastewater effluent, nominal accuracy is only one part of suitability.

Field challenge: Particulate phosphorus can rise when biological solids escape the clarifier. At this stage, the engineering risk is that chemical dosing, sludge carryover, influent change, poor settling and sampling errors can cause a sudden TP increase.
Selection of Sudden Total Phosphorus Increase at Wastewater Outlets should begin with the measurement duty, site condition and receiving-system interface. System integration: The commissioning team should preserve raw values, timestamps, operator actions and companion parameters before anyone cleans or recalibrates the instrument.
The total phosphorus outlet monitoring record should give the owner a defensible event timeline. This creates a documented basis for the decision to check solids and process events before changing coagulant dose.
Field challenge: A low chemical dose, wrong pH or poor mixing can reduce phosphorus precipitation. At this stage, the engineering risk is that site conditions can alter the diagnostic measurement before the operator sees it.
System integration: The commissioning team should inspect the exposure, flow, fouling, supply and RS485 record for the multi-parameter assembly, then compare the symptom with the event shape.
The total phosphorus outlet monitoring workflow should give the owner a ranked fault diagnosis supported by field evidence. This reduces exposure to the stated problem: chemical dosing, sludge carryover, influent change, poor settling and sampling errors can cause a sudden TP increase.
Field challenge: Matched TP, turbidity and TSS data help distinguish dissolved-treatment failure from solids carryover. At this stage, the engineering risk is that a spectral TP trend or laboratory value must be interpreted with turbidity, TSS, flow and treatment history.
The required class of Sudden Total Phosphorus Increase at Wastewater Outlets depends on whether the project needs continuous data, remote alarms or documented handover records. System integration: The commissioning team should repeat a synchronized reference check after the identified cause is corrected and retain both the as-found and as-left records.
User value: The owner receives proof that the correction restored trustworthy data. The conclusion remains subject to this stated constraint: a spectral TP trend or laboratory value must be interpreted with turbidity, TSS, flow and treatment history.
Acceptance for the diagnostic measurement must cover installation, stable response, unit, range, communications, alarms and the comparison method. A displayed total phosphorus outlet monitoring value confirms data transfer but does not by itself prove measurement quality.
The total phosphorus outlet monitoring comparison method must use the same parameter definition and reporting basis. Within the Sudden Total Phosphorus Increase at Wastewater Outlets supply scope, record sample time, location, temperature and preparation so disagreement with the multi-parameter assembly can be investigated instead of argued from unmatched data. For context, A low chemical dose, wrong pH or poor mixing can reduce phosphorus precipitation.
Installation quality is part of measurement quality for Sudden Total Phosphorus Increase at Wastewater Outlets, so exposure and service access must be checked together. Record the as-built cable route, device address, Modbus settings, scaling, alarm tests and responsible service contact. In the Sudden Total Phosphorus Increase at Wastewater Outlets acceptance plan, include evidence that the point recovers correctly after power and network interruption.
For the multi-parameter assembly, send water source, routine and maximum values, temperature, pressure, pH, conductivity or salinity, solids, fouling condition, drawing, cable length, power, output and number of points. State the required decision: check solids and process events before changing coagulant dose.
Commercial scope data for wastewater effluent should cover quantity, destination, delivery date, documentation language, packaging, spares, calibration accessories and commissioning. When integrating Sudden Total Phosphorus Increase at Wastewater Outlets, custom cable, analog output, holder, flow cell or gateway can affect price and lead time.
Review total phosphorus with turbidity, TSS, clarifier blanket, return-sludge condition and recent hydraulic events. A simultaneous TP and solids increase points first toward carryover or sampling disturbance. A TP increase without a solids change shifts attention toward chemical dose, mixing, pH, biological release or a new dissolved load.
Check whether the reported result is total, dissolved or orthophosphate and whether the samples were filtered consistently. These fractions answer different process questions. Changing the phosphorus fraction or digestion procedure between samples can create an apparent process event that no online sensor can resolve by itself.
Before increasing coagulant, confirm flow-proportional dose, chemical strength, pump stroke, storage condition and the location of sample collection. Record the corrective action and follow the next matched TP, turbidity and TSS results. This avoids treating every outlet increase as an under-dosing problem.

A1: Preserve the unsmoothed event window, operator actions, companion parameters, communication state and maintenance history before changing calibration. The original evidence is needed to separate a process event from an instrument fault. For context, Particulate phosphorus can rise when biological solids escape the clarifier.
A2: No. Begin total phosphorus outlet monitoring troubleshooting by inspecting the point and recording its as-found condition. Cleaning may be justified, but immediate recalibration can hide bubbles, fouling, matrix interference, stale data or a real process change. At this wastewater effluent point, remember that chemical dosing, sludge carryover, influent change, poor settling and sampling errors can cause a sudden TP increase.
A3: For Sudden Total Phosphorus Increase at Wastewater Outlets, look for a plausible time relationship with flow, load and companion parameters. The following project fact is relevant: A low chemical dose, wrong pH or poor mixing can reduce phosphorus precipitation. An isolated step without process context should trigger instrument and data-path checks.
A4: For Sudden Total Phosphorus Increase at Wastewater Outlets, confirm polarity, address, baud rate, parity, register, unit and decimal scaling from the field device to the PLC, RTU or data logger. Then test stale-data handling, communication loss and restart recovery. The acceptance record must also state this project constraint: a spectral TP trend or laboratory value must be interpreted with turbidity, TSS, flow and treatment history.
A5: For Sudden Total Phosphorus Increase at Wastewater Outlets, use the same location and time after stabilization. Within the Sudden Total Phosphorus Increase at Wastewater Outlets supply scope, record sample handling, temperature, units, method and uncertainty; one unmatched grab sample is not enough to approve or reject an online point. For context, A low chemical dose, wrong pH or poor mixing can reduce phosphorus precipitation.
A6: For Sudden Total Phosphorus Increase at Wastewater Outlets, the project requires the cited product family includes Up to 8 parameters including temperature. In the Sudden Total Phosphorus Increase at Wastewater Outlets acceptance plan, this is a manual-based reference, not automatic model approval; routine values, credible peaks and the water matrix still control final selection. At this wastewater effluent point, remember that chemical dosing, sludge carryover, influent change, poor settling and sampling errors can cause a sudden TP increase.
A7: For the Sudden Total Phosphorus Increase at Wastewater Outlets measuring point, separate the sensor, holder or flow cell, cable options, controller, gateway, cabinet, calibration items, consumables, spares, documentation, commissioning and freight. When integrating Sudden Total Phosphorus Increase at Wastewater Outlets, this prevents a smaller supply scope from appearing cheaper than a complete point. The acceptance record must also state this project constraint: a spectral TP trend or laboratory value must be interpreted with turbidity, TSS, flow and treatment history.
A8: Send water data, photographs or drawings, required output, cable distance, quantity, destination and schedule. Include the current problem: chemical dosing, sludge carryover, influent change, poor settling and sampling errors can cause a sudden TP increase. Within the Sudden Total Phosphorus Increase at Wastewater Outlets supply scope, that detail lets engineering review suitability before price is issued.
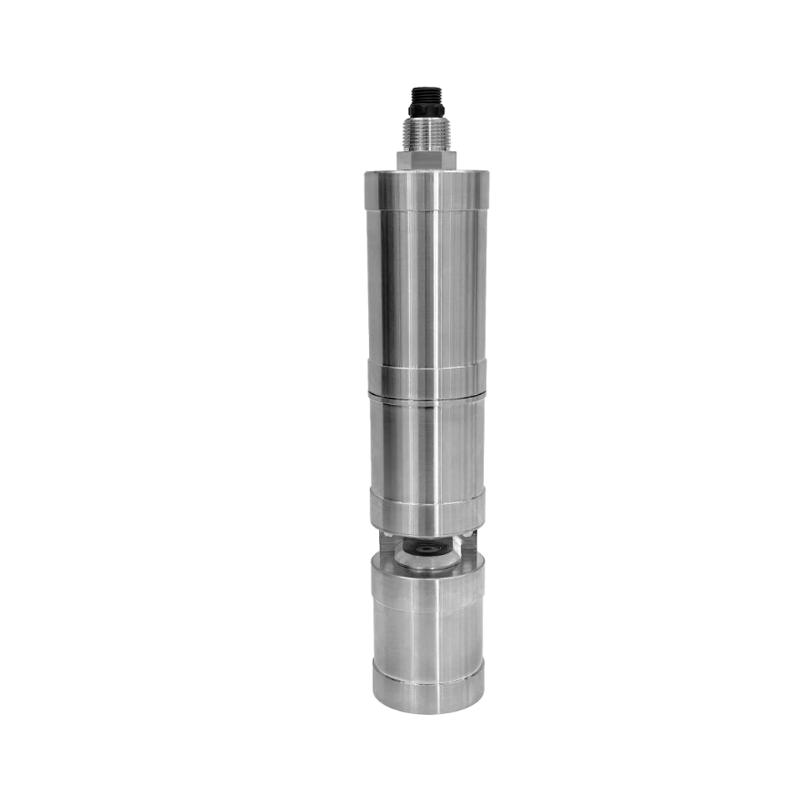
Specifications addressing sudden total phosphorus increase should start from the operating decision, water matrix and acceptance evidence. The measuring-point design must check solids and process events before changing coagulant dose, while respecting the boundary that a spectral TP trend or laboratory value must be interpreted with turbidity, TSS, flow and treatment history.
To obtain a project-specific NiuBoL offer, attach representative water data and the intended installation and control boundary. In the Sudden Total Phosphorus Increase at Wastewater Outlets acceptance plan, separate hardware, accessories, spares and support so the commercial comparison remains traceable. The acceptance record must also state this project constraint: a spectral TP trend or laboratory value must be interpreted with turbidity, TSS, flow and treatment history.
Prev:Winter Wastewater Monitoring: How Low Temperature Changes DO, Ammonia and Process Data
Next:High Effluent Ammonia Nitrogen: Root-Cause Checks Before Process Adjustment
Related recommendations
Sensors & Weather Stations Catalog
 Agriculture Sensors and Weather Stations Catalog-NiuBoL.pdf
Weather Stations Catalog-NiuBoL.pdf
Agriculture Sensors Catalog-NiuBoL.pdf
Water Quality Sensor Catalog-NiuBoL.pdf
Related products
 Combined air temperature and relative humidity sensor
 TDR Soil Moisture & Temperature Sensor for irrigation| RS485 |4-20mA| NBL-S-THR
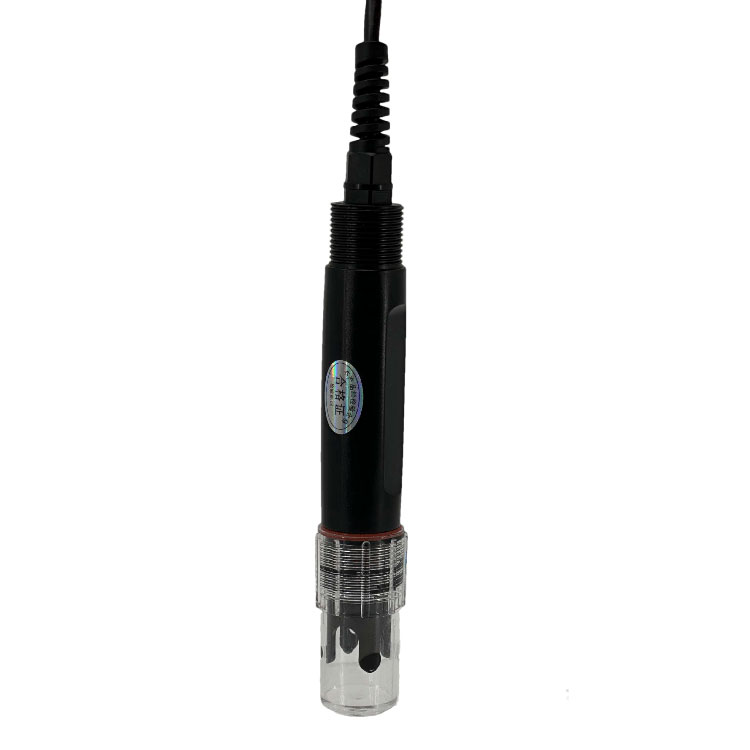 Soil pH sensor RS485 soil Testing instrument soil ph meter for agriculture |NBL-S-PH
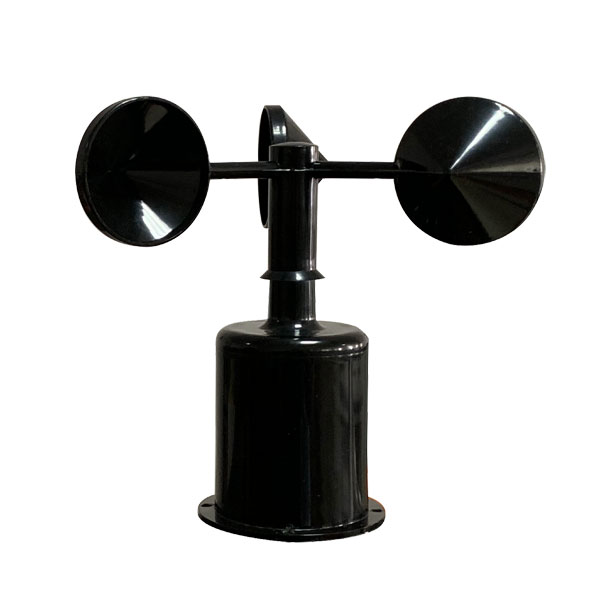 Wind Speed sensor Output Modbus/RS485/Analog/0-5V/4-20mA
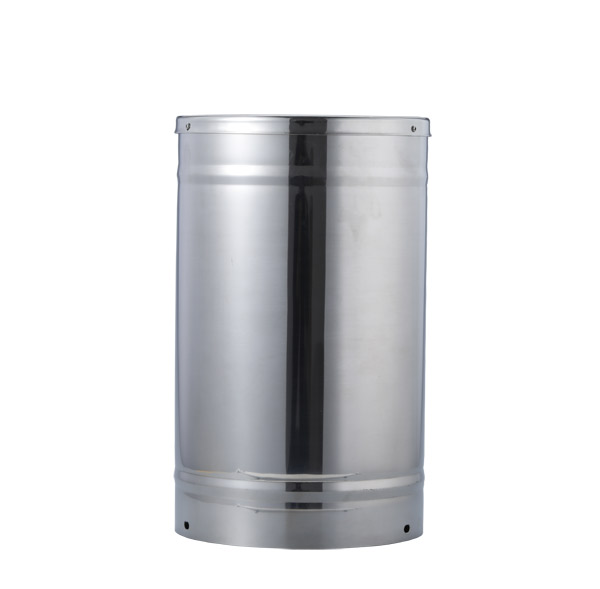 Tipping bucket rain gauge for weather monitoring auto rainfall sensor RS485/Outdoor/stainless steel
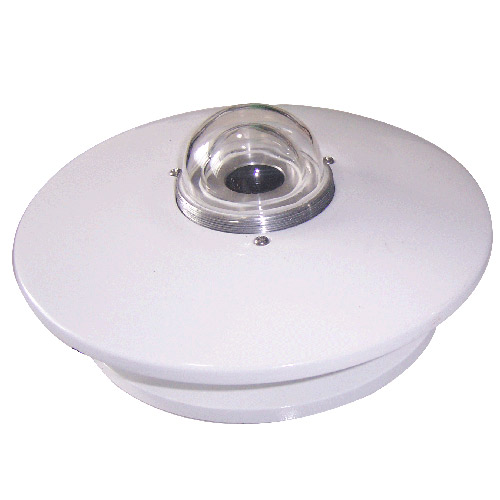 Pyranometer Solar Radiation Sensor 4-20mA/RS485

Screenshot, WhatsApp to identify the QR code
WhatsApp number:+8615367865107
(Click on WhatsApp to copy and add friends)