

— Blogs —
—Products—
 Consumer hotline +8618073152920
WhatsApp:+8615367865107
Address:Room 102, District D, Houhu Industrial Park, Yuelu District, Changsha City, Hunan Province, China
Product knowledge
Time:2026-06-06 09:36:29 Popularity:370
Quick Answer: NTU monitoring in water treatment is useful when each trend is tied to its sampling point and process state. Compare raw water, clarification and filtration with their hydraulic delay, flow changes and cleaning events in view. A higher reading indicates a change in optical scattering; it does not alone identify contamination, quantify solids mass or prove that a filter needs replacement.
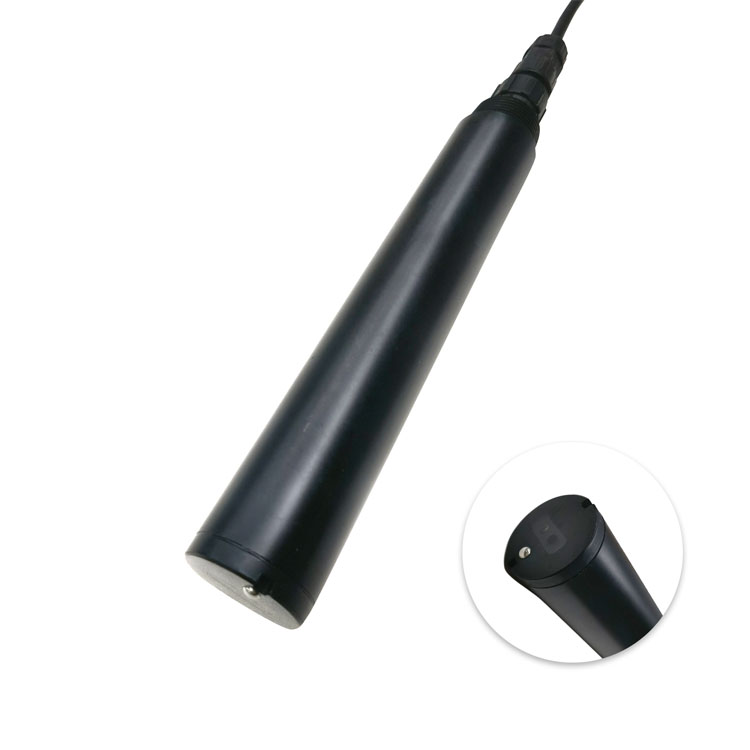
A raw-water channel asks what particle conditions are entering treatment. A clarifier outlet channel asks whether the settled-water condition has changed. A filter outlet channel asks about the water leaving that filter under its current operating state. Label these separately in the historian instead of using indistinguishable tags such as "water quality 1" and "water quality 2."
For each tag, record the physical take-off, sensor model and range, measurement unit, normal flow direction and any sample conditioning. If water is filtered or allowed to settle before reaching the probe, the trend may no longer describe the intended process stream. The sampling arrangement is therefore part of the channel identity.
Do not infer filter blockage from a turbidity increase alone. Differential pressure, flow and the operating sequence are needed to assess hydraulic blockage. Likewise, a clear-looking low reading is not a complete water-safety result. Turbidity tracks particles optically; dissolved contaminants and specific microorganisms require appropriate separate measurements.
At a steady plant, plotting inlet and outlet NTU at the same clock time can be misleading. The water measured downstream may have entered much earlier. Consider tank residence, changing flow, recycle paths and side-stream transport before interpreting a mismatch as treatment failure.
Use the process drawing to identify the likely delay, then examine a real operating change to see how it appears at successive points. A mixed tank spreads the event rather than acting like a simple plug-flow pipe. Do not shift the curve by a single nominal number and assume the same alignment remains valid during every flow condition.
A reduction from a hypothetical 100 NTU to 10 NTU is a 90% reduction in the recorded turbidity value. It is not evidence of 90% suspended-solids mass removal, pathogen removal or organic-carbon removal. Those quantities require their own measurements and a suitable sampling comparison.
| Trend pattern | Check before changing the process |
|---|---|
| Short spikes after a pump starts | Inspect bubbles, disturbance of deposits, sample-line flushing and whether the spike is present in a representative sample. |
| Gradual rise during otherwise stable operation | Compare a reference sample and inspect the optical window; separate fouling from a genuine particle increase. |
| Sudden change immediately after cleaning | Allow the probe and sample flow to settle; inspect bubbles, mounting position and the before/after reference check. |
| Flat value during a changing process | Check communication freshness, over-range, stagnant sample and power state; a flat line is not necessarily stable water. |
| Upstream/downstream disagreement | Review travel time, sampling differences, instrument method and ordered ranges before calculating treatment efficiency. |
The mounting and cable detail below belongs to the basic TS probe. Mechanical support and strain relief help keep its position repeatable when the instrument is withdrawn for cleaning. Do not use the signal cable as the suspension member or permit the optical region to rest in sediment.
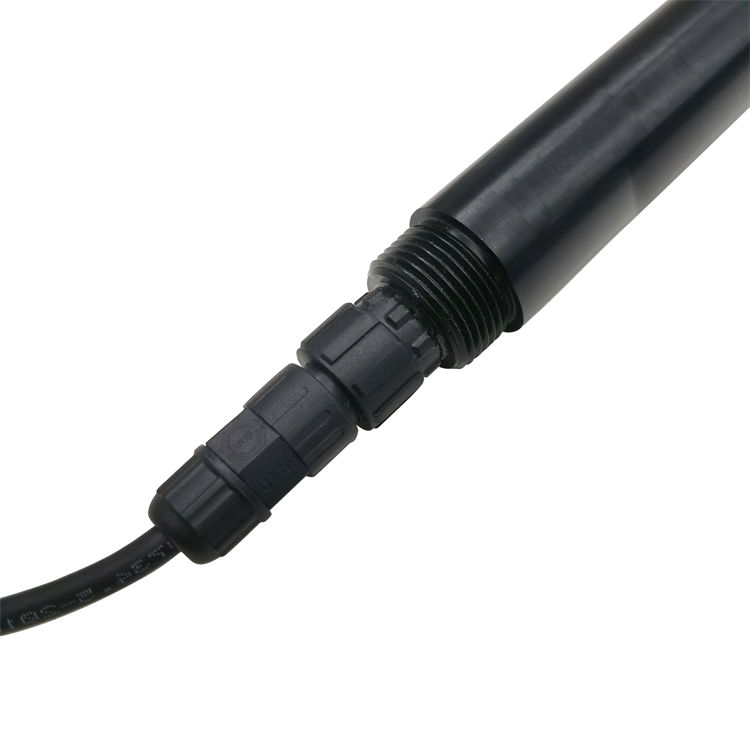
The NiuBoL NBL-WQ-TS provides a digital turbidity channel for suitable immersion installations. Its stated range and accuracy must be appropriate to the change being interpreted. More decimal places do not establish a lower dependable alarm threshold.
| Parameter | Basic NBL-WQ-TS |
|---|---|
| Range / resolution | 0-20.00 NTU / 0.01 NTU; 0-100.0 NTU / 0.1 NTU; 0-1000.0 NTU / 0.1 NTU |
| Accuracy | 20 NTU range: +/-3% or +/-1.5 NTU; 100 NTU range: +/-3% or +/-2 NTU; 1000 NTU range: +/-5% or +/-3 NTU. Confirm the percentage basis and application of the terms. |
| Temperature / compensation | Temperature accuracy +/-0.3 degrees C; Pt1000 automatic temperature compensation |
| Water conditions | 0-50 degrees C; pressure below 0.2 MPa |
| Power | 12-24 V DC; 0.2 W at 12 V |
| Output | RS485 Modbus RTU; 4-20 mA also listed, confirm ordered configuration |
| Housing / protection | POM and ABS; IP68 |
| Mounting / cable | Immersion, 3/4 NPT; standard 5 m cable, other lengths customizable; confirm jacket suitability |
If the required decision concerns very low NTU, assess uncertainty at that level before approving this general immersion configuration. For a detailed comparison of range and error limits, use the separate online turbidity sensor selection guide. This trend-reading workflow does not replace that qualification.
Log pump starts, filter backwash, return to service, chemical-feed changes and probe maintenance alongside NTU. Preserve raw data during these events even if an approved control sequence temporarily inhibits an alarm. Deleting inconvenient peaks prevents later review of whether the event was hydraulic, instrumental or a real water change.
Define a persistence rule and recovery condition for each operational alarm. The required duration should follow the process response and sampling delay, not an arbitrary common setting across all tags. A fast spike may deserve logging and investigation without necessarily commanding the same action as a sustained rise.
Keep data validity separate from NTU value. A Modbus timeout should create a stale-data condition, not a zero reading. A display pinned at full scale should be identified as over-range rather than treated as an exact concentration. Where available, retain the device's diagnostic state with the measured value.
When an unexpected change appears, record the time and operating state, check sample flow and inspect for bubbles. Compare an appropriately handled reference sample using a compatible method. Then clean or verify the instrument if the evidence points to measurement error. Changing calibration first can hide a real event or absorb a sampling problem into the instrument setting.
For an upgrade enquiry, send representative trend segments with process-event times, the existing probe range, sample-point photographs and the decision the new channel must support. This helps distinguish a need for another sensor range from a need to improve sampling or data handling.
They can support an optical comparison if methods, sampling and timing are appropriate. The ratio is not automatically solids-mass removal or microbiological treatment efficiency.
No. Check a representative sample, bubbles, fouling and operating changes. Combine the result with filter flow, differential pressure and operating state before deciding on corrective action.
No. Preserve the observations and label the operating event. Alarm treatment can follow an approved sequence, but the record should remain available for performance review.
Only if the measurement is fresh and representative. Verify communication timestamps, sample exchange, range status and probe condition before interpreting a flat value as stable water.
Compare optical method, sample handling, temperature, range, calibration state and timing. Do not force agreement between an in-process observation and a sample that settled or changed before testing.
NTU monitoring becomes useful when operators can connect each change to a defined water point and operating event. Keep the raw trend, account for travel time and verify unexpected changes before modifying treatment. A suitable NiuBoL turbidity channel supplies the observation; sample design and process context make it actionable.
Prev:TOC Analyzer Selection: Carbon Recovery, Sample Handling and Online Cycles
Next:ORP Water Analyzer Installation: Removal, Storage and Restart Checks
Related recommendations
Sensors & Weather Stations Catalog
 Agriculture Sensors and Weather Stations Catalog-NiuBoL.pdf
Weather Stations Catalog-NiuBoL.pdf
Agriculture Sensors Catalog-NiuBoL.pdf
Water Quality Sensor Catalog-NiuBoL.pdf
Related products
 Combined air temperature and relative humidity sensor
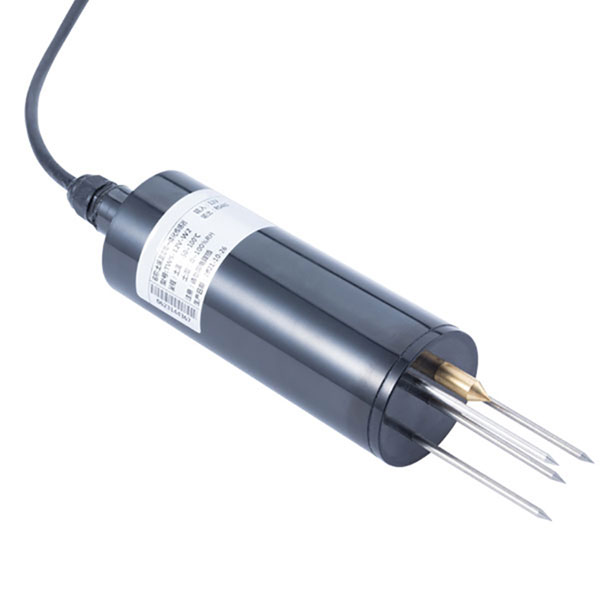 TDR Soil Moisture & Temperature Sensor for irrigation| RS485 |4-20mA| NBL-S-THR
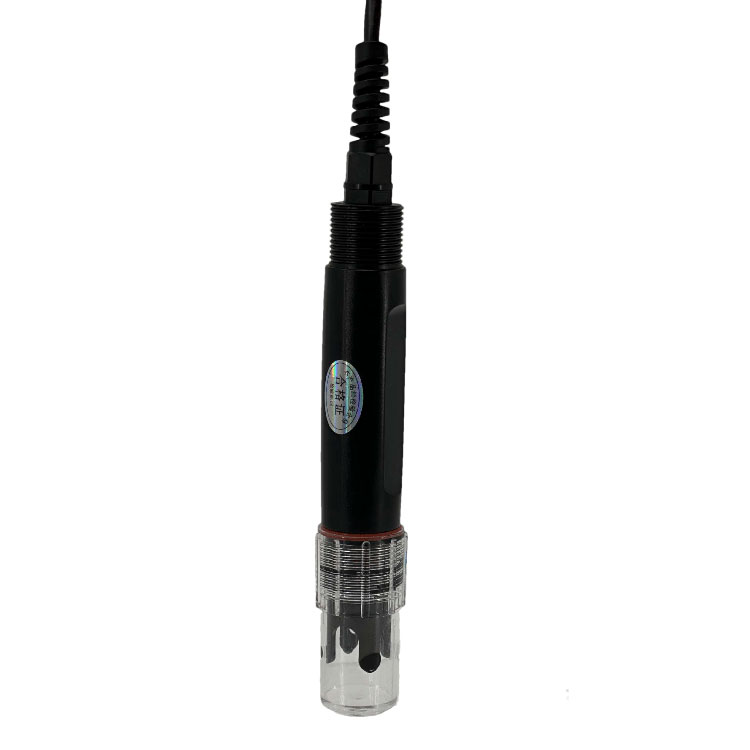 Soil pH sensor RS485 soil Testing instrument soil ph meter for agriculture |NBL-S-PH
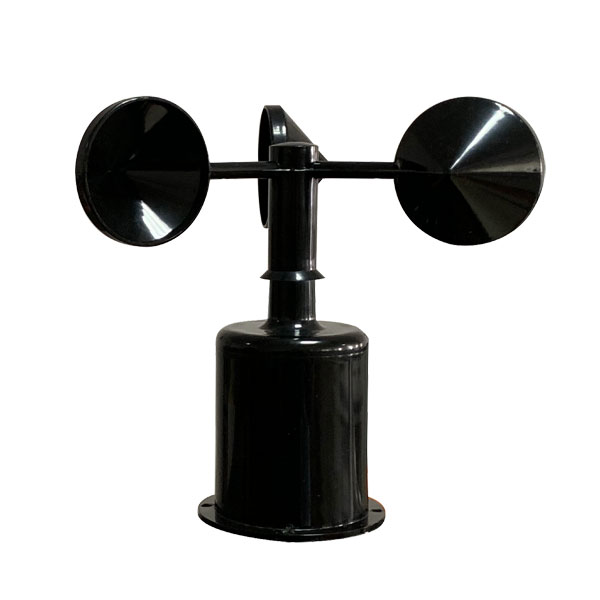 Wind Speed sensor Output Modbus/RS485/Analog/0-5V/4-20mA
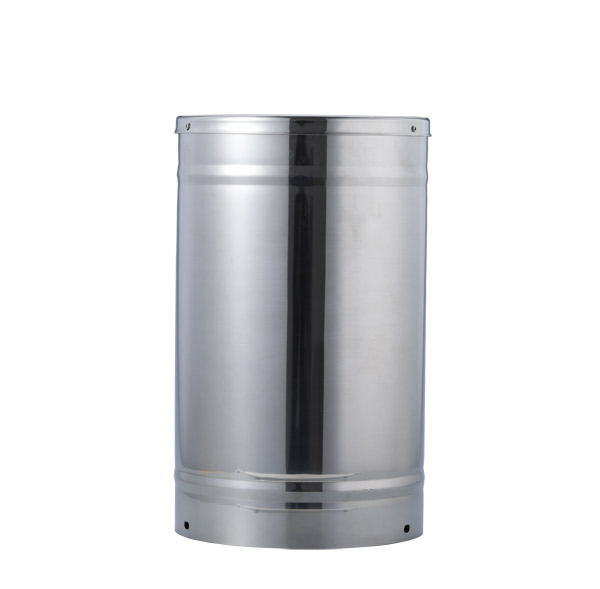 Tipping bucket rain gauge for weather monitoring auto rainfall sensor RS485/Outdoor/stainless steel
 Pyranometer Solar Radiation Sensor 4-20mA/RS485


Screenshot, WhatsApp to identify the QR code
WhatsApp number:+8615367865107
(Click on WhatsApp to copy and add friends)