

— Blogs —
—Products—
 Consumer hotline +8618073152920
 WhatsApp:+8615367865107
Address:Room 102, District D, Houhu Industrial Park, Yuelu District, Changsha City, Hunan Province, China
Product knowledge
Time:2026-09-04 17:00:00 Popularity:203
In online water monitoring, water turbidity measurement should be specified around evidence and action because bubbles, fouling, stray light, sedimentation and poor sample position can create false turbidity events.
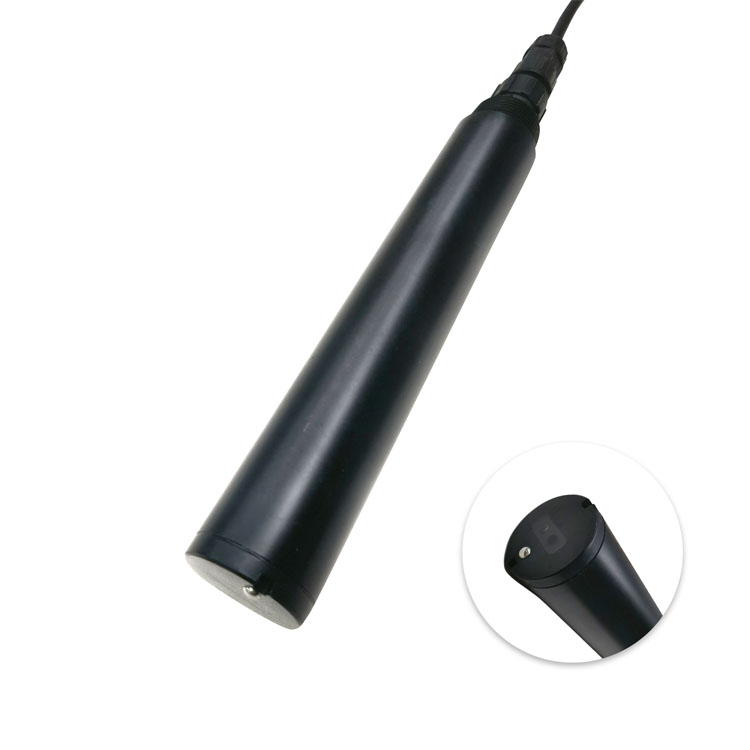
The useful outcome is not simply a displayed value; it is the ability to link cleaning and verification frequency to the water matrix and alarm consequence. Specify the field device and verification work with the constraint that zeroing a dirty optical window can hide the problem rather than correct it.
Turbidity reflects light scattered by suspended and colloidal matter.
Particles settle or redistribute after sampling, so online and grab results need synchronized comparison.
Low-range drinking-water measurement needs a different range and installation discipline from high-solids wastewater.
Together, these conditions define the engineering question for online water monitoring: whether the proposed measurement and system scope can link cleaning and verification frequency to the water matrix and alarm consequence.
For water turbidity measurement, the table uses the current NBL-WQ-TS turbidity sensor manual as a verified reference. It defines a realistic engineering option for online water monitoring; it does not remove the project constraint described above. When integrating Water Turbidity Measurement, the final configuration, range and accessories should be confirmed against the quotation and project water data.
| Parameter | Verified reference |
|---|---|
| Reference model | NBL-WQ-TS |
| Principle | Scattered-light method |
| Ranges | 0-20.00, 0-100.0 or 0-1000.0 NTU |
| Resolution — turbidity sensor maintenance | 0.01 NTU on low range; 0.1 NTU on higher ranges |
| Accuracy — turbidity sensor maintenance | Range-dependent: +/-3% or stated NTU floor; +/-5% or +/-3 NTU on 1000 NTU range |
| Output | RS485, Modbus RTU |
| Power | 12-24 VDC; below 0.3 W at 12 V |
| Working condition — turbidity sensor maintenance | 0-50 deg C; below 0.2 MPa |
| Protection / material | IP68; POM and ABS |
| Installation / cable — turbidity sensor maintenance | Immersion, 3/4 NPT; 5 m cable, customizable |
For work in online water monitoring, nominal accuracy is only one part of suitability.
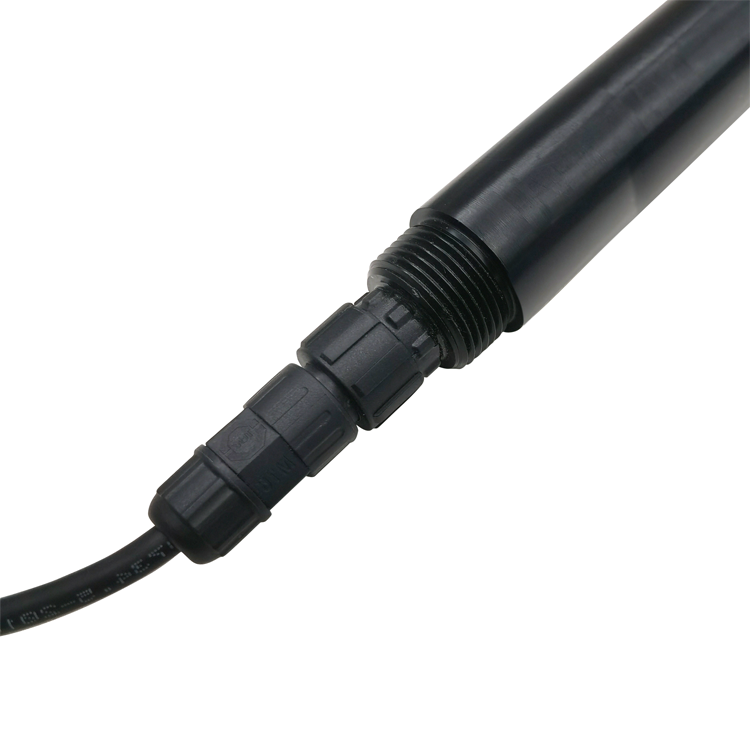
The routine for the turbidity probe should clean the optical face, remove bubbles and verify zero and slope with standards suited to the selected NTU range. Record what was found before cleaning; a before-and-after value is useful evidence of fouling severity.
The approved order needs to name each service item and compatible model. Stock quantity for the turbidity probe depends on installed population, failure consequence, shelf life and replenishment lead time.
Maintenance frequency should follow data drift and site loading, not a calendar copied from another project. For online water monitoring, review the interval after the first month and again after a seasonal or production change.
| Project item | What the specification should state |
|---|---|
| Operating problem | Bubbles, fouling, stray light, sedimentation and poor sample position can create false turbidity events. |
| Required decision | Link cleaning and verification frequency to the water matrix and alarm consequence. |
| Method boundary | Zeroing a dirty optical window can hide the problem rather than correct it. |
| Minimum evidence for turbidity sensor maintenance | Matched readings, installation record, units, timestamps and a documented acceptance method for the maintained sensor. |
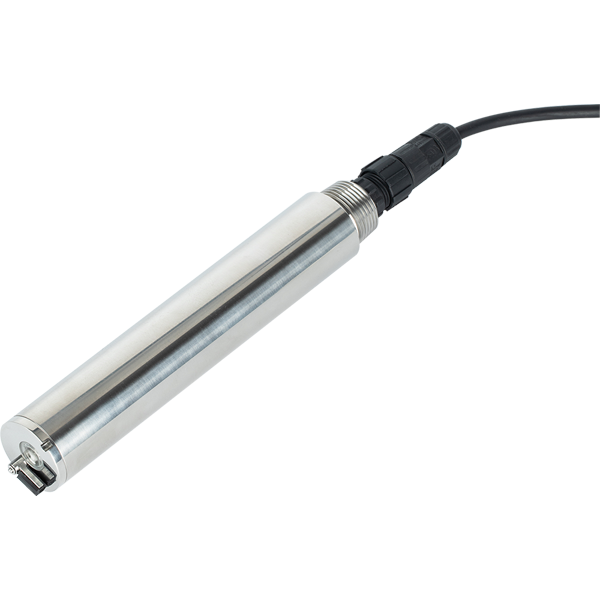
Field challenge: Turbidity reflects light scattered by suspended and colloidal matter. At this stage, the engineering risk is that bubbles, fouling, stray light, sedimentation and poor sample position can create false turbidity events.
System integration: During design review, the team must record deposits, damage, flow condition and the raw reading before disturbing the measuring surface.
User value: The owner receives evidence of the actual failure mode. This creates a documented basis for the decision to link cleaning and verification frequency to the water matrix and alarm consequence.
Field challenge: Particles settle or redistribute after sampling, so online and grab results need synchronized comparison. At this stage, the engineering risk is that site conditions can alter the maintained sensor before the operator sees it.
System integration: During design review, the team must compare before-and-after cleaning response and calibrate only when a valid standard or reference confirms a correctable bias.
User value: The owner receives less unnecessary calibration and part replacement. This reduces exposure to the stated problem: bubbles, fouling, stray light, sedimentation and poor sample position can create false turbidity events.
Field challenge: Low-range drinking-water measurement needs a different range and installation discipline from high-solids wastewater. At this stage, the engineering risk is that zeroing a dirty optical window can hide the problem rather than correct it.
System integration: During design review, the team must confirm stable data and alarms, then set consumable and spare quantities from installed population, consequence and lead time.
User value: The owner receives predictable service cost and shorter outages. The conclusion remains subject to this stated constraint: zeroing a dirty optical window can hide the problem rather than correct it.
Acceptance for the maintained sensor must cover installation, stable response, unit, range, communications, alarms and the comparison method. A number on the display proves data transfer, not measurement quality.
Take the reference sample at the same online water monitoring point and time after stabilization. Set tolerance from both the NiuBoL specification and reference-method uncertainty; different methods should not be required to agree exactly.
Selection of Water Turbidity Measurement should begin with the measurement duty, site condition and receiving-system interface. Record the as-built cable route, device address, Modbus settings, scaling, alarm tests and responsible service contact. Include evidence that the point recovers correctly after power and network interruption.
Within the Water Turbidity Measurement supply scope, give suppliers measured water data and an installation sketch rather than only an application name. Identify pressure or depth, flow, fouling, cable distance, output, controller requirement and how the operator will use the reading. For context, Turbidity reflects light scattered by suspended and colloidal matter.
Bid details for online water monitoring should cover quantity, destination, delivery date, documentation language, packaging, spares, calibration accessories and commissioning. Custom cable, analog output, holder, flow cell or gateway can affect price and lead time.
The main commercial risk is not simply an inaccurate reading. If bubbles, fouling, stray light, sedimentation and poor sample position can create false turbidity events, the owner may approve a design or operating response that cannot link cleaning and verification frequency to the water matrix and alarm consequence.
For water turbidity measurement, a repeat order is reliable only when range, material, output, cable and accessories match the original duty.
A gradual upward bias that falls after cleaning suggests optical coating; sharp positive spikes may indicate bubbles or disturbed sediment; a flat value can indicate a blocked sample line or stale data. Record raw data and flow condition before zeroing or recalibration. The shape of the error often tells the technician more than the latest number.
Low-range drinking-water points need standards and clean handling suited to their operating range, while wastewater points need representative solids and more frequent optical inspection. The service method and acceptance tolerance should therefore be stated by measuring duty, not copied between the two applications.
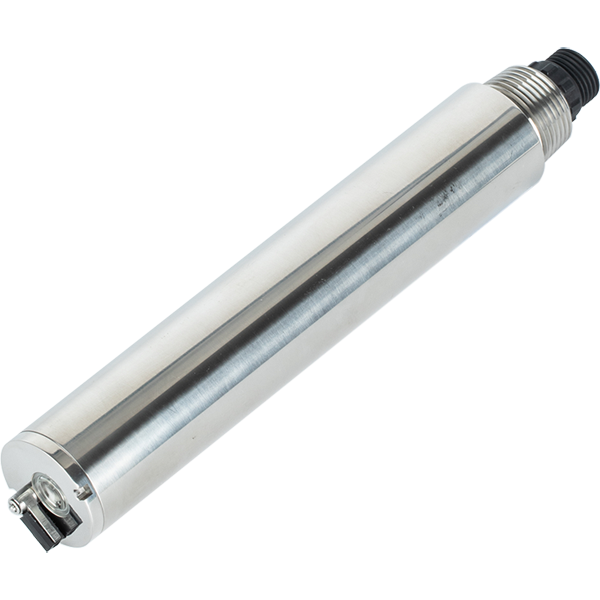
A1: For turbidity sensor maintenance, increasing bias, slow response, abnormal noise, implausibly flat data or a large post-cleaning change are useful fault signatures. Record the as-found value and physical condition before service.
A2: Calibrate only after checking cleanliness, sample condition and installation, and after a valid standard or reference confirms bias. Calibration cannot repair a damaged sensing part or a poor measuring point. For context, Low-range drinking-water measurement needs a different range and installation discipline from high-solids wastewater.
A3: Use the manual as a starting point, then revise the interval from drift and fouling observed in online water monitoring. Review it again after seasonal, loading or treatment changes.
A4: Verify the turbidity sensor maintenance interface end to end: wiring, device address, baud rate, parity, register address, data type, scaling and engineering unit. During turbidity sensor maintenance acceptance, compare the local value with the PLC, RTU or logger value and retain the tested register map.
A5: For Water Turbidity Measurement, use the same location and time after stabilization. For the Water Turbidity Measurement measuring point, record sample handling, temperature, units, method and uncertainty; one unmatched grab sample is not enough to approve or reject an online point. The acceptance record must also state this project constraint: zeroing a dirty optical window can hide the problem rather than correct it.
A6: The cited product family includes 0-20.00, 0-100.0 or 0-1000.0 NTU. When integrating Water Turbidity Measurement, this is a manual-based reference, not automatic model approval; routine values, credible peaks and the water matrix still control final selection. For context, Turbidity reflects light scattered by suspended and colloidal matter.
A7: Separate the sensor, holder or flow cell, cable options, controller, gateway, cabinet, calibration items, consumables, spares, documentation, commissioning and freight. Within the Water Turbidity Measurement supply scope, this prevents a smaller supply scope from appearing cheaper than a complete point. This requirement helps the team link cleaning and verification frequency to the water matrix and alarm consequence.
A8: Send water data, photographs or drawings, required output, cable distance, quantity, destination and schedule. Include the current problem: bubbles, fouling, stray light, sedimentation and poor sample position can create false turbidity events. In the Water Turbidity Measurement acceptance plan, that detail lets engineering review suitability before price is issued.
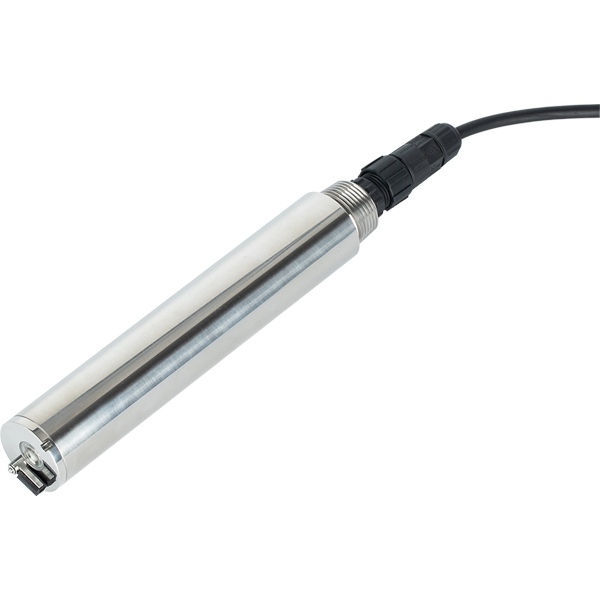
For online water monitoring, the use of water turbidity measurement is justified only inside a defined measurement and response plan. Selection should enable the team to link cleaning and verification frequency to the water matrix and alarm consequence without ignoring that zeroing a dirty optical window can hide the problem rather than correct it.
For the Water Turbidity Measurement measuring point, to obtain a project-specific NiuBoL offer, attach representative water data and the intended installation and control boundary. When integrating Water Turbidity Measurement, separate hardware, accessories, spares and support so the commercial comparison remains traceable. This requirement helps the team link cleaning and verification frequency to the water matrix and alarm consequence.
Prev:Water Parameters Measured On Site: A Field Monitoring Plan
Next:Pond Aquaculture Water Quality Parameters: Monitoring Priorities and Alarm Design
Related recommendations
Sensors & Weather Stations Catalog
 Agriculture Sensors and Weather Stations Catalog-NiuBoL.pdf
Weather Stations Catalog-NiuBoL.pdf
Agriculture Sensors Catalog-NiuBoL.pdf
Water Quality Sensor Catalog-NiuBoL.pdf
Related products
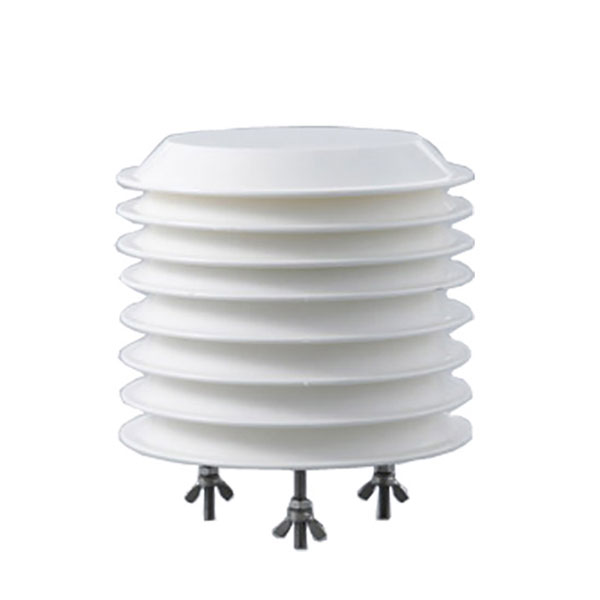 Combined air temperature and relative humidity sensor
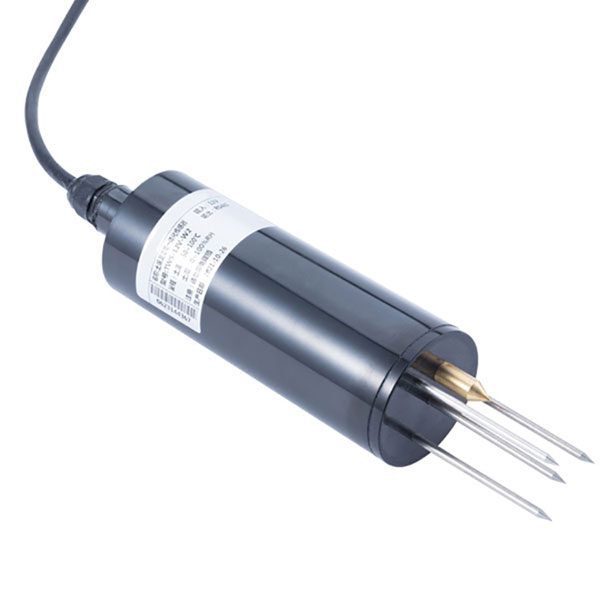 TDR Soil Moisture & Temperature Sensor for irrigation| RS485 |4-20mA| NBL-S-THR
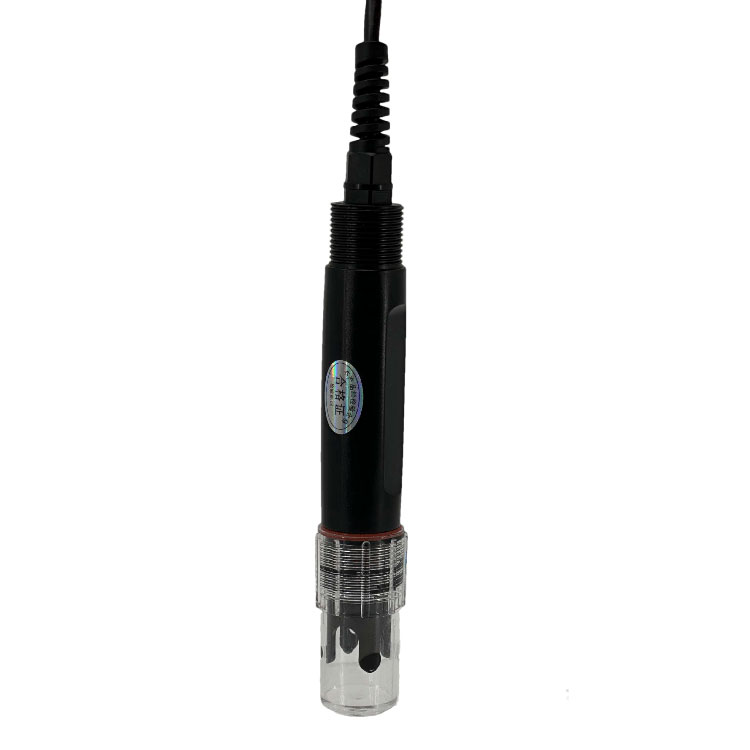 Soil pH sensor RS485 soil Testing instrument soil ph meter for agriculture |NBL-S-PH
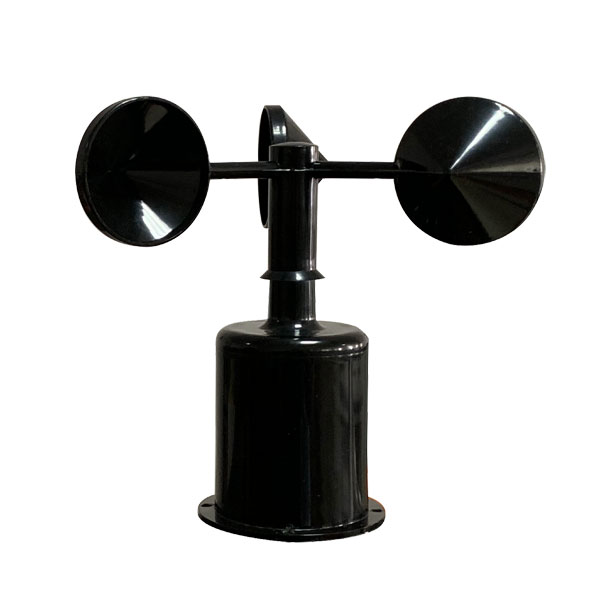 Wind Speed sensor Output Modbus/RS485/Analog/0-5V/4-20mA
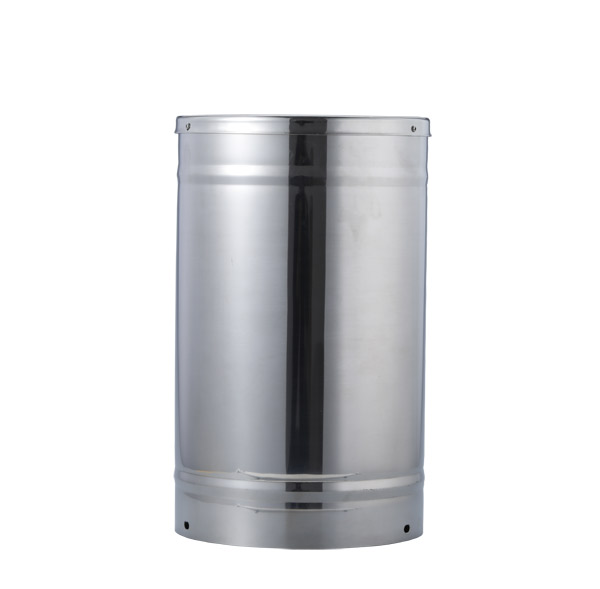 Tipping bucket rain gauge for weather monitoring auto rainfall sensor RS485/Outdoor/stainless steel
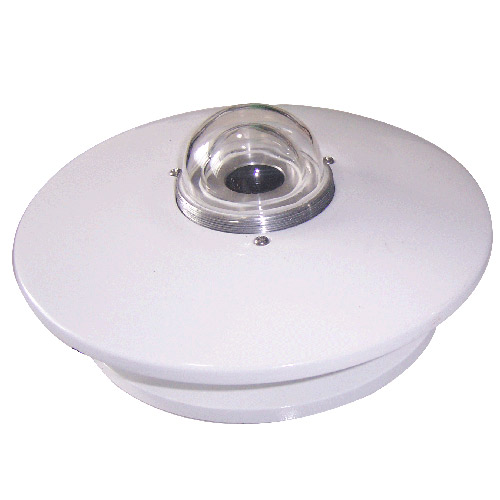 Pyranometer Solar Radiation Sensor 4-20mA/RS485
Screenshot, WhatsApp to identify the QR code
WhatsApp number:+8615367865107
(Click on WhatsApp to copy and add friends)