





— Blogs —
—Products—
 Consumer hotline +8618073152920
WhatsApp:+8615367865107
Address:Room 102, District D, Houhu Industrial Park, Yuelu District, Changsha City, Hunan Province, China
Product knowledge
Time:2025-01-17 15:41:01 Popularity:1659
Agricultural IoT data usage depends on what crosses the network, not simply the number of sensors. Numeric weather and soil records, pest images, video, remote servicing and retries have different traffic patterns. Estimate each separately, then measure a representative pilot before selecting the cellular plan. A camera's megapixel rating does not specify its uploaded file size.
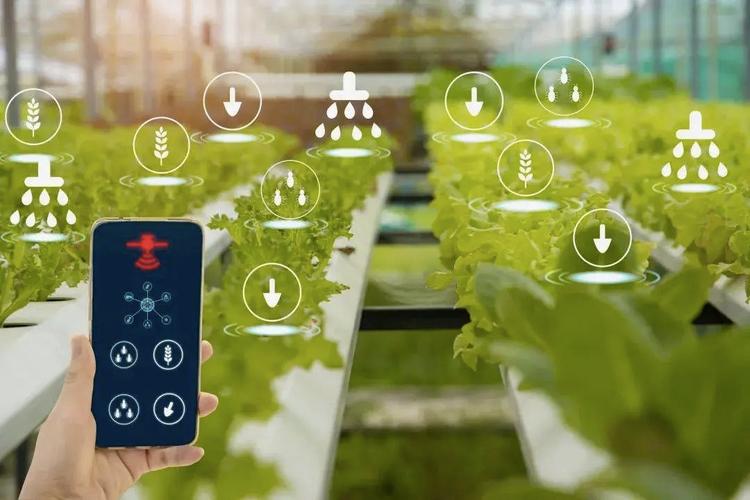
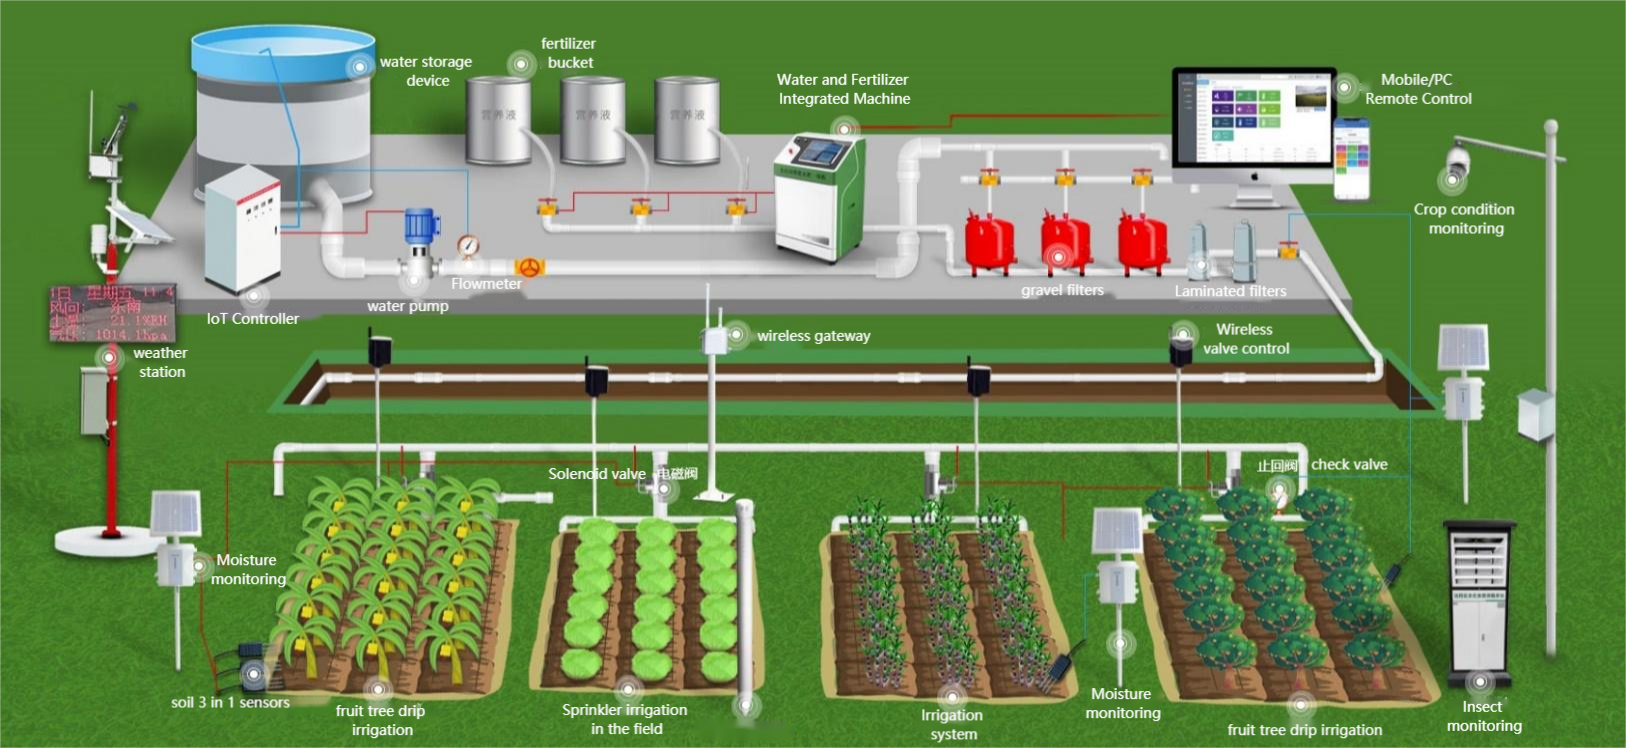
Agricultural IoT combines field measurements, acquisition equipment and networked applications. A farm may read several RS485 sensors into one gateway, while a separate insect station uploads photographs through its own connection. Counting all devices as identical cellular nodes can substantially misstate the required data allowance.
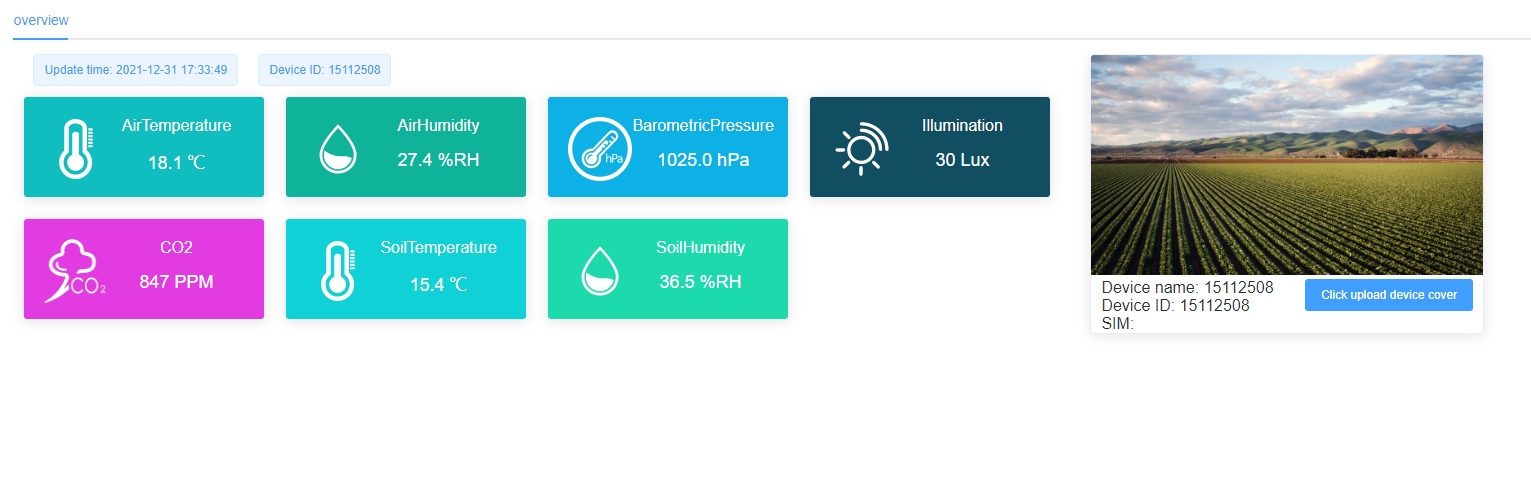
Identify which device has the SIM, which server receives its records and whether images travel through that same link. A phone reading an image already stored on a server does not necessarily use the field station's SIM again. Direct access to the field equipment has a different traffic path; establish which arrangement the platform actually uses.
Separate measurement frequency from upload frequency. A PLC or logger may read a sensor often but send a combined record less frequently. That can change cellular traffic without changing local acquisition, provided the required observations are retained by the configured software.
Start with measured or agreed record sizes. The following examples use decimal units: 1 MB is 1,000,000 bytes and 1 GB is 1000 MB. They are arithmetic examples, not traffic specifications for a particular NiuBoL station or promises about image compression.
| Illustrative traffic | Assumption | Payload per day | Payload over 30 days |
|---|---|---|---|
| Combined sensor record | 300 bytes per record, one record per minute | 432,000 bytes, or 0.432 MB | 12.96 MB |
| Still images | 2 MB per image, 48 images per day | 96 MB | 2880 MB, or 2.88 GB |
The sensor-record example already assumes a combined payload; do not multiply it again by the number of variables inside that record. Multiply by the number of independent record streams instead. Actual traffic also includes protocol overhead, acknowledgements, retries and other device services, so payload volume alone is not a complete SIM allowance.
RS485 Modbus RTU describes a local sensor connection. It does not define the size or frequency of the records a gateway sends to the server. The gateway's application configuration determines whether values are combined, transmitted individually, buffered or repeatedly requested.
| Example equipment | Relevant capability | What still needs confirmation |
|---|---|---|
| NiuBoL TG462 / TG462S | Three RS485 ports and two Ethernet interfaces; cellular version selected for the region | Sensor parsing, outbound payload and reporting schedule |
| TG462 series networking | MQTT, TCP/UDP and Modbus gateway functions | Required server, authentication and application format |
| TG462 series local storage | Micro SD support up to 32 GB | Usable retention, file handling and required outage recovery behavior |
| NBL-IoT-SRPMS insect system | 12-megapixel camera configuration; 4G / Ethernet connection | Actual image size, image schedule and transfer path |
The TG462 / TG462S data logger can form the acquisition layer for compatible farm sensors. Its available storage and interfaces do not automatically provide a complete application. State the required records and transfer behavior when ordering; a standard serial register reading is not an image-transfer protocol.
Dashboard update speed is another separate setting. A frequently refreshed page may read stored server data, or it may cause fresh field requests. Confirm that behavior before using the screen-refresh interval as an estimate of agricultural IoT data usage.
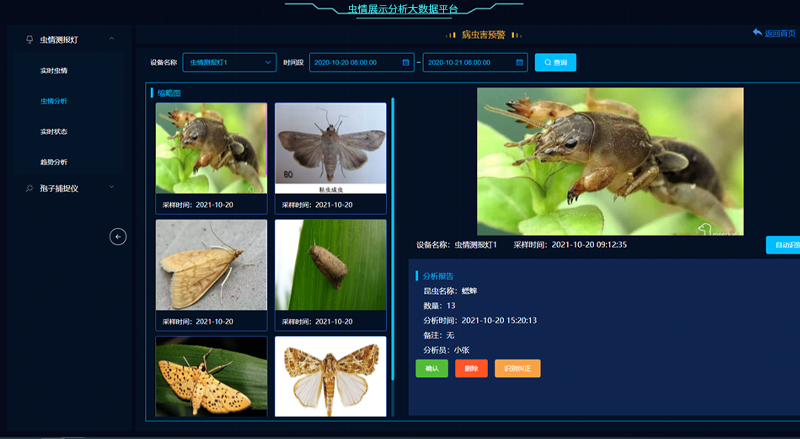
The NBL-IoT-SRPMS insect monitoring system produces images for review. File size depends on the image format, compression and scene content as well as pixel count. Ask for representative files from the proposed configuration and calculate the volume from their actual sizes.
Confirm whether the platform uploads an original image, a thumbnail or both. Include additional images requested during investigation and any agreed remote support. Do not reduce image quality solely to meet an assumed traffic target without checking whether the resulting images remain useful for the customer's review task.
Also distinguish photographs from video. Continuous or on-demand video needs its own estimate based on actual bitrate and viewing duration. A monthly budget for still pest images should not silently include a live camera service. Each service needs a clear traffic path and operating schedule.
Read device and operator usage records over a representative pilot period. Include ordinary acquisition, image uploads and the required maintenance activities. Compare the measured total with the payload calculation and investigate the difference rather than adding an arbitrary allowance percentage.
Then consider an interrupted connection. In the hypothetical image example, seven days of retained images would contain 672 MB of payload. If the configured system retransmits that backlog when connectivity returns, the recovery period carries old images as well as new observations. Storage capacity alone does not establish that this recovery function exists or how quickly it completes.
Priorities matter if the restored connection is limited. The project may need current numeric readings before older images, but that behavior must be supported and tested in the supplied software. Check duplicate handling and timestamps so a repeated upload is not counted as a new observation.
For a NiuBoL enquiry, provide the installation country, network operator, number of cellular nodes, sensor record size and interval, image workload and outage-recovery requirement. State whether a customer-owned server is involved. Request the hardware and integration scope separately from the local SIM and platform-service terms.
Not proportionally. Several values can share one outbound record, while each independent stream adds its own schedule and overhead. Estimate the actual transmitted payload, not the terminal count.
No. Pixel count and compressed file size are different. Obtain sample files from the intended format and quality setting, then use their measured size in the traffic estimate.
No. A transport choice does not remove the image payload. Confirm how images are transferred and budget their actual size separately from small numeric messages.
It can provide storage in a supported configuration, but it does not reduce the total volume eventually transferred. Retention, deletion, transfer priorities and outage recovery need an agreed application design.
Use measured normal and recovery traffic, the installation region and the operator's current terms. Confirm what happens when an allowance is reached. No single data-plan size or price fits every sensor-and-image project.
Agricultural IoT data usage is a workload calculation followed by a field measurement. Separate numeric records from images and video, establish the actual cellular path and include recovery traffic. This gives the project a defensible basis for gateway configuration and recurring connectivity costs without assuming that every connected farm device generates the same load.
Prev:Environmental Meteorological Monitoring Instruments: Variables and Units
Next:Scenic Spot Weather Station Maintenance During Seasonal Closures
Related recommendations
Sensors & Weather Stations Catalog
 Agriculture Sensors and Weather Stations Catalog-NiuBoL.pdf
Weather Stations Catalog-NiuBoL.pdf
Agriculture Sensors Catalog-NiuBoL.pdf
Water Quality Sensor Catalog-NiuBoL.pdf
Related products
 Combined air temperature and relative humidity sensor
 TDR Soil Moisture & Temperature Sensor for irrigation| RS485 |4-20mA| NBL-S-THR
 Soil pH sensor RS485 soil Testing instrument soil ph meter for agriculture |NBL-S-PH
 Wind Speed sensor Output Modbus/RS485/Analog/0-5V/4-20mA
 Tipping bucket rain gauge for weather monitoring auto rainfall sensor RS485/Outdoor/stainless steel
 Pyranometer Solar Radiation Sensor 4-20mA/RS485


Screenshot, WhatsApp to identify the QR code
WhatsApp number:+8615367865107
(Click on WhatsApp to copy and add friends)

