





— Blogs —
—Products—
 Consumer hotline +8618073152920
WhatsApp:+8615367865107
Address:Room 102, District D, Houhu Industrial Park, Yuelu District, Changsha City, Hunan Province, China
Product knowledge
Time:2025-01-16 14:25:18 Popularity:2357
Environmental meteorological monitoring instruments should be specified by measured variable, unit and output. Air humidity is not soil moisture, a PM sensor is not a gas analyzer, and illuminance in Lux is not solar irradiance in W/m². A correct channel list helps an integrator select the required instruments without paying for an unsuitable measurement or leaving a required quantity unmeasured.
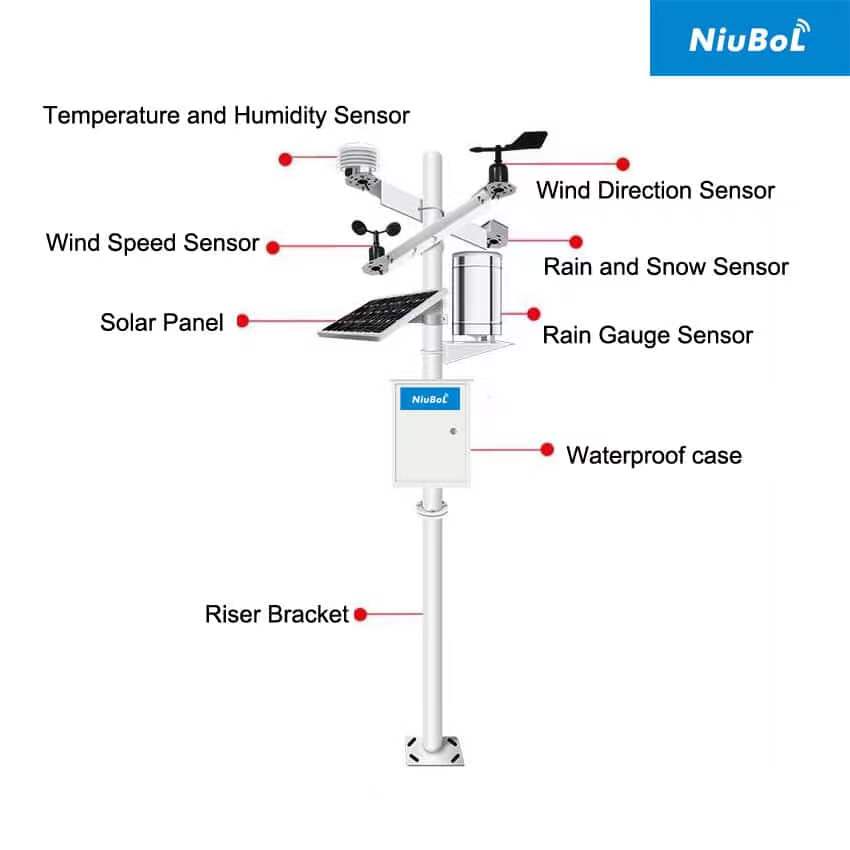
A request for temperature, wind, rain and air quality is a starting description, not a complete instrument schedule. The receiver needs a defined variable and unit for each channel. A broad label such as light or precipitation can conceal several different measurement requirements.
| Variable | Typical reporting unit | Measurement that must remain separate |
|---|---|---|
| Air temperature | C | Surface, soil or water temperature |
| Relative humidity | % RH | Absolute humidity or soil water content |
| Wind speed / direction | m/s / degrees | Gust statistic, averaging period and calm condition |
| Rainfall depth / intensity | mm / mm/h or mm/min | Snow depth and water level |
| Solar irradiance / illuminance | W/m² / Lux | UV measurement and plant-light photon flux |
| PM2.5 / PM10 concentration | µg/m³ | Gas concentration and a complete air-quality index |
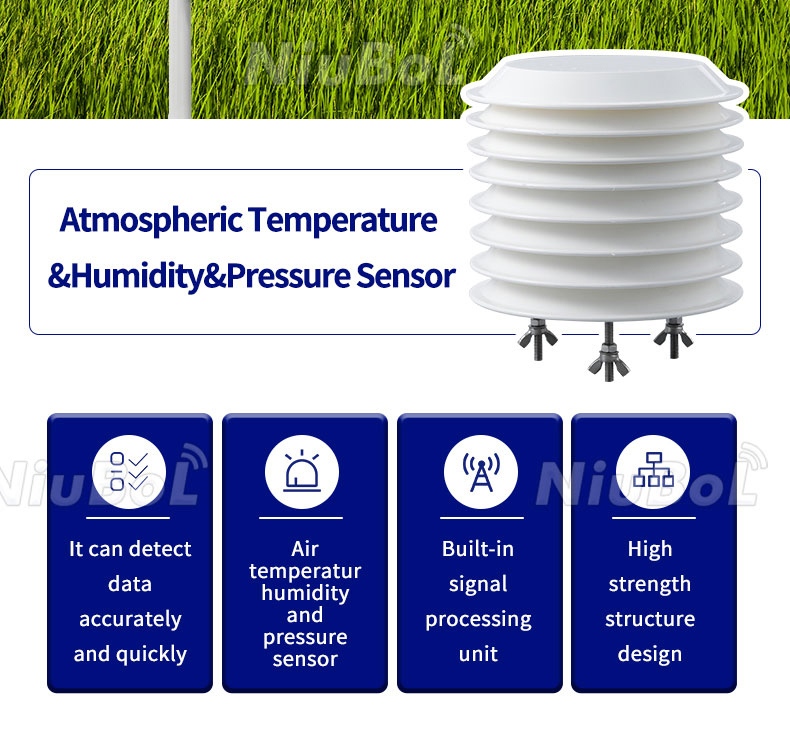
The NiuBoL NBL-W-LBTH combines three atmospheric variables in a radiation-shielded assembly. Its temperature and humidity elements need representative airflow. Installing it beside a heated wall or a ventilation outlet can change the atmosphere being observed.
| NBL-W-LBTH parameter | Range | Accuracy |
|---|---|---|
| Air temperature | -40 to 80 C | +/-0.5 C |
| Relative humidity | 0-100% RH | +/-5% RH |
| Barometric pressure | 10-1200 hPa | +/-1.5 hPa |
The digital configuration uses DC 12-24 V and RS485 Modbus RTU. Pressure is atmospheric pressure, not the pressure of an irrigation pipe or process vessel. Relative humidity describes saturation relative to air temperature; it does not directly indicate the water stored around crop roots. Add a suitable soil measurement when that is the required quantity.
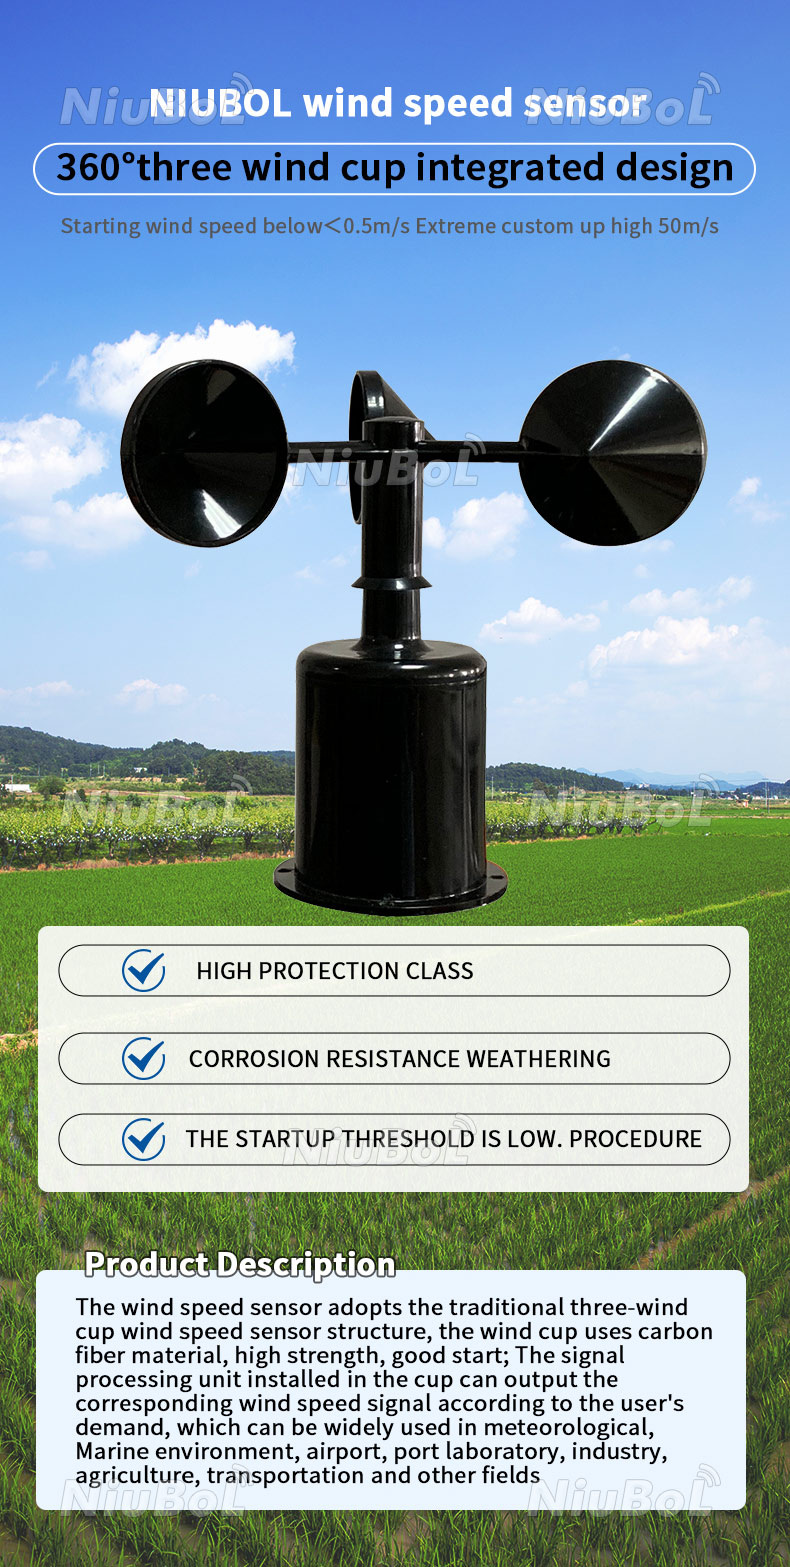
The NBL-W-SS cup anemometer measures wind speed. Its available ranges are 0-45 m/s or 0-70 m/s, with 0.1 m/s resolution. The separate NBL-W-DS vane measures direction. Both wind sensors have IP65 protection.
Record whether wind direction means the direction from which air arrives and how north is aligned. Also distinguish an individual reading, a time average and a gust statistic. An instrument range does not define the averaging period used by a display or an operational warning. The logger or software must implement the required statistic using an appropriate observation process.
For integration, select the actual RS485 Modbus RTU, analog or pulse version. A frequency input for wind speed is not automatically the same configuration as a contact counter for rainfall, even if both are informally called pulse inputs.
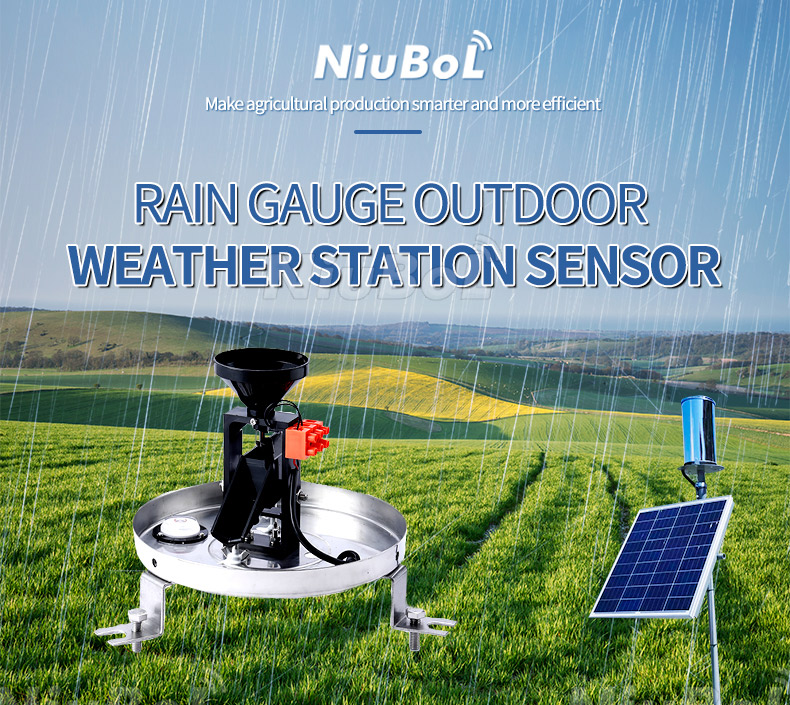
The NBL-W-RS tipping bucket rain gauge measures liquid precipitation with 0.2 mm resolution and a stated intensity range of 0-4 mm/min. Its +/-4% accuracy condition is an indoor static test at 2 mm/min, not a blanket accuracy promise for every outdoor event.
A precipitation-presence detector instead provides an event indication. A snow-depth instrument measures a surface depth. Neither output can be substituted directly for rain depth in millimetres. The RS gauge's 0-50 C operating range also requires attention when the project includes freezing weather.
Name the rainfall interval in the receiving record. Ten millimetres over a day and ten millimetres over ten minutes describe the same depth but different event intensities. Preserve accumulation and reset rules so the receiver does not confuse a restarted total with a dry period.
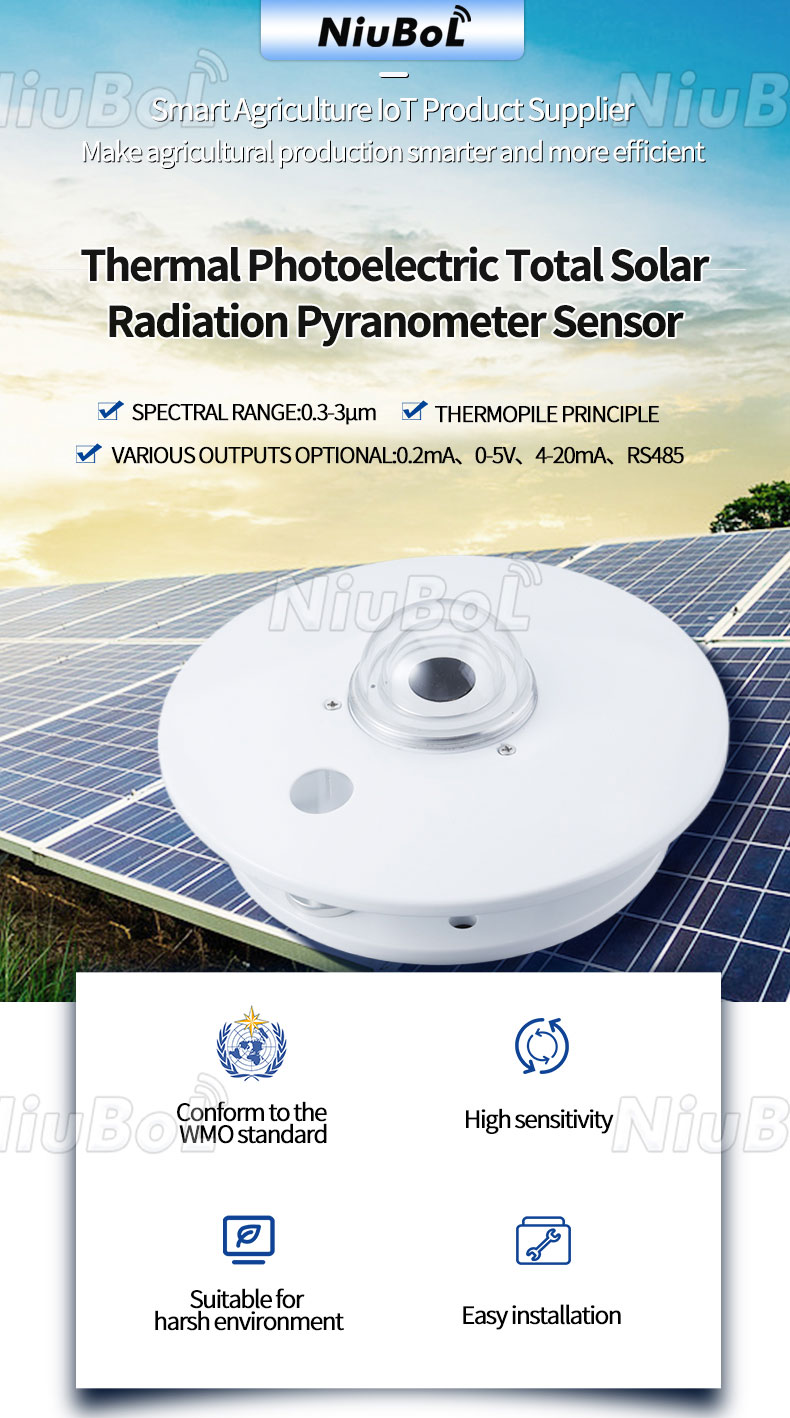
The NBL-W-HPRS pyranometer uses a thermopile and measures broadband solar irradiance over 0-2000 W/m², with a spectral range of 0.3-3 µm. It is not a spectroradiometer reporting a detailed spectrum and is not an illuminance sensor.
The receiving surface orientation matters: a horizontal observation and an observation tilted with a solar array answer different questions. Record that orientation with the channel. If the application needs direct or diffuse components, assess the necessary measurement arrangement rather than assuming one unmodified pyranometer reports every radiation component separately.
Select the output version with the receiver. Available HPRS configurations include millivolt, voltage, 4-20 mA and optional RS485 outputs. An instrument schedule must identify which one is being supplied; the product name alone is insufficient to select an acquisition input.
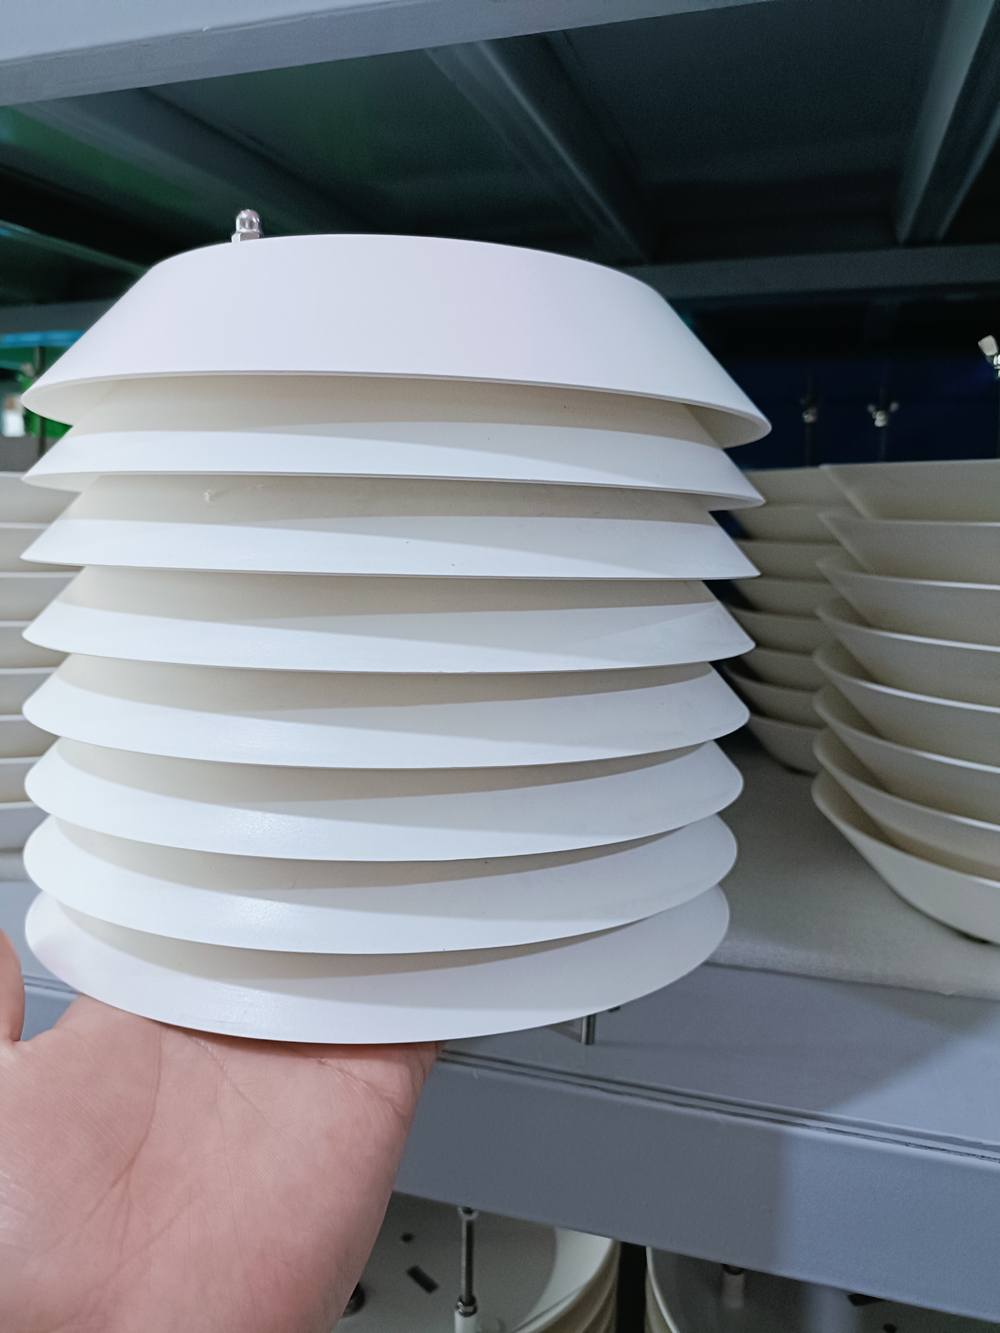
The NBL-W-PM integrated sensor uses laser scattering for particulate measurements. Its listed ranges are 0-1000 µg/m³ for PM2.5 and 0-2000 µg/m³ for PM10. It uses DC 12-24 V, an RS485 output and approximately 350 mW.
Gas measurements need the appropriate separate sensing channels. A PM2.5/PM10 label does not include NO2, CO or CO2, and an optical particle reading alone cannot identify chemical composition. If the platform calculates an air-quality index, specify the input pollutants and calculation method separately from the instrument list.
Exposure and inlet condition still matter. Avoid a position dominated by a fan outlet or a localized contaminant source unless that source is the intended monitoring target. Review contamination, moisture and service access rather than treating the shared radiation-shield appearance as proof of identical sensing functions.
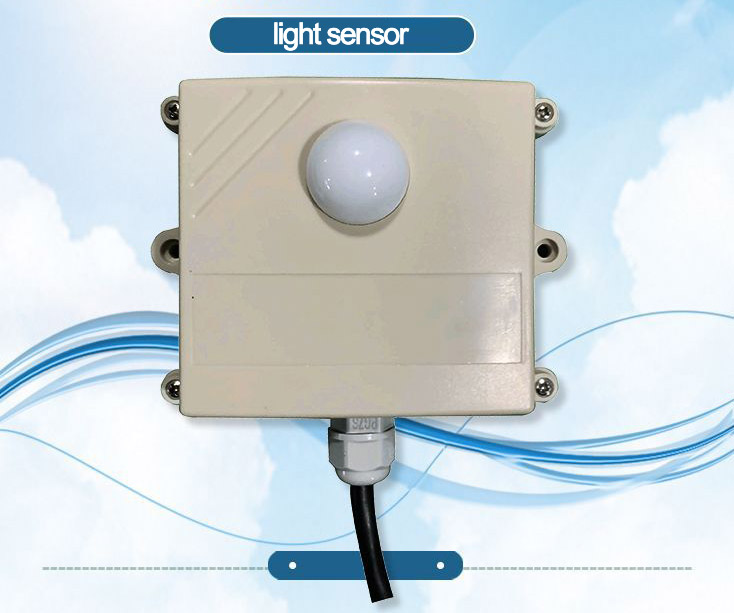
The NBL-W-LUX illuminance sensor measures 0-200,000 Lux with stated accuracy +/-7%. It covers approximately 380-730 nm and is available with RS485 Modbus RTU, 4-20 mA or 0-5 V output. Use it when the requirement is illuminance.
Crop-light work may instead require PPFD in µmol/m²/s from a suitable PAR instrument. A UV project needs the required UV band or index definition and an appropriate sensor. Neither measurement can be obtained reliably from a universal conversion applied to a Lux value. Specify the biological or radiation quantity first, then select the corresponding instrument.
For every channel, identify model, selected range, supply, output, engineering unit and installation location. Where devices share RS485, verify the supported protocol, addresses and register mapping individually. RS485 is an electrical interface; compatible Modbus RTU devices still need their own decoding rules.
For analog versions, the configured full scale and electrical input must agree. For example, a 4-20 mA input does not reveal whether its transmitter represents temperature, irradiance or illuminance. Preserve the physical quantity in the channel name and exported record, not only in a dashboard color or icon.
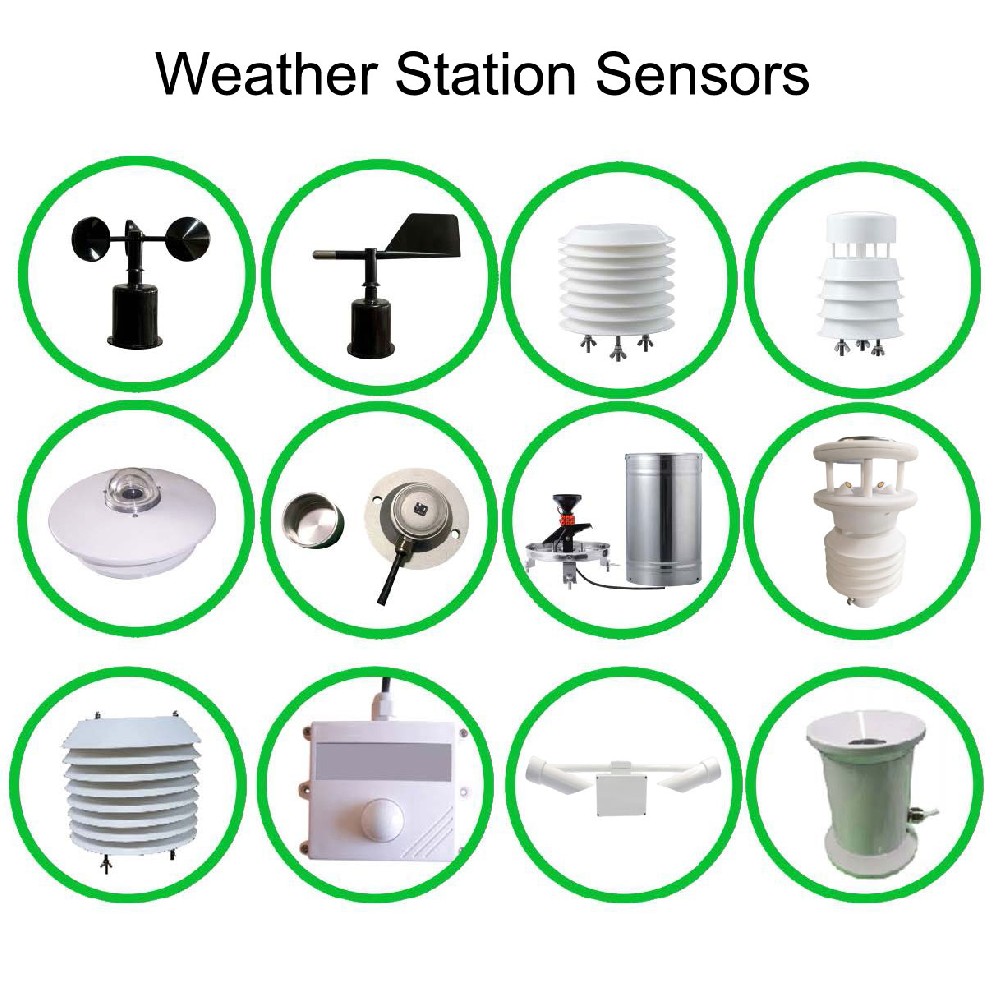
When requesting a NiuBoL configuration, send the required measured quantities rather than a generic request for nine environmental parameters. Include any required gases, snow, UV or plant-light channels explicitly. The resulting proposal can then distinguish installed instruments, calculated values and optional additions without assuming that one weather station measures everything.
No. The parameters must match the project quantities. A package with several derived display values can still lack the actual gas, soil or radiation instrument required by the customer.
No. Air relative humidity and soil water content are different quantities. Use an appropriate soil probe when the decision depends on water around the root zone.
No. The named sensor measures particulate channels. Gas concentrations require suitable additional sensors and cannot be inferred from the PM readings alone.
There is no universal conversion suitable for that purpose. Lux and broadband solar irradiance use different spectral weighting. Select a pyranometer when the required observation is W/m².
No. Confirm protocol, registers, scaling, supply and environmental requirements. Even compatible Modbus RTU sensors can have different data definitions and input settings.
State each measured variable, model, range, output, supply and quantity, plus installation and data-acquisition scope. Identify optional sensors and calculations separately so the receiving system is not built around an assumed measurement.
Environmental meteorological monitoring instruments are useful when their outputs retain a clear physical meaning. Match each requested variable to the correct instrument, unit and signal version, then carry those definitions into installation and acquisition. This prevents attractive parameter lists from obscuring the measurements the project actually needs.
Prev:Agricultural Weather Station During Tillage: Protect Soil Probes and Cables
Next:Agricultural IoT Data Usage: Sensor Records, Images and Cellular Plans
Related recommendations
Sensors & Weather Stations Catalog
 Agriculture Sensors and Weather Stations Catalog-NiuBoL.pdf
Weather Stations Catalog-NiuBoL.pdf
Agriculture Sensors Catalog-NiuBoL.pdf
Water Quality Sensor Catalog-NiuBoL.pdf
Related products
 Combined air temperature and relative humidity sensor
 TDR Soil Moisture & Temperature Sensor for irrigation| RS485 |4-20mA| NBL-S-THR
 Soil pH sensor RS485 soil Testing instrument soil ph meter for agriculture |NBL-S-PH
 Wind Speed sensor Output Modbus/RS485/Analog/0-5V/4-20mA
 Tipping bucket rain gauge for weather monitoring auto rainfall sensor RS485/Outdoor/stainless steel
 Pyranometer Solar Radiation Sensor 4-20mA/RS485


Screenshot, WhatsApp to identify the QR code
WhatsApp number:+8615367865107
(Click on WhatsApp to copy and add friends)

