





— Blogs —
—Products—
 Consumer hotline +8618073152920
WhatsApp:+8615367865107
Address:Room 102, District D, Houhu Industrial Park, Yuelu District, Changsha City, Hunan Province, China
Product knowledge
Time:2026-04-05 12:40:26 Popularity:570
A campus weather station display should tell students what was measured, when it was measured and which period a statistic covers. A large number without those labels can teach the wrong lesson even when the instrument is working correctly. Define the screen content and missing-data behavior alongside the sensors before the school accepts the installation.
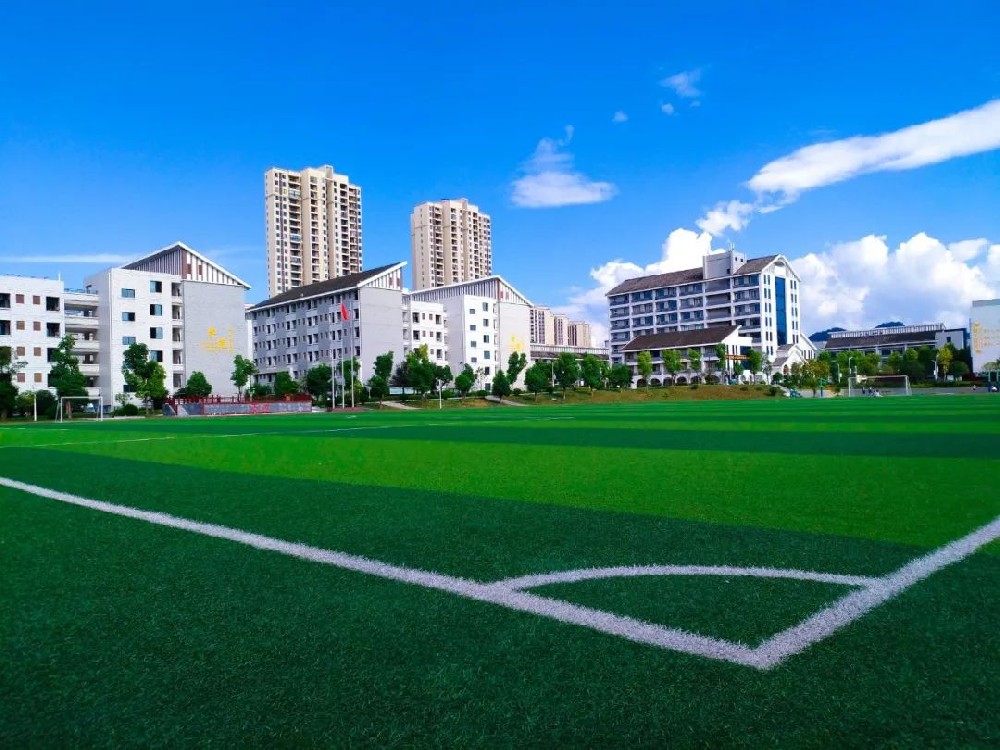
Current air temperature, today's maximum and an hourly mean are different results. A screen cycling through them should keep the statistic and period visible. The time shown by the display clock may be current even when the last sensor observation is old, so a working clock is not proof of fresh weather data.
Separate observation time from the last successful upload. If a station sends a group of stored records after a network interruption, they remain observations from the earlier periods. Do not let the latest arrival overwrite the current-value panel without checking its measurement time. Ask the installer to demonstrate that distinction using the selected acquisition system.
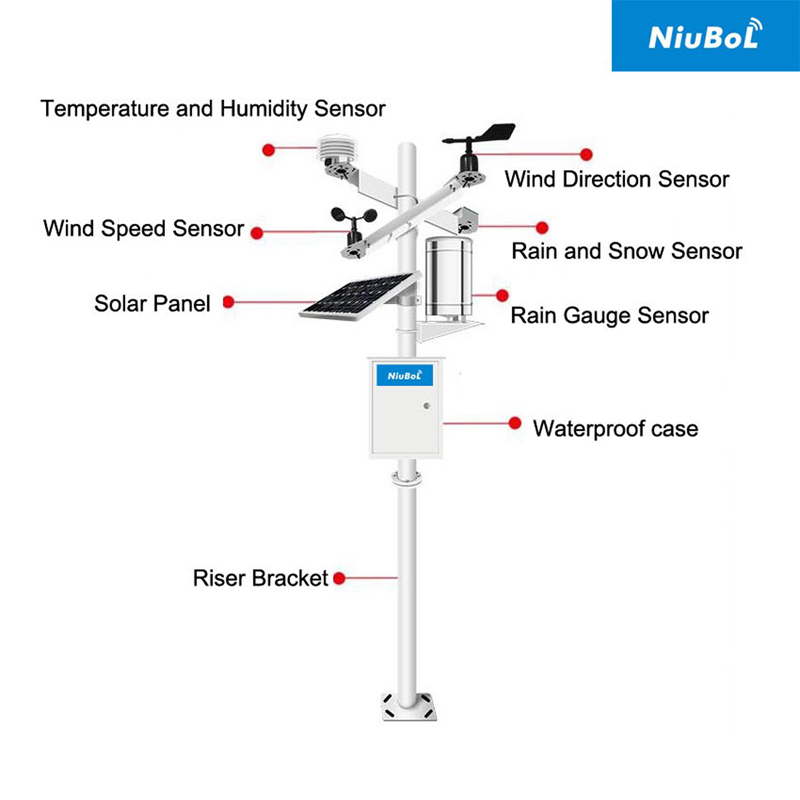
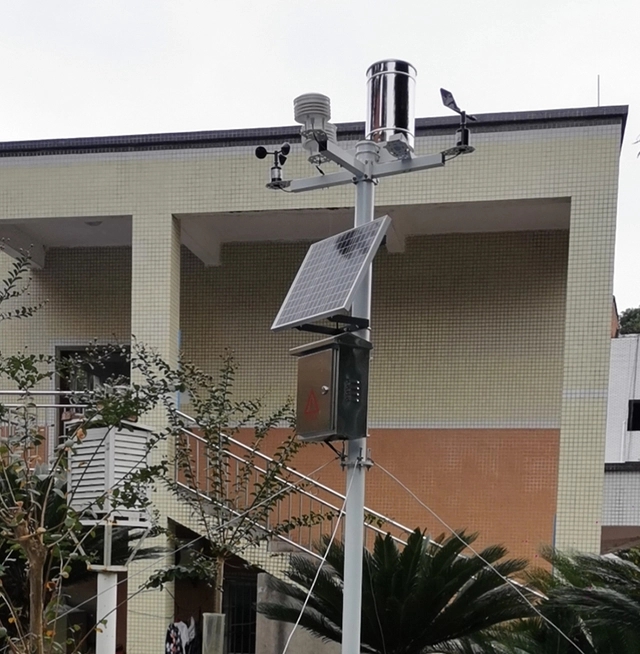
A modular NiuBoL campus station can use separate sensors for air conditions, wind and rainfall. The display should show only channels included in the delivered configuration. Additional fields in a sample dashboard are not measurements supplied by every station, and unused tiles should not remain as plausible zero values.
| Displayed quantity | Instrument example | Label to keep visible |
|---|---|---|
| Air temperature | NBL-W-LBTH: -40 to 80 C; +/-0.5 C; 0.1 C resolution | Current, mean or maximum; observation time or period |
| Relative humidity | NBL-W-LBTH: 0-100% RH; +/-5% RH | % RH, not soil moisture |
| Rainfall amount | NBL-W-RS: 0.2 mm increment in the selected configuration | mm and the accumulation period |
| Wind | NBL-W-SS speed and NBL-W-DS direction; IP65 | Speed unit, direction convention and any averaging period |
The NBL-W-LBTH digital version uses RS485 Modbus RTU with a 12-24 VDC supply. A compatible logger reads the channels; the display application determines their presentation. Confirm those functions separately instead of treating serial compatibility as a complete educational screen package.
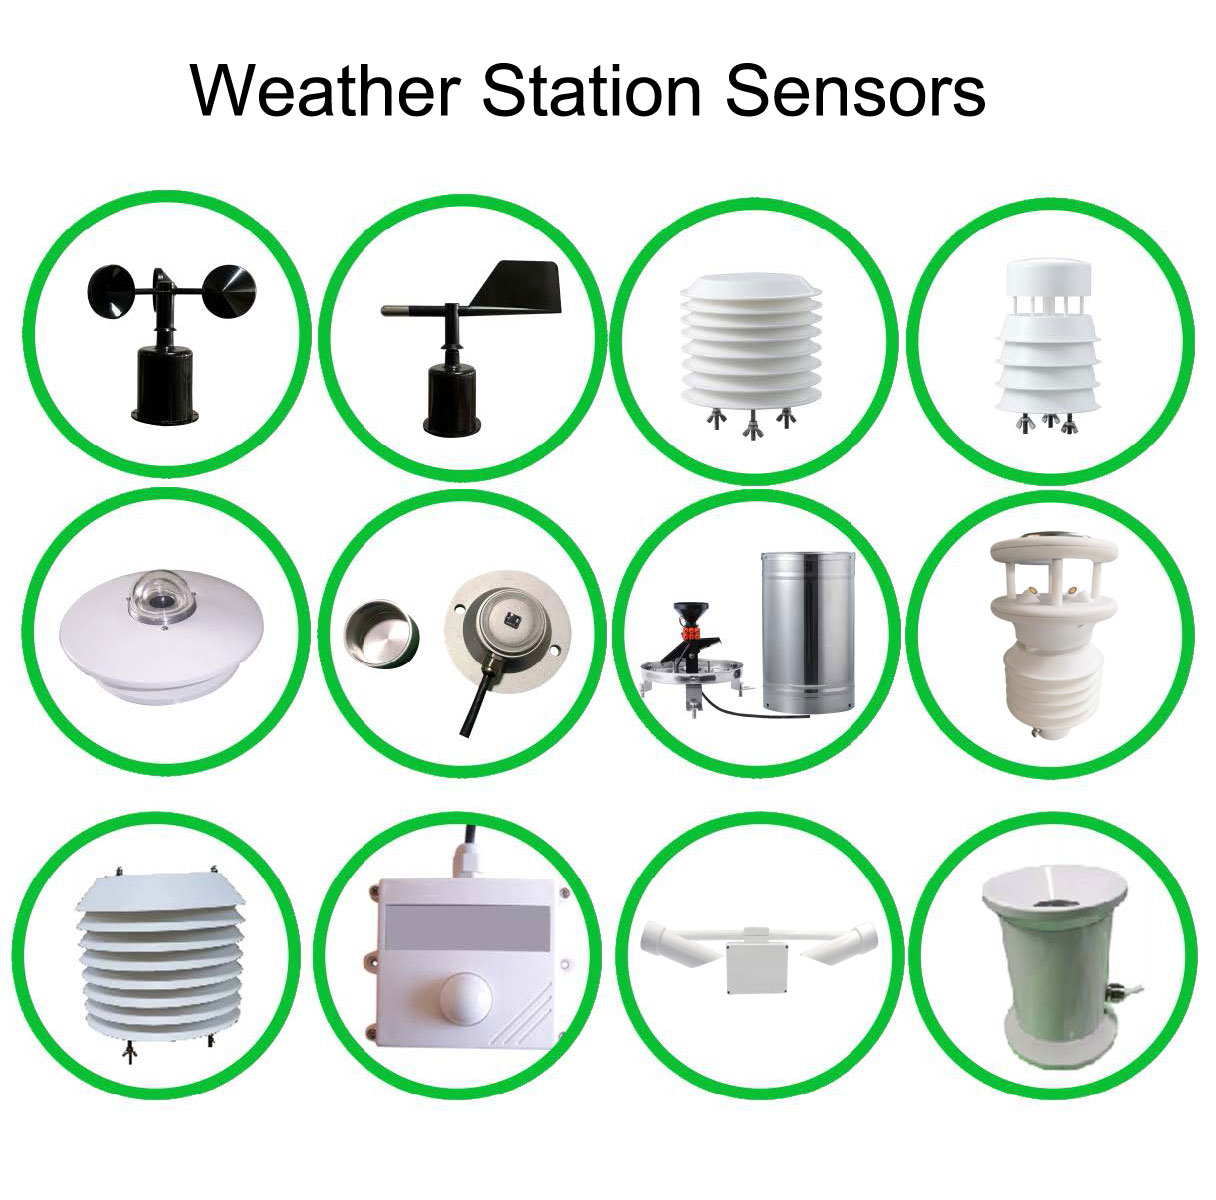
A tipping bucket rain gauge supplies increments from which amounts and rates can be calculated. Rainfall amount is expressed in mm. A rate in mm/h needs a defined interval; the current event total and the calendar-day total also need separate labels.
For an illustrative 0.2 mm bucket, five recorded tips mean 1.0 mm. If the five tips fall within a ten-minute reporting interval, the interval's mean rate is 6 mm/h. That does not establish that 6 mm fell or that the shower continued for an hour. Keep the rate interval available in the classroom record rather than presenting it as an unexplained rain number.
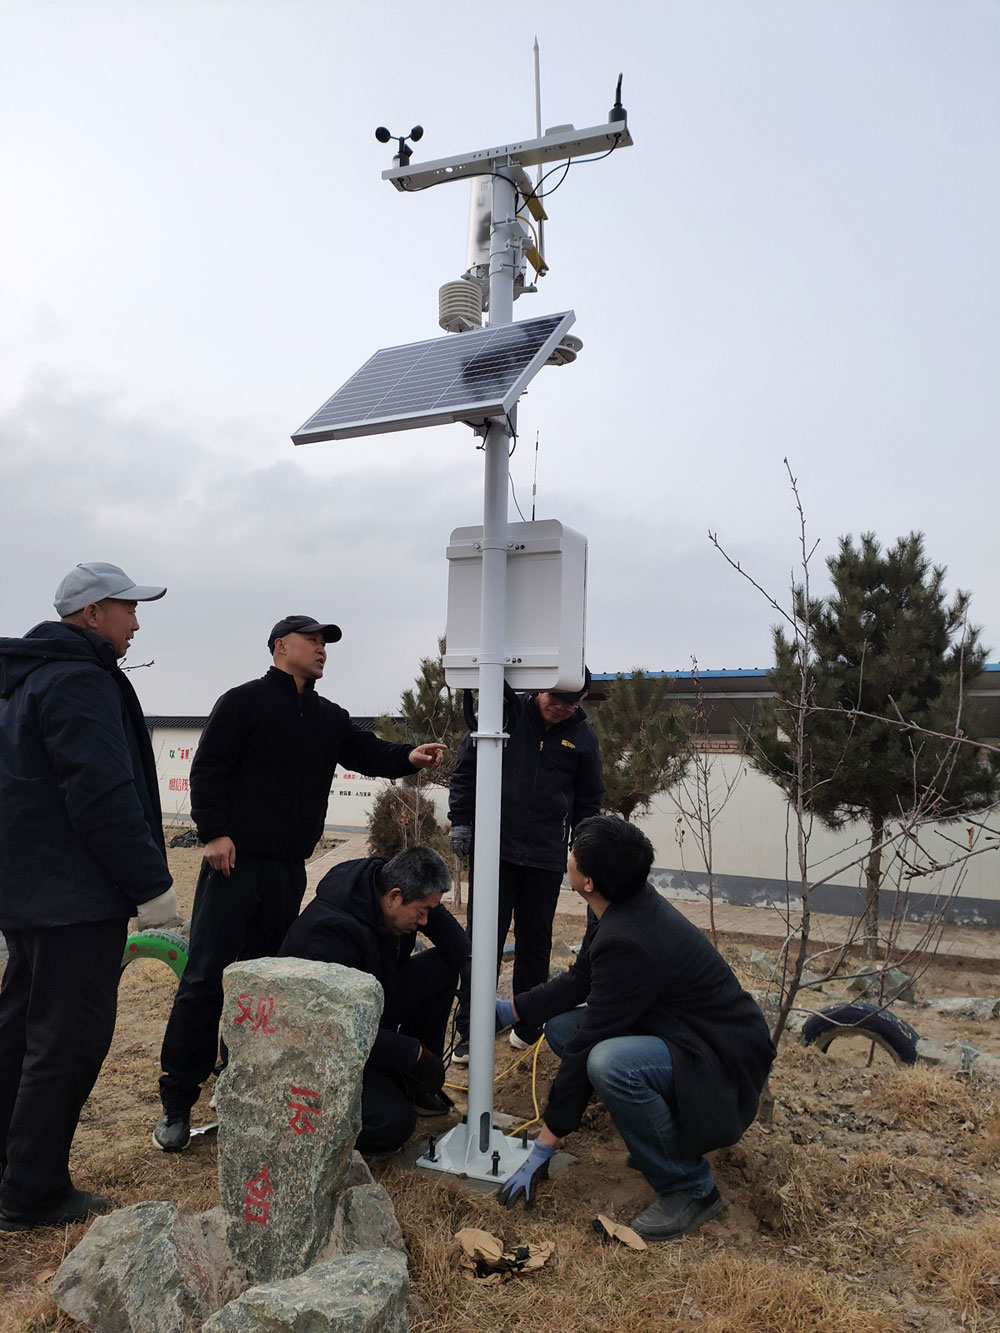
Disconnect a test input or interrupt the station-to-display link under the installer's approved procedure. Check what the screen does after the agreed freshness limit. It should distinguish an unavailable observation from a valid zero, using a clear indication supported by the chosen software.
Do not leave an old wind value on screen as current calm weather, or convert a failed rainfall read into a measured dry period. Daily statistics also need completeness information where inputs are missing. A student investigating a graph should be able to identify a gap rather than unknowingly calculate with substituted zeros.
Solar irradiance in W/m2, illuminance in lux and a UV index are different quantities. The presence of a solar-radiation sensor does not establish a UV measurement or photosynthetic photon flux density. Match the screen name and unit to the ordered instrument instead of using a general sunlight tile for all three.
Pressure needs an equally explicit label. A station-pressure observation and a calculated sea-level value should not be compared as identical numbers. For teaching, a single pressure rise or fall is not a reliable sunny-or-rainy prediction. Keep an external forecast separate from the station's measured observations.
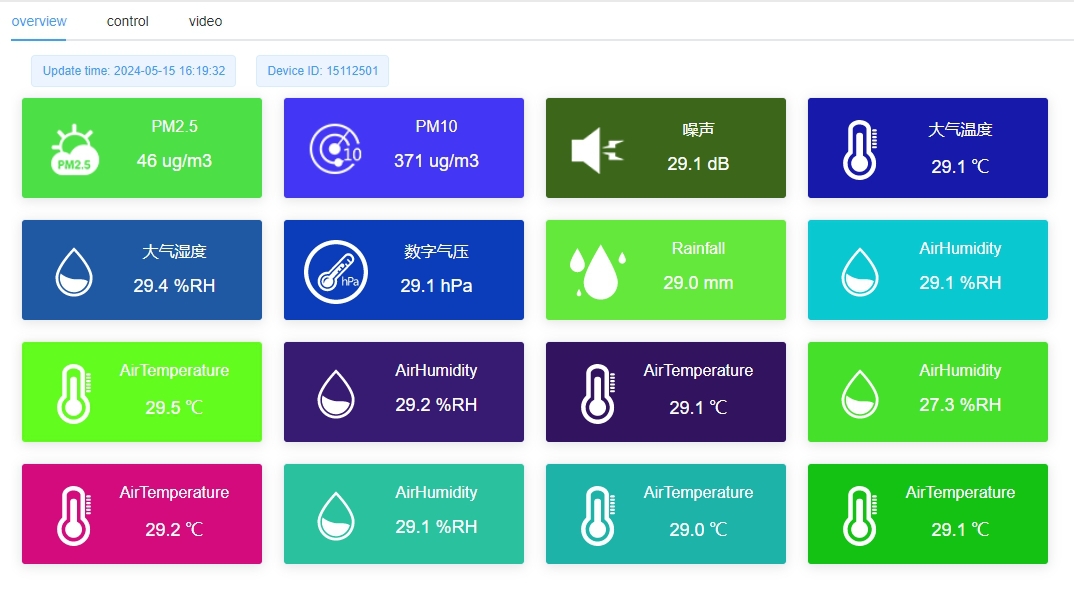
Use historical or clearly marked demonstration data where appropriate. Do not mix simulated weather into the school's live archive. Staff should be able to repeat the demonstration without opening electrical equipment or giving students access to maintenance settings.
Not when lessons require calculations or historical comparisons. Specify the export format, units and observation periods alongside the screen so teachers can inspect the underlying records.
Use mm for an amount and mm/h for a rate over an identified interval. Both can be displayed if the labels and processing distinguish them.
No. Check the observation time or age of each relevant channel. The screen can remain online while sensor acquisition has stopped.
That depends on its controller and software. Provide the installer with the screen interface and required presentation, then test the actual record path rather than assuming every display card reads Modbus directly.
Ask NiuBoL and the project integrator to identify sensor channels, data acquisition, display integration, export and staff instructions separately. Include the required labels and unavailable-data demonstration in acceptance.
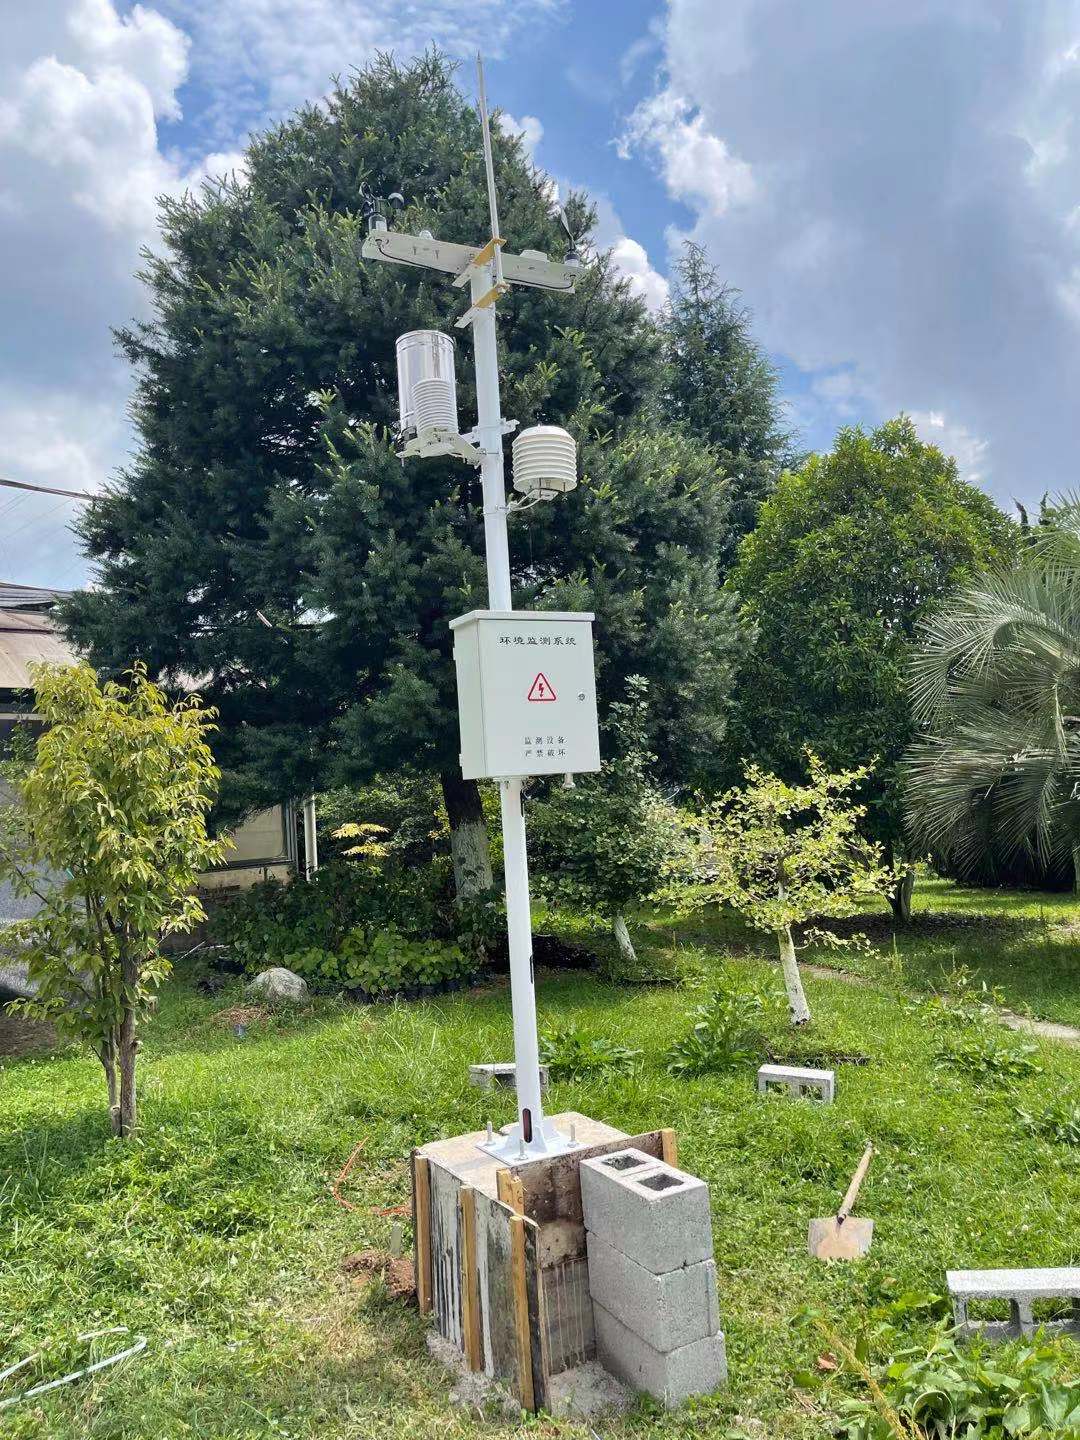
A campus weather station display is a teaching tool only when its numbers remain understandable. Keep units, observation age and statistical periods visible, and distinguish gaps from genuine zero values. Accept the display and exported records together so the school's NiuBoL observations can support reproducible classroom work.
Prev:Smart Pole Light Monitoring: Illuminance Is Not Solar Radiation
Next:Rainfall Event Separation: Define Dry Gaps, Tip Times and Counter Resets
Related recommendations
Sensors & Weather Stations Catalog
 Agriculture Sensors and Weather Stations Catalog-NiuBoL.pdf
Weather Stations Catalog-NiuBoL.pdf
Agriculture Sensors Catalog-NiuBoL.pdf
Water Quality Sensor Catalog-NiuBoL.pdf
Related products
 Combined air temperature and relative humidity sensor
 TDR Soil Moisture & Temperature Sensor for irrigation| RS485 |4-20mA| NBL-S-THR
 Soil pH sensor RS485 soil Testing instrument soil ph meter for agriculture |NBL-S-PH
 Wind Speed sensor Output Modbus/RS485/Analog/0-5V/4-20mA
 Tipping bucket rain gauge for weather monitoring auto rainfall sensor RS485/Outdoor/stainless steel
 Pyranometer Solar Radiation Sensor 4-20mA/RS485


Screenshot, WhatsApp to identify the QR code
WhatsApp number:+8615367865107
(Click on WhatsApp to copy and add friends)

