


— Blogs —
—Products—
 Consumer hotline +8618073152920
 WhatsApp:+8615367865107
Address:Room 102, District D, Houhu Industrial Park, Yuelu District, Changsha City, Hunan Province, China
Product knowledge
Time:2026-02-05 11:45:36 Popularity:530
In the context of parity grid access and continuously extending photovoltaic asset holding periods, photovoltaic power stations have fully shifted from "extensive construction" to "refined asset operations." For system integrators (SI) and engineering contractors (EPC), delivering systems with high return on investment (ROI) to owners depends on precise capture of underlying environmental data. NiuBoL solar power environmental monitors are not only meteorological data collection terminals but also decision engines driving intelligent O&M systems and enhancing photovoltaic asset valuation.

Modern photovoltaic power station O&M has moved beyond the passive "fix when broken" mode. By integrating high-precision environmental monitoring stations, system integrators can provide differentiated competitive advantages for O&M platforms.
Through real-time monitoring of environmental temperature and humidity, strong winds, and sudden irradiance drops by NiuBoL sensors, combined with inverter operation curves, the system can establish environmental load models. Integrators can use this data to predict fault risks of inverters and combiner boxes under specific climatic stresses, triggering maintenance work orders before incidents occur, significantly reducing power loss from unplanned downtime.
Dust shading is a major variable affecting distributed photovoltaic efficiency. By comparing real-time irradiance with actual power generation, intelligent algorithms can accurately calculate generation gain loss caused by dust. NiuBoL monitoring solutions provide scientific triggering conditions for cleaning robots or manual cleaning, ensuring optimal cost-benefit analysis (CBA) for cleaning investments.
In distributed rooftop stations or large ground-mounted stations, drone inspections have become standard. Real-time wind speed and gust information provided by NiuBoL weather stations serves as key limiting conditions for drone autonomous driving systems to determine safe operation windows. Through data API linkage, automated scheduling of inspection operations and emergency return-to-home protection can be achieved.

For asset holders and financial institutions, power station environmental data directly relates to the book value and risk control of assets.
PR value (Performance Ratio) is an internationally recognized indicator for evaluating photovoltaic power station operational quality. Calculating PR value requires high-precision plane-of-array (POA) irradiance data. Data provided by NiuBoL solar power environmental monitors features high stability and low uncertainty, serving as the foundation for generating authoritative performance reports and cross-station benchmarking.
In cases of extreme weather events (such as sandstorms, hail, super typhoons) causing sharp drops in generation, insurers require on-site measured environmental evidence. Instantaneous maximum wind speeds, rainfall intensity, and irradiance fluctuation curves recorded by NiuBoL constitute a complete claims evidence chain, safeguarding the financial security of photovoltaic assets.
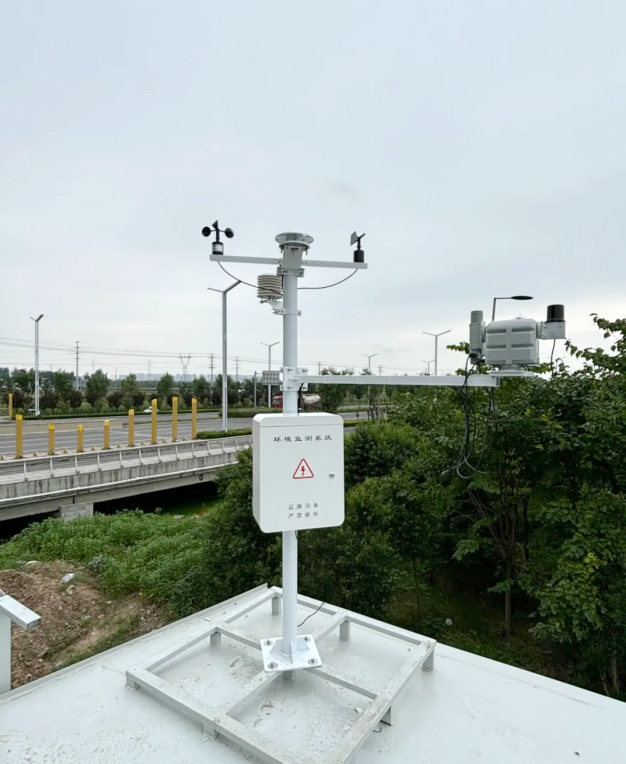
For distributed photovoltaics (especially commercial and industrial rooftops), significant deviations exist between local microclimates and regional weather station data. Integrators should reasonably configure monitoring modules based on project scale and budget.
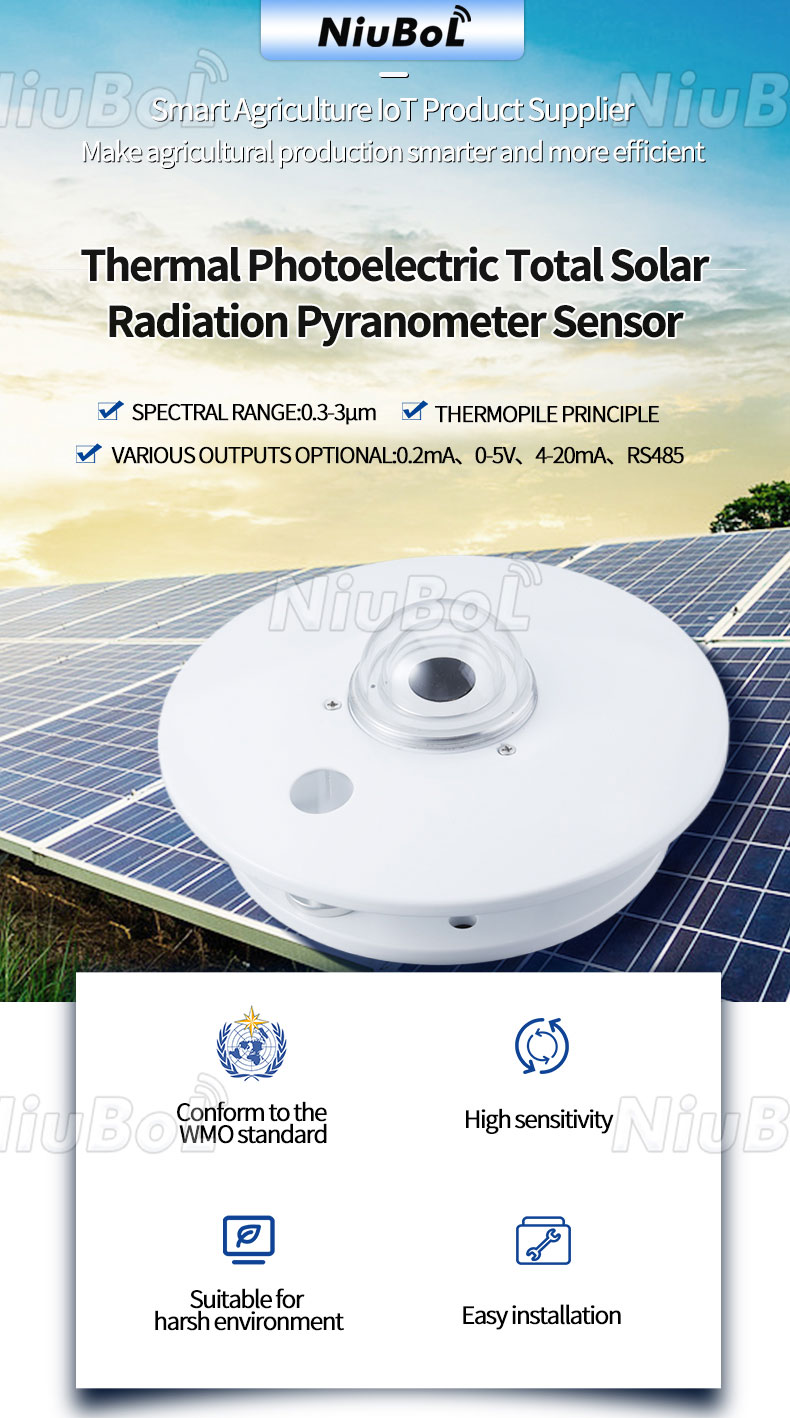
1. Global Horizontal Irradiance and Plane-of-Array Irradiance (POA) Monitoring
Global irradiance: Measures resource endowment in the station area.
Tilted irradiance: Directly reflects effective energy received by photovoltaic arrays, core parameter for calculating expected generation.
2. Module Temperature and Ambient Temperature/Humidity
Module backsheet temperature: Photovoltaic module output power decays with temperature rise (temperature coefficient). Monitoring backsheet temperature enables real-time compensation calculation of generation efficiency.
Ambient temperature/humidity: Affects module heat dissipation efficiency and serves as important reference for assessing aging rate of electrical components in combiner boxes.
3. Wind Speed and Direction
Wind speed: In addition to assisting module heat dissipation evaluation, it is critical for mechanical safety of distributed rooftop bracket structures, especially for wind protection linkage in tracking systems.
4. Data Collector (RTU) and Communication Protocol
Industrial-grade compatibility: Full NiuBoL monitoring series supports standard RS485 Modbus-RTU communication protocol.
Easy integration: Physical interfaces and logical protocols optimized for mainstream PLCs, data acquisition gateways, and inverter monitoring serial ports, supporting seamless access to SCADA systems.

When designing solutions, integrators need to focus on the following technical indicators:
Data stability and sampling frequency: In contexts where grid dispatch requires extremely high power forecasting accuracy, environmental monitors must have high-frequency sampling capability (e.g., 1s or 5s level) to support short-term power forecasting models.
Sensor accuracy grade: Class A pyranometers (ISO 9060 Class A) suitable for high-standard station evaluation, while cost-effective silicon-cell-based sensors suitable for large-scale deployment in distributed rooftops.
Protection rating and environmental adaptability: Harsh station environments require IP65 or higher protection, with shells resistant to UV and salt spray (essential for coastal stations).
Maintenance-free design: Reduce measurement drift due to sensor contamination (e.g., lens dust).
| Monitoring Item | Common Sensor Type | Typical Application Significance |
|---|---|---|
| Irradiance | Pyranometer / Silicon-cell radiometer | PR value calculation, photoelectric conversion efficiency evaluation |
| Ambient Temperature | Platinum resistance / Digital sensor | Module efficiency attenuation compensation analysis |
| Module Temperature | Contact backsheet patch type | Monitoring module hot spot risk and temperature loss |
| Wind Speed and Direction | Ultrasonic / Mechanical type | Structural safety protection, heat dissipation simulation |
| Communication Interface | RS485 (Modbus-RTU) | System integration, data synchronization, platform docking |
Q1: Why can't distributed photovoltaics directly use meteorological bureau data?
Meteorological bureau monitoring points are often several to tens of kilometers away from the station. Distributed photovoltaics (especially rooftops) are significantly affected by local shading or heat island effects from surrounding buildings and terrain, with measured POA (tilted irradiance) and ambient temperature potentially deviating more than 15% from meteorological station data, making it unsuitable for precise O&M.
Q2: How are NBL series sensors applied in photovoltaic tracking systems (Tracker)?
NiuBoL wind speed sensors can link in real time with tracking system controllers. When wind speed exceeds set safety thresholds, the control system forces the bracket into "wind-avoidance flat mode" to prevent torsional vibration damage to the structure caused by gusts.
Q3: What are the advantages of RS485 Modbus-RTU protocol in multi-node integration?
The protocol is standardized, supports long-distance transmission, and has strong anti-interference capability. In photovoltaic sites, integrators can connect multiple sensors such as rainfall, irradiance, and temperature on the same bus, collected uniformly by one RTU, significantly reducing wiring complexity and hardware costs.

Q4: Where should the module temperature sensor be installed?
It is recommended to install it in the center of the photovoltaic array's backsheet, avoiding junction boxes and bracket beams, to ensure it reflects the true operating temperature of the module.
Q5: How to handle measurement drift in pyranometers caused by dust contamination?
It is recommended to include sensor cleaning in the O&M plan, typically on the same cycle as photovoltaic panel cleaning. Alternatively, choose sensors with self-cleaning design or high-sensitivity optics to reduce the impact of environmental deposits on accuracy.
Q6: Does NiuBoL solar environmental monitor support 12V or 24V power supply?
Our products typically support wide voltage input (e.g., DC 12-24V) to adapt to common industrial power standards in photovoltaic stations, facilitating direct power draw from combiner boxes or communication boxes.
Q7: How reliable is the equipment in extremely cold or high-altitude areas?
NiuBoL uses industrial-grade components with an operating temperature range covering -40℃ to 85℃. The shell undergoes anti-corrosion treatment, meeting long-term operation requirements in high-altitude, strong UV environments.

Photovoltaic power station environmental monitoring is no longer merely an industry standard requirement but an indispensable productivity tool in digital operations. The solar power environmental monitoring system provided by NiuBoL, through precise physical-layer perception, builds a solid data foundation for system integrators and EPC contractors. In the wave of parity grid access and stock station retrofits, mastering high-quality environmental data means mastering the future of photovoltaic asset management.
To system integrator partners:
If you are looking for highly stable, highly integrated monitoring solutions that comply with photovoltaic industry standards, NiuBoL is always ready to provide customized OEM/ODM support and detailed technical integration protocols.
Do you need us to provide communication protocol adaptation solutions for specific inverter brands, or a detailed distributed photovoltaic station installation wiring diagram?
 NBL-W-SRS-Solar-radiation-sensor-instruction-manual-V4.0.pdf
NBL-W-HPRS-Solar-Radiation-Sensor-Instruction-Manual-V3.0.pdf
NBL-W-PSS Soiling Sensor Photovoltaic Dust Monitoring Instrument Data Sheet.pdf
Prev:Forward Scattering Visibility Sensor: Smart City and Industrial Environment Integration Solution
Next:Transmission Line Micro-Meteorological Monitoring System Selection Guide
Related recommendations
Sensors & Weather Stations Catalog
Agriculture Sensors and Weather Stations Catalog-NiuBoL.pdf
Weather Stations Catalog-NiuBoL.pdf
Agriculture Sensors Catalog-NiuBoL.pdf
Water Quality Sensor Catalog-NiuBoL.pdf
Related products
 Combined air temperature and relative humidity sensor
 Soil Moisture Temperature sensor for irrigation|NBL-S-THR
 Soil pH sensor RS485 soil Testing instrument soil ph meter for agriculture |NBL-S-PH
 Wind Speed sensor Output Modbus/RS485/Analog/0-5V/4-20mA
 Tipping bucket rain gauge for weather monitoring auto rainfall sensor RS485/Outdoor/stainless steel
 Pyranometer Solar Radiation Sensor 4-20mA/RS485

Screenshot, WhatsApp to identify the QR code
WhatsApp number:+8615367865107
(Click on WhatsApp to copy and add friends)
