


— Blogs —
—Products—
 Consumer hotline +8618073152920
 WhatsApp:+8615367865107
Address:Room 102, District D, Houhu Industrial Park, Yuelu District, Changsha City, Hunan Province, China
Product knowledge
Time:2026-03-06 17:23:11 Popularity:382
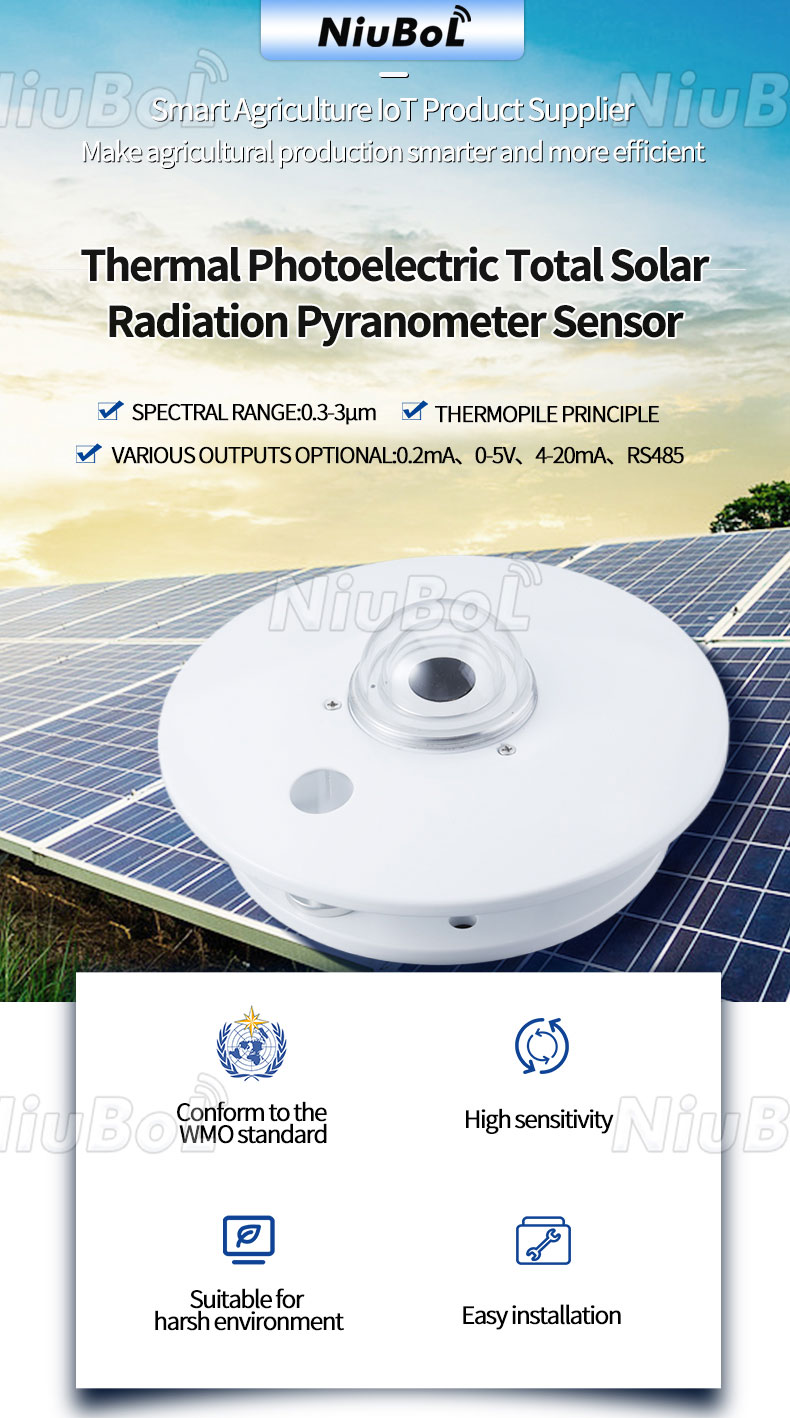
The actual power generation performance of photovoltaic power plants is jointly influenced by multiple environmental factors such as solar irradiance intensity, spectral distribution, module temperature, wind speed and direction, and atmospheric transparency. Under fixed installed capacity, improving power generation per unit area (kWh/kWp) has become one of the core competitiveness factors in the industry. As a power plant-level meteorological data acquisition terminal, the photovoltaic environmental monitor provides reliable environmental parameter foundation for system integrators, IoT solution providers, and engineering companies through high precision, multi-element, and long-term stable operation, supporting power generation performance analysis, PR (Performance Ratio) calculation, module degradation assessment, inverter MPPT optimization verification, and provincial dispatch center data reporting.

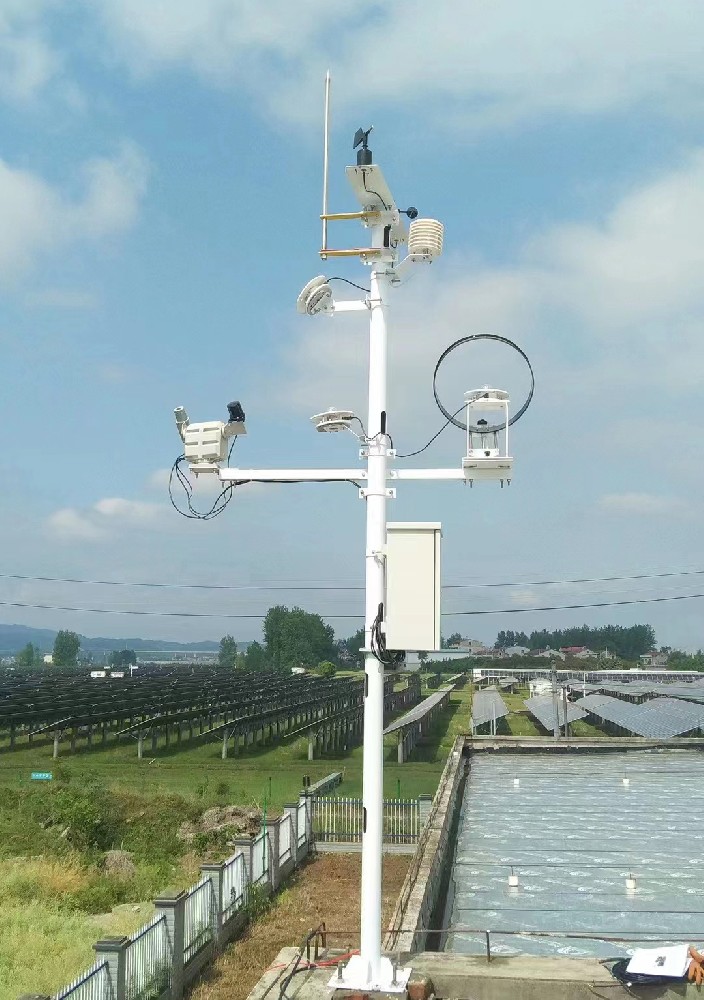
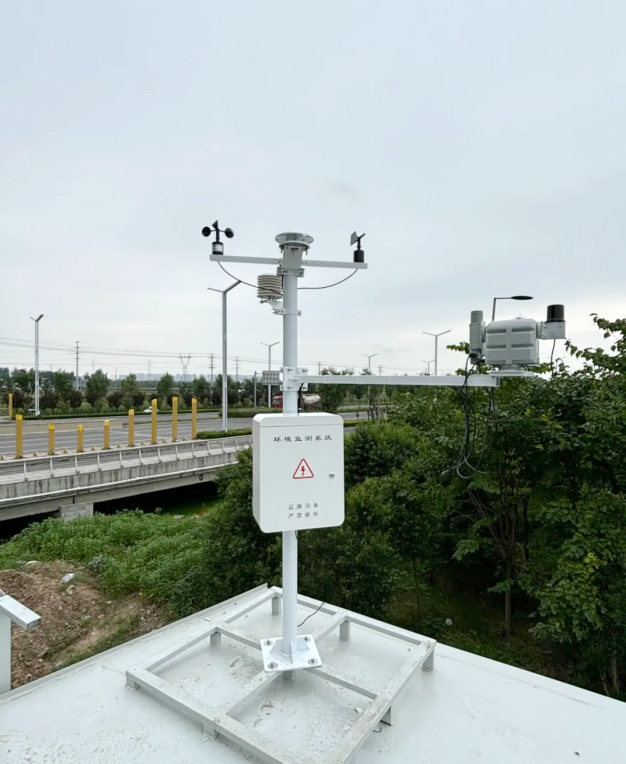
The NiuBoL photovoltaic environmental monitor strictly adheres to the World Meteorological Organization (WMO) observation specifications and IEC 61724-1 photovoltaic system performance monitoring standards, meeting the latest photovoltaic power plant meteorological data reporting requirements of State Grid and China Southern Power Grid. It features high stability, low maintenance, and unattended operation, suitable for various scenarios including ground-mounted centralized photovoltaic power plants, distributed rooftop photovoltaics, agri-PV complementary projects, fishery-PV complementary projects, and more.

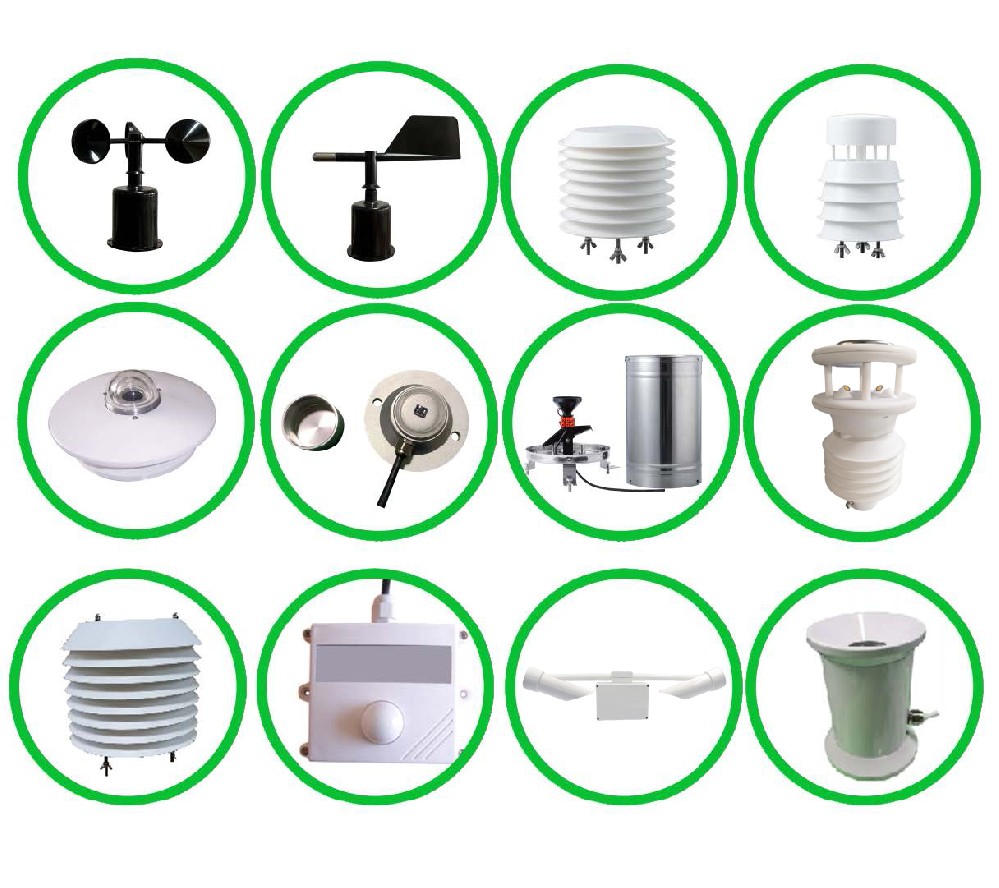
The key environmental parameters affecting photovoltaic power generation efficiency mainly focus on three categories: irradiance, temperature, and wind field. The typical configuration of the NiuBoL system is shown in the table below (flexible selection available according to power plant scale and reporting requirements):
| Monitoring Element | Sensor Type | Measurement Range | Compliance Standard / Engineering Significance |
|---|---|---|---|
| Global Horizontal Irradiance (GHI) | Thermopile (Secondary Standard) | 0 ~ 2000 W/m² | IEC 61724 / Reference irradiance for PR calculation |
| Diffuse Horizontal Irradiance (DHI) | Thermopile + Shadow Ring | 0 ~ 2000 W/m² | DNI = GHI - DHI for direct component calculation |
| Direct Normal Irradiance (DNI) | Thermopile + Tracker or Calculation | 0 ~ 2000 W/m² | Concentrated PV and tracking system performance evaluation |
| PV Module Backsheet Temperature | Pt1000 / NTC Patch Type | -40 ~ +90 °C | Temperature coefficient correction, actual module power prediction |
| Ambient Air Temperature | Pt1000 / Radiation Shield | -40 ~ +80 °C | Ambient reference temperature, heat island effect assessment |
| Module Surface Temperature (Optional) | Infrared Thermometry / Contact Type | -40 ~ +150 °C | Hot spot detection assistance, pre/post-cleaning comparison |
| Wind Speed | Three-Cup / Ultrasonic | 0 ~ 60 m/s | Forced convection cooling, module cooling efficiency |
| Wind Direction | Magnetic Encoder | 0 ~ 360 ° | Dust deposition and cooling direction analysis |
| Barometric Pressure | Silicon Piezoresistive | 300 ~ 1100 hPa | Air density correction, irradiance adjustment |
| Rainfall | Tipping Bucket / Weighing Type | 0 ~ ∞ mm | Rain cleaning effect, soiling loss assessment |
Long-term irradiance, temperature, and wind speed distribution data used for modeling in PVSyst, SAM, etc.
DNI/GHI ratio evaluation for fixed vs. tracking system economic feasibility
Extreme high temperature/high wind frequency statistics to support module selection and mounting structure wind resistance design
Deployment of pyranometers and temperature sensors in accordance with IEC 61724-1 Class A/B requirements
Provision of 12-month pre-commissioning meteorological baseline data for subsequent performance guarantee (PPA) comparison
Real-time module temperature and irradiance data used for temperature-corrected power prediction
Calculation of actual PR, temperature-corrected PR, expected PR deviation to locate module degradation, soiling, shading, inverter anomalies
Wind speed and direction data assist in analyzing natural cleaning effects and soiling loss models
Rainfall data quantifies the contribution of precipitation to module surface cleaning
Large-scale ground-mounted centralized PV power plants (>100 MW): Multi-point distributed monitoring, grid-based irradiance field assessment
Distributed rooftop / commercial & industrial PV: Compact integrated station, focusing on module backsheet temperature and ambient wind field
Agricultural-PV / Fishery-PV complementary projects: Additional humidity and rainfall monitoring to evaluate agricultural impact and module heat dissipation differences
Tracking PV systems: High-precision DNI monitoring for tracker angle optimization verification
PV + Energy Storage power plants: Irradiance sudden change warning to support power forecasting and storage charge/discharge strategy

| Power Plant Scale / Type | Recommended Configuration Level | Mandatory Elements | Optional Elements | Recommended Communication Method |
|---|---|---|---|---|
| <10 MW Distributed Rooftop | Compact Class B | GHI, Module Temperature, Ambient Temperature, Wind Speed | Rainfall, Humidity | RS485 / 4G |
| 10–100 MW Ground-mounted Power Plant | Standard Class A/B | GHI, DHI, Multi-point Module Temperature, Wind Speed & Direction | DNI, Rainfall, Barometric Pressure | RS485 + LoRa / 4G Master Station |
| >100 MW Large-scale Base | Class A + Redundancy | GHI, DHI, DNI, Multi-point Module Temperature, Wind Field | Rainfall, Humidity, Infrared Backsheet | Fiber Optic / LoRa Networking + 4G |
| Tracking System Power Plant | Class A | DNI (Tracked), GHI, Module Temperature | Wind Speed & Direction (Limit Protection) | RS485 / MQTT |
| Projects Requiring Provincial Dispatch Direct Reporting | Class A | Full Irradiance + Temperature + Wind + Rainfall | Barometric Pressure, Humidity | Modbus TCP |
Installation Location: Pyranometer must be installed horizontally, 1.5–2 m above ground, avoiding obstructions; module temperature sensor attached to the central lower 1/3 of the backsheet, avoiding edge effects
Lightning Protection and Grounding: Power and signal ports with three-level lightning protection (20 kA), reliable equipotential grounding between equipment and mounting structure
Communication Protocol: Standard Modbus RTU (RS485, 9600,8N1), supports Modbus TCP passthrough; LoRa networking suitable for multi-point power plants
Data Validation: Built-in logical validation rules (GHI ≥ DNI + DHI ±5%, etc.), automatic alarm for anomalies
Power Supply: Solar + battery solution, recommended ≥60 W PV + 30–50 Ah lithium battery, ensuring ≥7 days continuous operation during rainy periods
Maintenance Cycle: Clean pyranometer glass dome quarterly; compare temperature sensors annually; calibrate rain gauge semi-annually

1. What is the main difference between a photovoltaic environmental monitor and a regular weather station?
PV-specific stations focus on global/diffuse/direct irradiance, module backsheet temperature, and wind field, strictly complying with IEC 61724-1 and grid reporting specifications. Regular weather stations typically do not include DNI or multi-point module temperature monitoring.
2. How to accurately measure backsheet temperature with the module temperature sensor?
Use high-thermal-conductivity thermal paste to attach to the central lower position of the module backsheet, avoiding air gaps; for multiple strings, it is recommended to install one monitoring point every 10–20 modules.
3. How does the pyranometer accuracy meet provincial dispatch reporting requirements?
NiuBoL uses secondary standard thermopile sensors with annual stability better than ±2%, traceable calibration by national metrology institutes, meeting State Grid / China Southern Power Grid data quality requirements.
4. How to network multi-point module temperature monitoring?
Recommended LoRa wireless networking (coverage radius 1–3 km), each node collects independently and aggregates to the master station, then uploads to cloud or local server via 4G/fiber.
5. How does the system cope with extreme high temperature and strong wind environments?
Equipment operating temperature -40~+85℃, IP65 or higher protection; mounting structure designed according to local maximum wind speed (≥40 m/s), pyranometer with optional heating and dehumidification function.
6. How to interface data with photovoltaic monitoring system (SCADA)?
Direct access to mainstream combiner box/inverter monitoring platforms via Modbus RTU/TCP or MQTT protocol, supporting custom register mapping.
7. How to handle missing or abnormal irradiance data?
System has built-in backup algorithms (based on nearby point interpolation or historical trends) and issues alarms; recommended to configure redundant pyranometers to improve data availability.
8. Does it support integration with power forecasting systems?
Yes. Real-time GHI, DNI, temperature, and wind speed data can be uploaded to forecasting models via API or Modbus to improve short-term power forecast accuracy.
The photovoltaic environmental monitor serves as a bridge connecting meteorological conditions and photovoltaic power generation performance, directly impacting the economic evaluation, operation and maintenance decisions, and compliance reporting throughout the power plant lifecycle. The NiuBoL photovoltaic environmental monitor, with dual WMO/IEC standard accuracy, multi-element coverage, stable communication, and low-maintenance design, provides system integrators and engineering companies with a trustworthy industrial-grade solution.
In the context of the “dual carbon” goals and high-quality development of new energy, selecting a dedicated meteorological monitoring system that meets grid direct reporting requirements and offers rich integration interfaces not only improves actual power generation efficiency and PR value of the power plant, but also provides solid data foundation for performance guarantees, asset evaluation, and green finance.
For specific power plant installed capacity, terrain conditions, provincial dispatch protocols, or integration solutions with existing SCADA/power forecasting platforms, welcome to communicate with the NiuBoL technical team for on-site survey, selection advice, and customized deployment services.
 NBL-W-HPRS-Solar-Radiation-Sensor-Instruction-Manual-V3.0.pdf
NBL-W-SRS-Solar-radiation-sensor-instruction-manual-V4.0.pdf
NBL-W-PPT-SMD-Solar-Panel-Temperature-Sensors.pdf
NBL-W-PSS Soiling Sensor Photovoltaic Dust Monitoring Instrument Data Sheet.pdf
Related recommendations
Sensors & Weather Stations Catalog
Agriculture Sensors and Weather Stations Catalog-NiuBoL.pdf
Weather Stations Catalog-NiuBoL.pdf
Agriculture Sensors Catalog-NiuBoL.pdf
Water Quality Sensor Catalog-NiuBoL.pdf
Related products
 Combined air temperature and relative humidity sensor
 Soil Moisture Temperature sensor for irrigation|NBL-S-THR
 Soil pH sensor RS485 soil Testing instrument soil ph meter for agriculture |NBL-S-PH
 Wind Speed sensor Output Modbus/RS485/Analog/0-5V/4-20mA
 Tipping bucket rain gauge for weather monitoring auto rainfall sensor RS485/Outdoor/stainless steel
 Pyranometer Solar Radiation Sensor 4-20mA/RS485

Screenshot, WhatsApp to identify the QR code
WhatsApp number:+8615367865107
(Click on WhatsApp to copy and add friends)
