





— Blogs —
—Products—
 Consumer hotline +8618073152920
WhatsApp:+8615367865107
Address:Room 102, District D, Houhu Industrial Park, Yuelu District, Changsha City, Hunan Province, China
Product knowledge
Time:2025-11-02 15:22:00 Popularity:993
Quick Answer: A PV soiling sensor estimates the effect of surface contamination at its installation point. It can support cleaning analysis when placement, reference condition, maintenance and plant-power data are controlled; it does not guarantee an energy gain or cleaning saving by itself. For NBL-W-PSS, read the cleanliness channels correctly before using them in a cleaning decision.

The question for a solar plant is not simply whether dust exists. It is whether cleaning a defined array section is likely to recover enough useful energy to justify the work, water and operational disruption. A falling cleanliness signal can help identify a trend, but the decision also needs plant availability, expected irradiation and the likely benefit of the proposed cleaning method.
A single poor production day is not a soiling test. Cloud, inverter curtailment, outages, temperature and shading can all change output. Match measurement times and separate those conditions before attributing an energy shortfall to dirt. This is particularly important when a dashboard combines several sensor channels with inverter totals collected on different intervals.
The sensor is one part of a monitoring chain that may also include plane-of-array irradiance, module temperature, weather measurements, inverter data, a logger and SCADA. The logger collects and timestamps the channels. The plant's analysis method then compares soiling information with power, weather and cleaning records.
One measurement point may not represent an entire site with different module tilts, roads, vegetation, wind exposure or cleaning practices. Divide the plant into soiling zones before deciding sensor quantity and location.
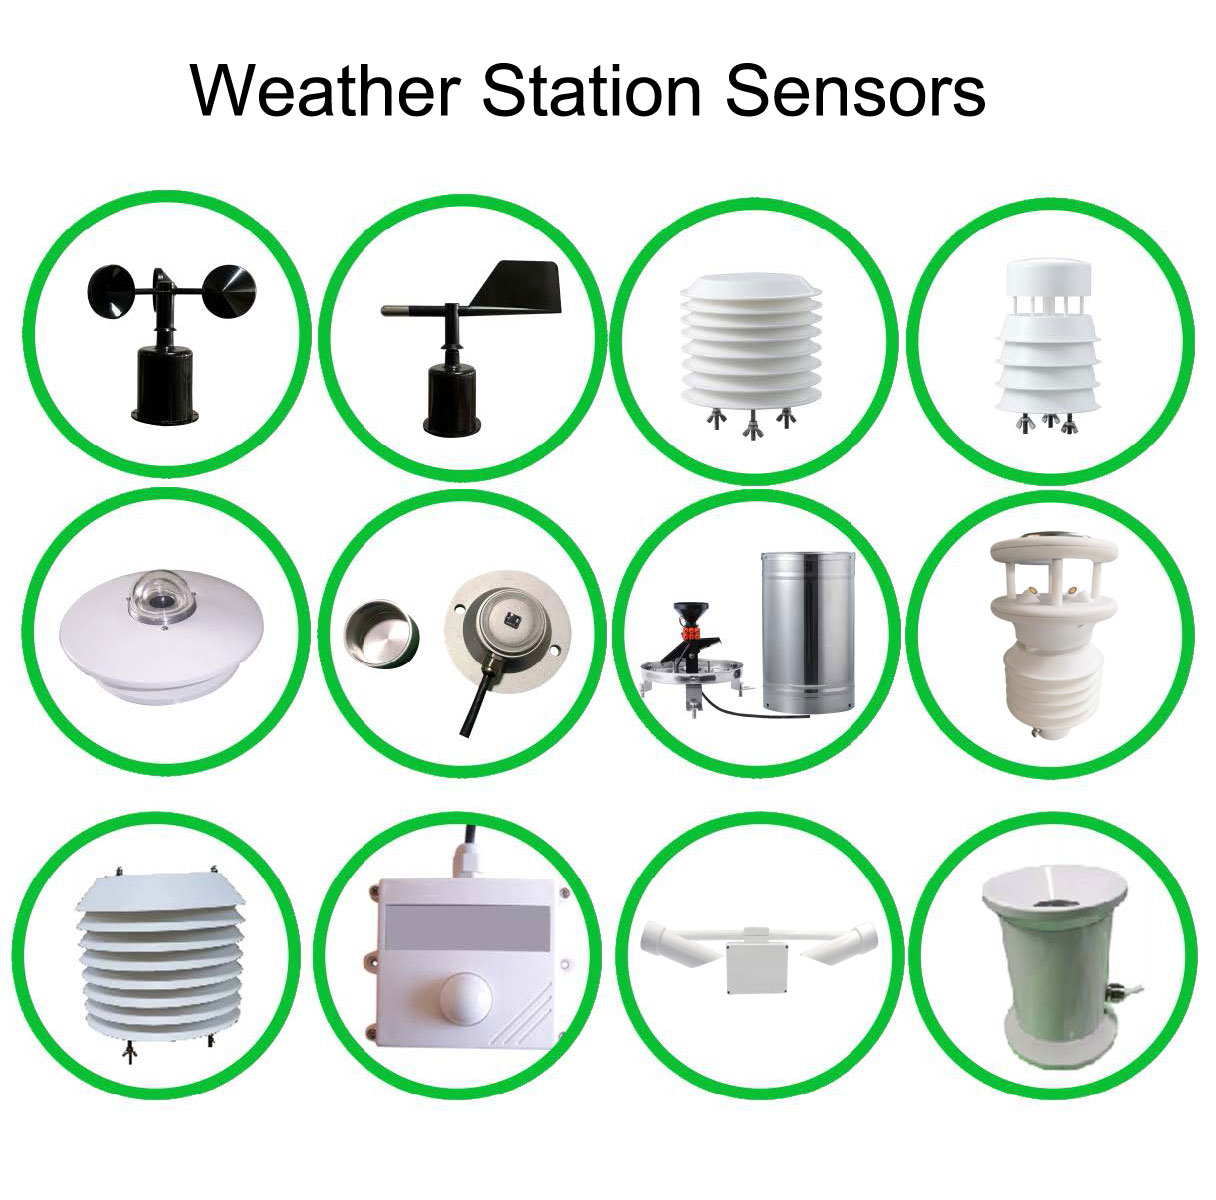
Keep the role of each sensor explicit. A pyranometer reports irradiance; a backsheet probe reports temperature at its contact point; an optical soiling instrument observes contamination on its own measurement surfaces. None of these alone diagnoses every cause of reduced solar generation.
Start placement with the operating zones: an array beside an unpaved road can experience different deposition from one beside vegetation or near an industrial source. Select points that represent the zones whose cleaning can actually be scheduled independently. Installing a sensor where it is easy to reach is useful only if that location also represents the intended arrays.
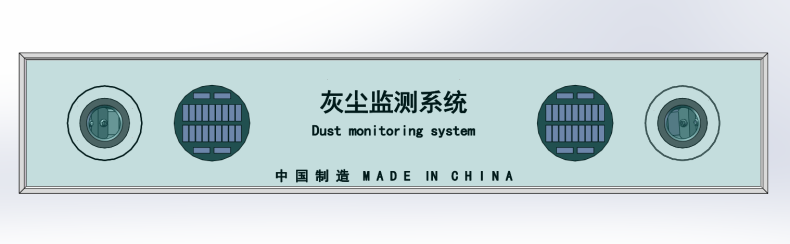
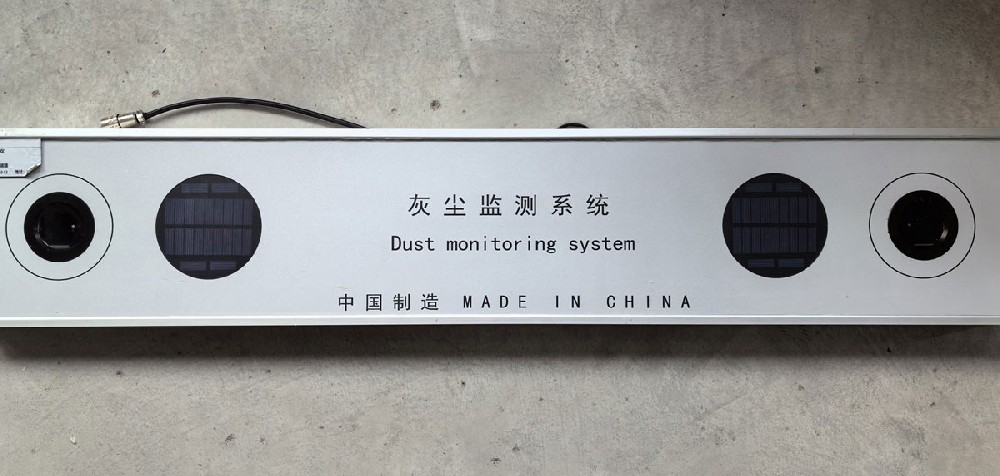
The NiuBoL NBL-W-PSS soiling sensor uses an optical blue-light measurement arrangement with two cleanliness channels. Its output concerns contamination on the sensing glass; it is not a gravimetric dust deposit in g/m2, an airborne PM2.5 reading or a direct electrical test of a PV string.
The two readings provide information from the instrument's two sensing positions. They are not automatically a continuously cleaned reference cell and a naturally soiled PV cell. Do not transfer the cleaning protocol or calculation of a different soiling-monitoring method to this optical instrument.
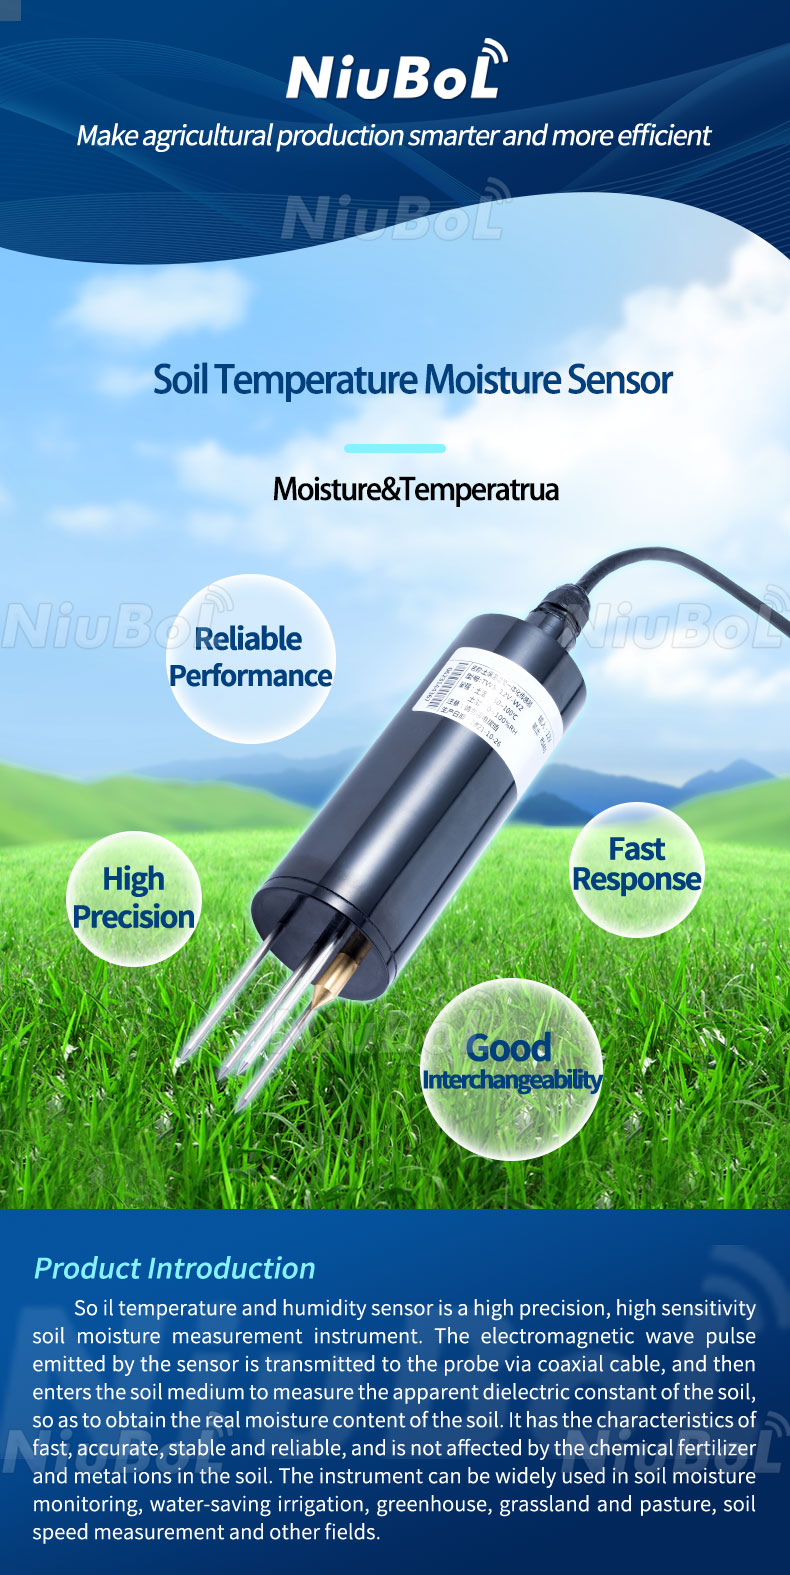
A soil temperature and moisture sensor, shown below, serves a different purpose. On an agrivoltaic site it may support crop or irrigation work, but soil moisture cannot substitute for glass-cleanliness measurement. Keep agricultural and PV performance channels separately named even if they use the same data platform.
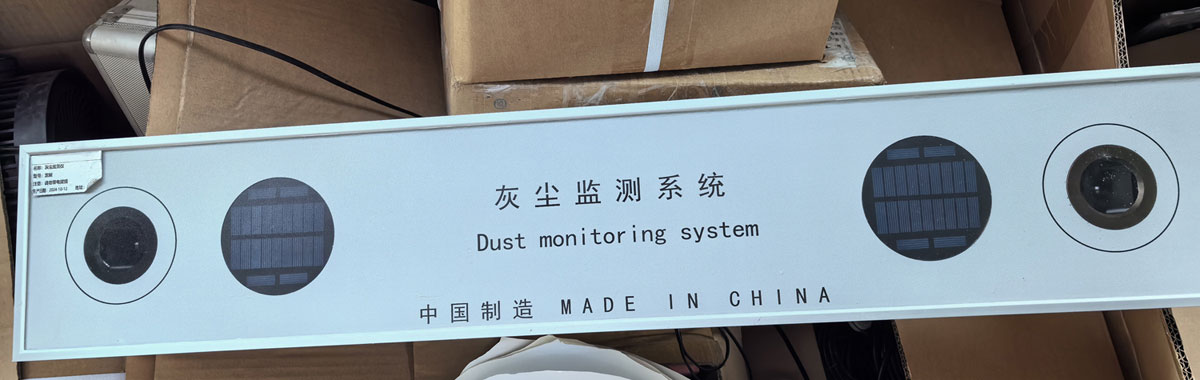
Specify the model as NBL-W-PSS rather than relying on an informal dust-monitor label. Its cleanliness readings run toward 100% for a cleaner condition. A displayed value of 96.5% must not be labelled 96.5% dirt.
| Item | NBL-W-PSS configuration |
|---|---|
| Cleanliness output range | Two channels, 50-100% |
| Stated measurement accuracy bands | +/-1% at 90-100%; +/-3% at 80-90%; +/-5% at 50-80%; confirm percentage basis for contractual acceptance |
| Supply | 12 VDC |
| Output and protocol | RS485 / Modbus RTU data reading |
| Serial settings | 9600 bit/s, 8 data bits, no parity; match stop-bit setting to the supplied version |
| Communication interval | More than 1000 ms between communications |
| Average power | 1 W for the sensor |
| Optional temperature channel | -50 to 100 degrees C measurement range; stated accuracy +/-0.5 degrees C at 25 degrees C |
| Protection, environment and cable | Specify required enclosure rating, ambient temperature, cable jacket, length and connectors with the order; the optional temperature measurement span is not an ambient operating rating |
The range-dependent accuracy bands matter when setting alarms. A small change across one sample is not necessarily a meaningful change in cleanliness. Confirm how the percentage allowance is defined before converting it into percentage points or a plant-energy uncertainty budget.
At 1 W average, the sensor alone consumes approximately 24 Wh/day. A remote monitoring station needs additional energy for the logger, communications and conversion losses. Do not size its battery from the sensor load alone or assume a solar panel already used for another station has spare winter capacity.
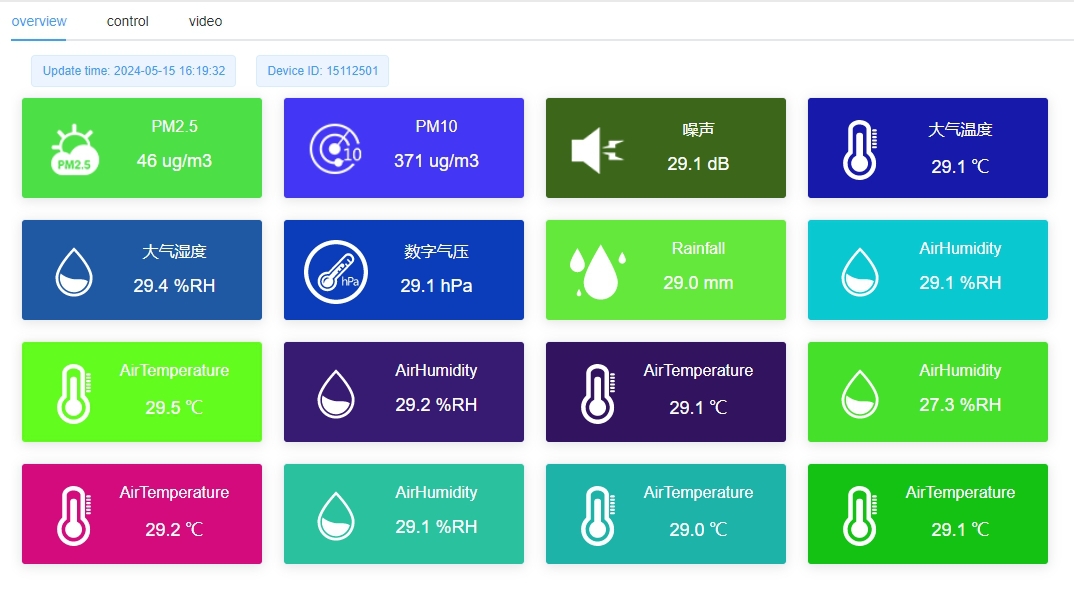
For the illustrated three-register data arrangement, a reply containing 0x03C5, 0x03C8 and 0x00EB decodes to cleanliness values of 96.5% and 96.8%, and a temperature value of 23.5 degrees C when that temperature option is fitted. Confirm the register count and available channels on the supplied instrument.
Keep the two cleanliness channels separately recorded. A sudden disagreement can justify inspection for local deposits, an obstruction or a sensor problem. Averaging them immediately can hide that diagnostic clue. A missing register must remain a missing measurement, not a zero-cleanliness alarm.
Connect one sensor first, confirm address and serial settings, and compare a received reply with the displayed engineering units. Use the supplied cable labels; the described arrangement uses red for positive supply, black or green for negative, yellow for RS485 positive and blue for RS485 negative. A host configuration error cannot be repaired by resetting the optical baseline.
Address setup uses special configuration frames, separate from ordinary register reads. Perform it with the intended device isolated from other nodes. Do not assume that every protocol-looking frame can be issued safely across a populated Modbus bus.
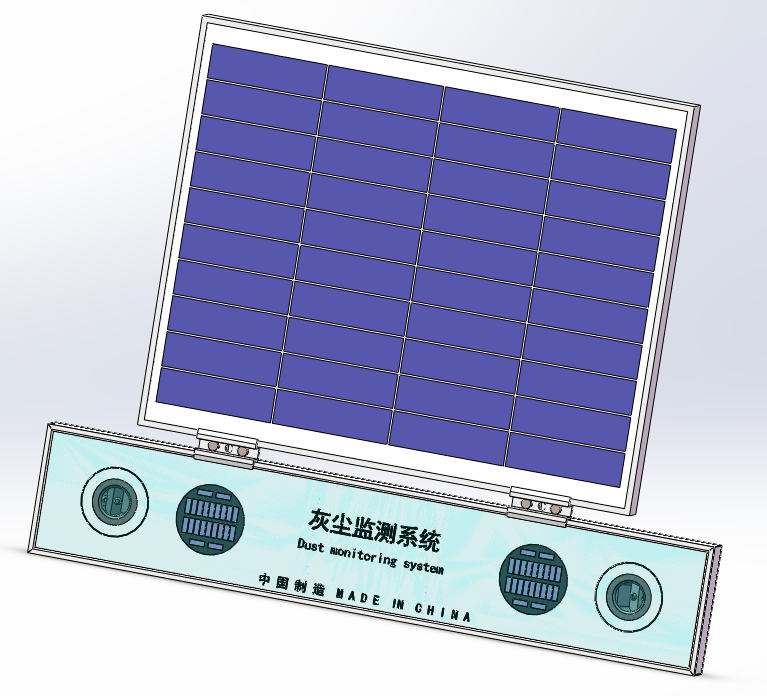
Mount the instrument with the intended array orientation and in the same plane as the represented modules, not simply level to the horizon. Avoid new shading from clamps, cables or the instrument body. For tracking arrays, confirm that the mounting and cable routing follow the intended movement without interfering with the tracker.
Agree the mounting method with the module and racking requirements before installation. Do not drill a module frame merely because a general installation drawing shows fasteners. Check permitted attachment positions, mechanical support and clearances so the monitoring addition does not introduce a module or cable problem.
The NBL-W-PSS setup procedure calls for clean sensing surfaces, sunny conditions between 12:00 and 14:00, and holding the calibration button for 10 seconds. Arrange that work with competent personnel and the plant's electrical access rules. Keep a record of the baseline setting and compare both channels afterward.
Clean both sensor probes whenever the represented modules are cleaned. If only the instrument is cleaned, its new reading no longer represents the still-dirty array. If modules are cleaned but the instrument is left dirty, the channel can imply that the work failed. Record the affected zone and cleaning time rather than silently recalibrating to remove an inconvenient discrepancy.
As an illustrative planning calculation, assume a zone would produce 2000 kWh/day in its clean, available condition and cleaning would recover 3% over ten comparable days. The gross recovered energy would be 2000 x 0.03 x 10 = 600 kWh. This is not a NiuBoL performance result or a claim that a 97% cleanliness reading automatically means 3% recoverable energy.
Multiply the estimated recovered energy by the project's actual energy value, then compare it with the all-in cleaning cost. Include access, labour, water treatment, equipment mobilisation and any lost generation. Rain in the planning period may reduce the benefit, but a rain event does not guarantee complete natural cleaning.
For repeated jobs, compare results under similar available-generation and weather conditions. A sensor step after washing is evidence of a change at the sensing surfaces; quantify array benefit from the appropriate plant data. Keep curtailment, faults and periods with unreliable irradiance separate so they do not bias the estimated return.
Verify clean-state readings, channel identity, correct scaling and communication timeout behaviour. Observe a period of natural deposition and a recorded cleaning event. Check that the sensor and represented modules receive the same cleaning treatment and that a moved or shaded instrument is not silently accepted as an array trend.
Define who reviews an alert and who authorizes a cleaning job. If automation is planned, add the required cleaning-machine interface, water availability, access restrictions and local interlocks separately. RS485 data availability does not establish a working robot-control function.
For an inquiry, provide module tilt or tracker arrangement, dust sources, cleaning zones, existing logger, available 12 V supply and the decision the data should support. These details determine placement and integration scope more usefully than a sensor count based only on total plant megawatts.
No. It is a cleanliness reading from the instrument. Converting it into recoverable plant energy requires a validated relationship and comparable irradiance, temperature and availability data.
Use separately managed soiling zones, array orientation, terrain and dust exposure to determine coverage. There is no universal megawatts-per-sensor rule that guarantees representative cleaning decisions.
Do not impose that procedure on this model. Its operating procedure cleans both probes with the represented modules. A daily clean-reference arrangement belongs to a different measurement method unless explicitly configured and validated.
A compatible local host can read the RS485 data with the correct serial settings and register decoding. Cloud visualization is a separate project choice, not necessary to obtain a serial measurement.
Inspect local deposition, shading, surface condition and recent cleaning, then verify the raw data and channel labels. Do not average the discrepancy away before checking whether one sensing position is unrepresentative.
No. It describes the temperature measurement channel. Confirm ambient operating limits, enclosure protection and cable requirements for the complete supplied assembly.
Include compatible mounts, cable length, supply conversion where required, logger integration and the proposed cleaning-zone placement. Identify any commissioning or data-analysis service separately so equipment price is not mistaken for a complete monitoring service.
PV soiling sensor readings are useful when they represent a defined array zone, are decoded correctly and remain tied to cleaning and plant-performance records. NBL-W-PSS supplies local cleanliness information; the operating decision needs the surrounding evidence. Contact NiuBoL with the array layout and acquisition requirements for a suitable monitoring configuration.
Prev:PV Environment Monitoring Station Price: Compare the Quoted Scope
Next:Environmental Sensor Accuracy: Resolution, Protection and Field Comparisons
Related recommendations
Sensors & Weather Stations Catalog
 Agriculture Sensors and Weather Stations Catalog-NiuBoL.pdf
Weather Stations Catalog-NiuBoL.pdf
Agriculture Sensors Catalog-NiuBoL.pdf
Water Quality Sensor Catalog-NiuBoL.pdf
Related products
 Combined air temperature and relative humidity sensor
 TDR Soil Moisture & Temperature Sensor for irrigation| RS485 |4-20mA| NBL-S-THR
 Soil pH sensor RS485 soil Testing instrument soil ph meter for agriculture |NBL-S-PH
 Wind Speed sensor Output Modbus/RS485/Analog/0-5V/4-20mA
 Tipping bucket rain gauge for weather monitoring auto rainfall sensor RS485/Outdoor/stainless steel
 Pyranometer Solar Radiation Sensor 4-20mA/RS485


Screenshot, WhatsApp to identify the QR code
WhatsApp number:+8615367865107
(Click on WhatsApp to copy and add friends)

