


— Blogs —
—Products—
 Consumer hotline +8618073152920
 WhatsApp:+8615367865107
Address:Room 102, District D, Houhu Industrial Park, Yuelu District, Changsha City, Hunan Province, China
Product knowledge
Time:2026-02-04 16:00:19 Popularity:601
In the context of continuously improving the refinement of photovoltaic power station asset operations, environmental meteorological data has upgraded from auxiliary reference information to the core basis for power station performance evaluation and transaction decision-making. For photovoltaic system integrators, smart energy solution providers, and power station EPC contractors, the technical configuration and system integration capabilities of multi-element solar power generation weather stations directly determine the data quality and decision effectiveness of upper-level applications such as power forecasting, performance analysis, and intelligent O&M.
Based on its technical accumulation in the field of photovoltaic environmental monitoring, NiuBoL has built a full-stack meteorological monitoring architecture covering the sensor layer, edge computing layer, and platform application layer for diversified scenarios such as centralized ground power stations, distributed industrial and commercial projects, and integrated photovoltaic-storage systems. This article will systematically explain the technical selection logic, communication architecture design points, and typical project integration practices of multi-element meteorological monitoring systems from the engineering implementation perspective of system integrators.

When photovoltaic power stations participate in the power spot market or sign PPA power purchase agreements, the forecasting accuracy of power generation directly affects electricity price revenue and deviation assessment costs. Traditional numerical weather prediction (NWP) based on satellite cloud images has limited spatial resolution and is difficult to capture local micro-meteorological changes at the power station.
Technical Implementation Architecture:
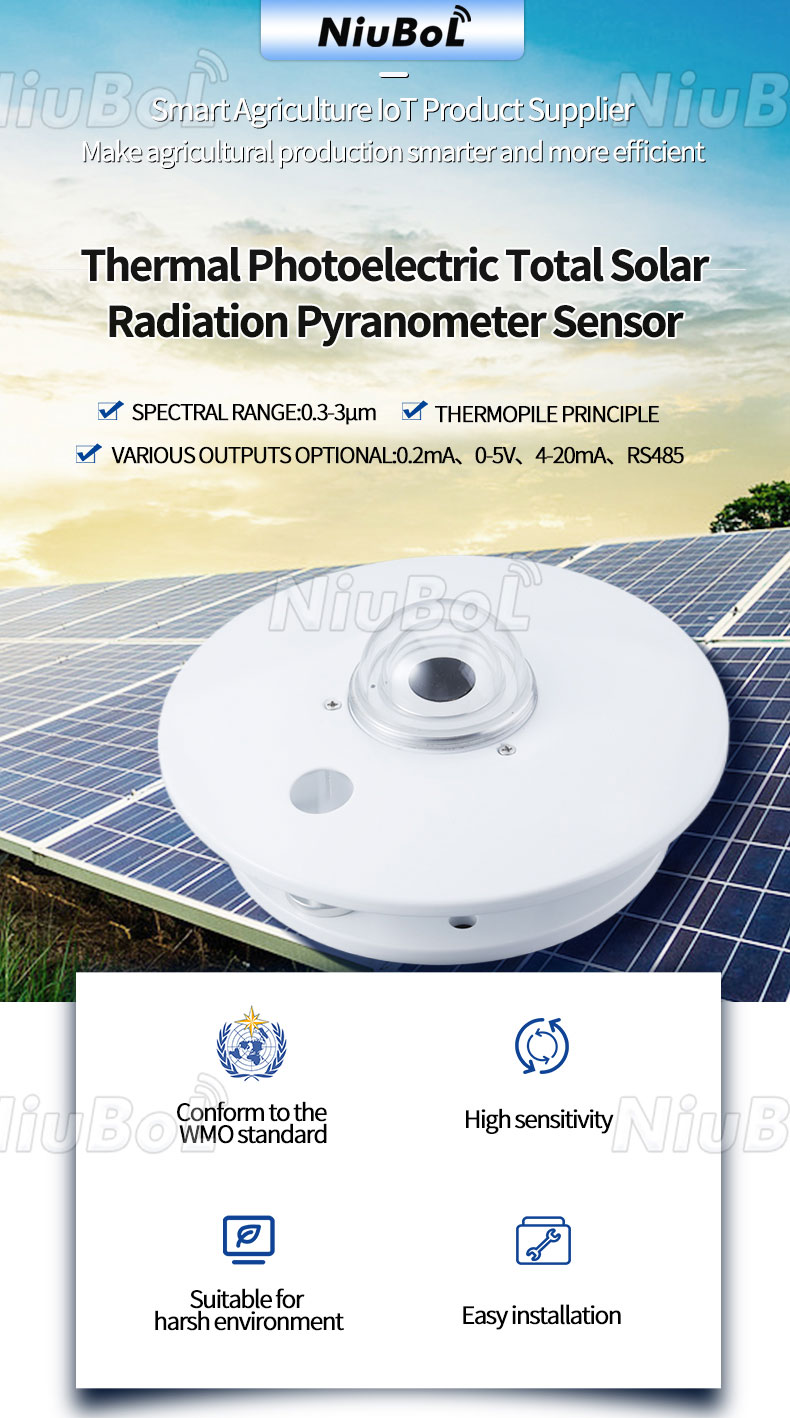
- High-precision radiation monitoring: Deploy first-class total radiation meter (ISO 9060 standard, annual stability<0.5%), synchronously monitor global horizontal irradiance (GHI), diffuse horizontal irradiance (DHI), and direct normal irradiance (DNI), building a complete solar radiation resource assessment dataset
- Module temperature correction: Use PT100 platinum resistance attached to typical positions on the module backsheet to collect battery operating temperature in real time, combined with module temperature coefficient (usually -0.3%/℃ to -0.4%/℃) to calculate power loss caused by temperature

Performance Ratio (PR) is the core indicator for measuring the conformity of actual operating efficiency of photovoltaic power stations to design expectations, and its calculation relies on accurate measurement of meteorological and environmental parameters.
System Integration Points:
- Data synchronous acquisition: The weather station and inverter SCADA system achieve second-level time synchronization through GPS timing, ensuring strict alignment of irradiance data and power generation data timestamps
- PR real-time calculation: Edge gateway built-in PR algorithm, formula PR = (actual power generation/peak power) / (actual irradiance/standard irradiance intensity 1000W/m²), output minute-level PR curve
- Loss decomposition analysis: Combined with module temperature, dust shading index, inverter efficiency, and other parameters, decompose PR losses into temperature losses, shading losses, equipment efficiency losses, etc., to locate efficiency bottlenecks
- Asset rating report: Automatically generate monthly/annual PR reports compliant with IEC 61724-1 standard, providing data support for asset evaluation, financing due diligence, and insurance loss assessment

The correlation analysis of multi-element meteorological data and equipment operating status can achieve a shift from passive fault repair to active preventive maintenance mode.
Typical Application Scenarios:
- Dust loss assessment: By comparing actual irradiance with theoretical power generation under clean conditions, combined with rainfall data, calculate revenue losses caused by dust shading, optimize module cleaning scheduling
- Hot spot risk warning: When abnormal module temperature distribution is detected (local hotspot temperature exceeds average by more than 20℃) and irradiance >800W/m², trigger infrared inspection work order
- Strong wind disaster prevention: Ultrasonic anemometer monitors gust peaks in real time, when 10-minute average wind speed exceeds design threshold (e.g., 25m/s), automatically push reinforcement warning to O&M management platform
- Snow accumulation monitoring and removal: Irradiance and module temperature data combined with image recognition to judge snow coverage status, link snow removal robots or manual snow removal operations

For new power stations, long-term operational meteorological monitoring data is the key basis for verifying the resource assessment model and equipment selection rationality during the site selection phase.
Technical Value Embodiment:
- Compare actual GHI with long-term deviations from meteorological databases such as Meteonorm/SolarGIS, correct resource assessment algorithms for subsequent projects
- Analyze actual power generation differences of arrays with different tilt angles and azimuths, provide empirical data for optimization design of subsequent projects in the same area
- Provide localized empirical data support for new technology applications such as bifacial module gain and tracking bracket performance optimization
| Sensor Type | Measurement Principle | ISO 9060 Level | Spectral Range | Applicable Scenarios |
|---|---|---|---|---|
| Thermopile Pyranometer | Thermoelectric Effect | First/Second Class | 285-2800nm | Power Forecasting, PR Calculation |
| Silicon-Based Irradiance Meter | Photovoltaic Effect | Non-Standard | 400-1100nm | Module Performance Comparison |
| Rotating Shadowband Diffuse Meter | Mechanical Shadowing | First Class | 285-2800nm | Scientific Radiation Research |
| Direct Normal Irradiance Meter (Solar Tracker) | Automatic Tracking | First Class | 285-2800nm | Concentrated Photovoltaic (CPV) |
Engineering Suggestion: For centralized power station power forecasting and PR evaluation scenarios, ISO 9060 first-class standard thermopile pyranometers must be selected, as their full-spectrum response characteristics have high matching with photovoltaic module spectral response. Silicon-based irradiance meters are only suitable for module-level performance comparison and cannot be used as the sole basis for power forecasting.
- Sensor Type: PT100 Class A platinum resistance (accuracy ±0.15℃) or PT1000
- Installation Method: Thermal conductive silicone attached to the center position of the module backsheet, avoiding frame thermal bridge effects
- Quantity Configuration: At least 2 representative measurement points per MW installed capacity, encrypted by array partitions for large power stations
- Data Acquisition: Synchronous sampling with irradiance data (recommended 1-minute interval), ensuring time consistency of PR calculation

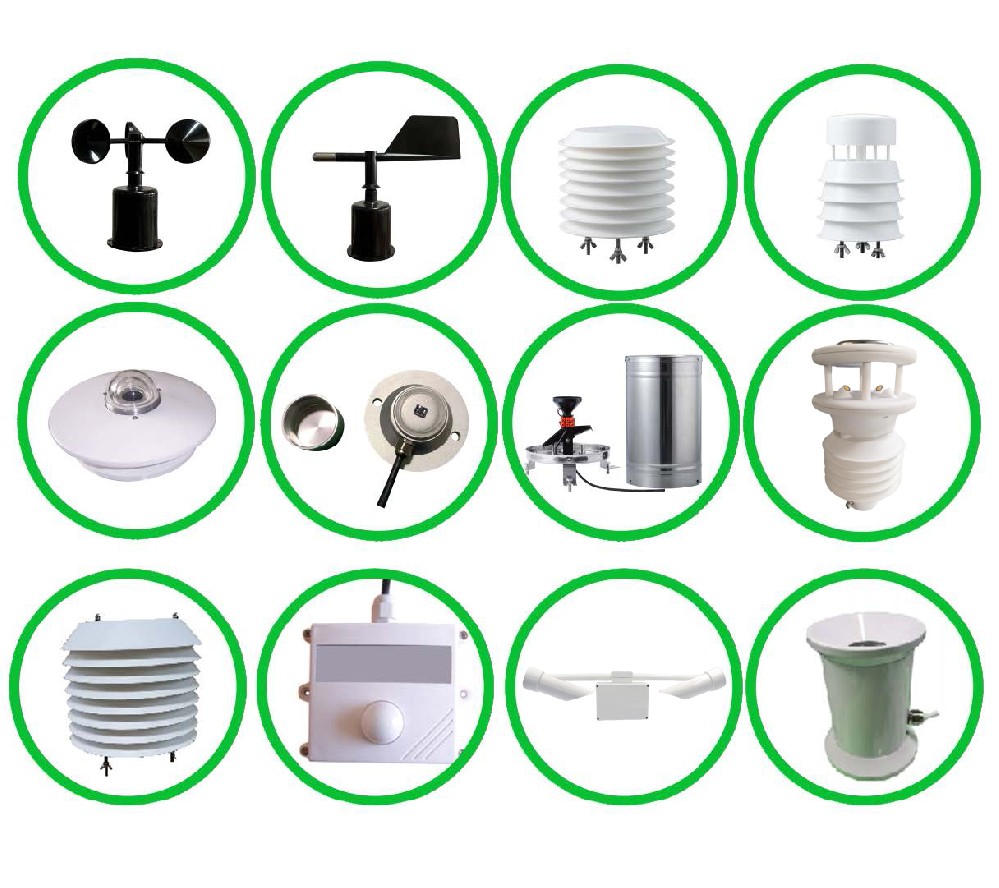
- Wind Speed and Direction: Ultrasonic type, range 0-60m/s, accuracy ±0.1m/s, for heat dissipation assessment and structural safety monitoring
- Ambient Temperature: PT100 probe with radiation shield, accuracy ±0.2℃, for calculating module and ambient temperature difference
- Relative Humidity: Capacitive type, accuracy ±2%RH, for predicting micro-meteorological events such as condensation and icing
- Atmospheric Pressure: Piezoresistive sensor, accuracy ±0.5hPa, for altitude correction of radiation data
Device Layer Communication (Sensor to Data Logger)
- RS-485/Modbus RTU: Standard interfaces for radiation meters, temperature and humidity sensors, etc., supporting multi-point bus topology
- Pulse Signal: For tipping bucket rain gauges, etc., requiring counter module access
- Analog 4-20mA: Backup channel, ensuring continuity of key parameters
Edge Layer Communication (Data Logger to SCADA/Cloud Platform)
- Modbus TCP/IP: Access to power station local SCADA system, supporting dual-network redundancy configuration
- IEC 61850: Compliant with power industry standards, seamless integration with substation automation systems
- MQTT over 4G/Fiber: Push to group-level cloud platforms or third-party power forecasting service providers
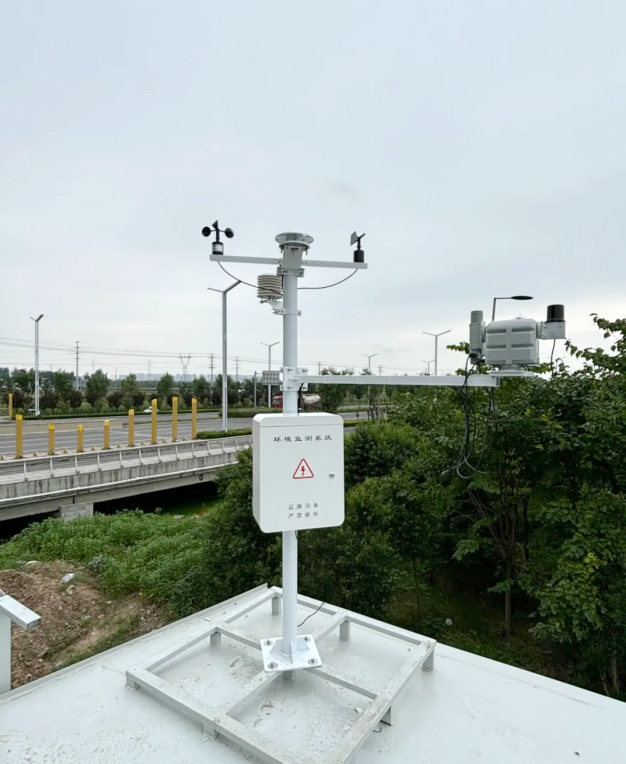
- Installation Height: 1.5 meters (to avoid ground reflection effects), level error<0.5°
- Orientation Reference: Geographic true south (Northern Hemisphere), calibrated by compass or GPS
- Shading Avoidance: Ensure no shading throughout the year, surrounding obstacle height angle<5°
- Lightning Protection: Equipped with dedicated lightning rod, grounding resistance<10Ω
- On-Site Calibration: Compare calibration with standard radiation meter every 6 months, correct coefficients when deviation >2%
- Laboratory Calibration: Return to factory for WRR (World Radiometric Reference) traceability calibration every 2 years, issue ISO 17025 certification certificate
- Cleaning Maintenance: Daily automatic detection of radiation meter dome pollution status, weekly manual cleaning of glass dome with distilled water and lint-free soft cloth
Phenomenon Description: Inconsistent timestamps between weather station data and inverter SCADA data, leading to systematic deviations in PR calculation.
Solutions:
- Enable NTP/SNTP network time synchronization for the entire system, with GPS/Beidou as primary clock source
- Configure the same NTP server for data logger and SCADA front-end, synchronization accuracy<10ms
- Stamp key data with UTC timestamps, convert display according to project local time zone on the platform side
Phenomenon Description: Missing or abnormal power generation data during high irradiance periods, affecting PR calculation accuracy.
Solutions:
- Configure data quality flags (Quality Flag), mark abnormal periods such as communication interruptions and equipment maintenance
- Automatically exclude abnormal data points during PR calculation or use interpolation algorithms to fill in
- Establish data consistency check rules: Trigger alarm when correlation coefficient between power generation and irradiance<0.7
Phenomenon Description: Accelerated sensor drift in high-altitude, high-humidity, strong UV areas.
Solutions:
- Radiation meter selects quartz glass dome, anti-UV aging, optional ventilation heating function to prevent condensation
- Electronic enclosure configured with constant temperature heating/cooling modules, ensuring wide temperature operation from -30℃ to +60℃
- Key connectors select military-grade waterproof connectors, protection level IP67

Q1: How does weather station data achieve deep fusion with inverter SCADA system?
Access power station SCADA LAN through Modbus TCP/IP or IEC 61850 protocol, map data to real-time database. NiuBoL provides standard point table configuration files (such as for mainstream platforms like Wonderware, Ignition), supporting automatic registration and historical archiving of key variables such as irradiance and module temperature.
Q2: How big is the difference between first-class total radiation meters and second-class products in practical applications?
According to IEC 61724-1 standard, PR calculation requires radiation measurement uncertainty<5%. First-class meter annual stability ±0.5%, temperature response ±1%, comprehensive uncertainty about 2-3%; second-class meter annual stability ±1%, temperature response ±2%, comprehensive uncertainty may exceed 5%, affecting PR evaluation confidence. Power forecasting scenarios recommend must use first-class meters.
Q3: Is there an industry standard for module temperature sensor installation positions?
According to IEC 61724-1, should be installed on the module backsheet at the geometric center of the array, avoiding more than 10cm from the edge (to avoid thermal boundary effects). For bifacial modules, need to monitor front and back temperatures separately or use weighted average algorithm to estimate cell junction temperature.
Q4: How to set the maintenance cycle for radiation meters in dusty environments?
In high dust areas, recommend daily automatic detection of dome pollution index (by comparing data difference between clean reference sensor and main sensor), trigger cleaning alarm when attenuation exceeds 5%. In conventional areas, manual cleaning once a week using distilled water and lint-free soft cloth.

The multi-element solar power generation weather station is the basic infrastructure for photovoltaic power stations to achieve digital and intelligent O&M, and its data quality directly affects power forecasting accuracy, performance evaluation credibility, and transaction decision effectiveness. For system integrators, choosing equipment suppliers with high-precision sensors, open communication interfaces, and engineered service capabilities is the key decision to ensure project technical advancement and long-term stable operation.
NiuBoL is committed to becoming a technology enabler in the photovoltaic smart energy industry chain, reducing the technical threshold for integrators in power station intelligent transformation and new project delivery through meteorological monitoring hardware compliant with international standards, flexible protocol adaptation capabilities, and professional engineering support services. In the context of refined operations of new energy assets, precise meteorological environmental monitoring is evolving from auxiliary tools to core infrastructure for power station value management. We look forward to jointly promoting technological progress and standard improvement in the photovoltaic industry with industry chain partners.
 NBL-W-SRS-Solar-radiation-sensor-instruction-manual-V4.0.pdf
NBL-W-HPRS-Solar-Radiation-Sensor-Instruction-Manual-V3.0.pdf
NBL-W-PSS Soiling Sensor Photovoltaic Dust Monitoring Instrument Data Sheet.pdf
Related recommendations
Sensors & Weather Stations Catalog
Agriculture Sensors and Weather Stations Catalog-NiuBoL.pdf
Weather Stations Catalog-NiuBoL.pdf
Agriculture Sensors Catalog-NiuBoL.pdf
Water Quality Sensor Catalog-NiuBoL.pdf
Related products
 Combined air temperature and relative humidity sensor
 Soil Moisture Temperature sensor for irrigation|NBL-S-THR
 Soil pH sensor RS485 soil Testing instrument soil ph meter for agriculture |NBL-S-PH
 Wind Speed sensor Output Modbus/RS485/Analog/0-5V/4-20mA
 Tipping bucket rain gauge for weather monitoring auto rainfall sensor RS485/Outdoor/stainless steel
 Pyranometer Solar Radiation Sensor 4-20mA/RS485

Screenshot, WhatsApp to identify the QR code
WhatsApp number:+8615367865107
(Click on WhatsApp to copy and add friends)
