





— Blogs —
—Products—
 Consumer hotline +8618073152920
WhatsApp:+8615367865107
Address:Room 102, District D, Houhu Industrial Park, Yuelu District, Changsha City, Hunan Province, China
Product knowledge
Time:2024-11-24 16:40:17 Popularity:1568
Scenic area meteorological monitoring can describe the differences between a woodland path, an open clearing and an exposed viewpoint. For ecological records, the useful result is a comparable time series from each defined environment, not a single park-wide number. Use consistent instruments, observation times and maintenance records. NiuBoL modular stations can supply the weather channels and acquisition equipment; the research question determines the locations and how the observations are interpreted.
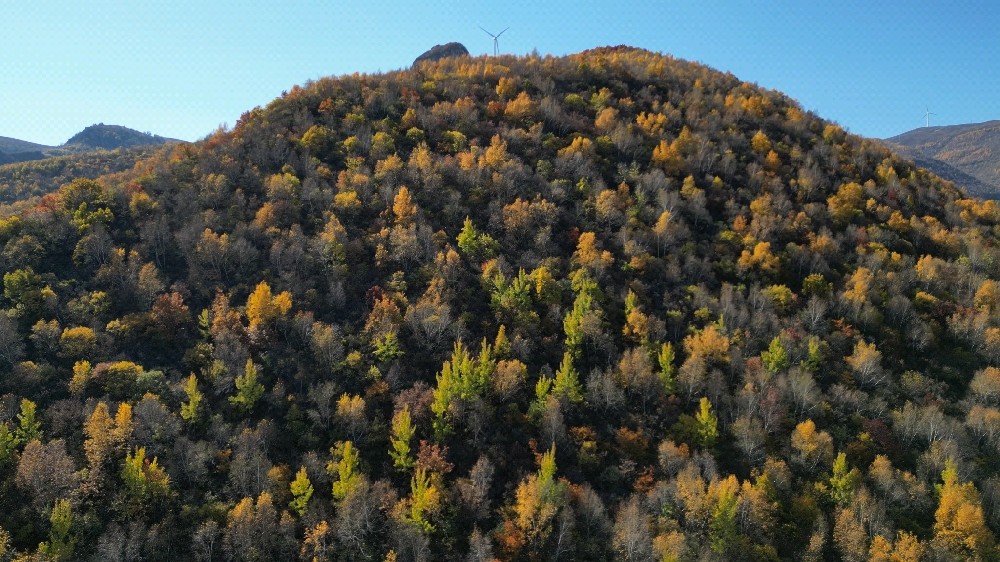
A shaded woodland point may remain cooler during part of the day than an open visitor plaza. That does not establish a permanent temperature difference or prove that vegetation alone caused it. Surface material, slope, elevation, ventilation and the time of observation can all differ. A useful park microclimate comparison starts by defining the environments being compared and the periods that matter.
For a restoration project, the question might be whether a replanted area develops a different near-surface environment as the canopy changes. For a reserve, it might be how woodland and grassland respond during dry spells. These questions require repeat observations, not a display photograph or one afternoon's readings. Keep operational visitor information separate from conclusions about long-term ecological change.
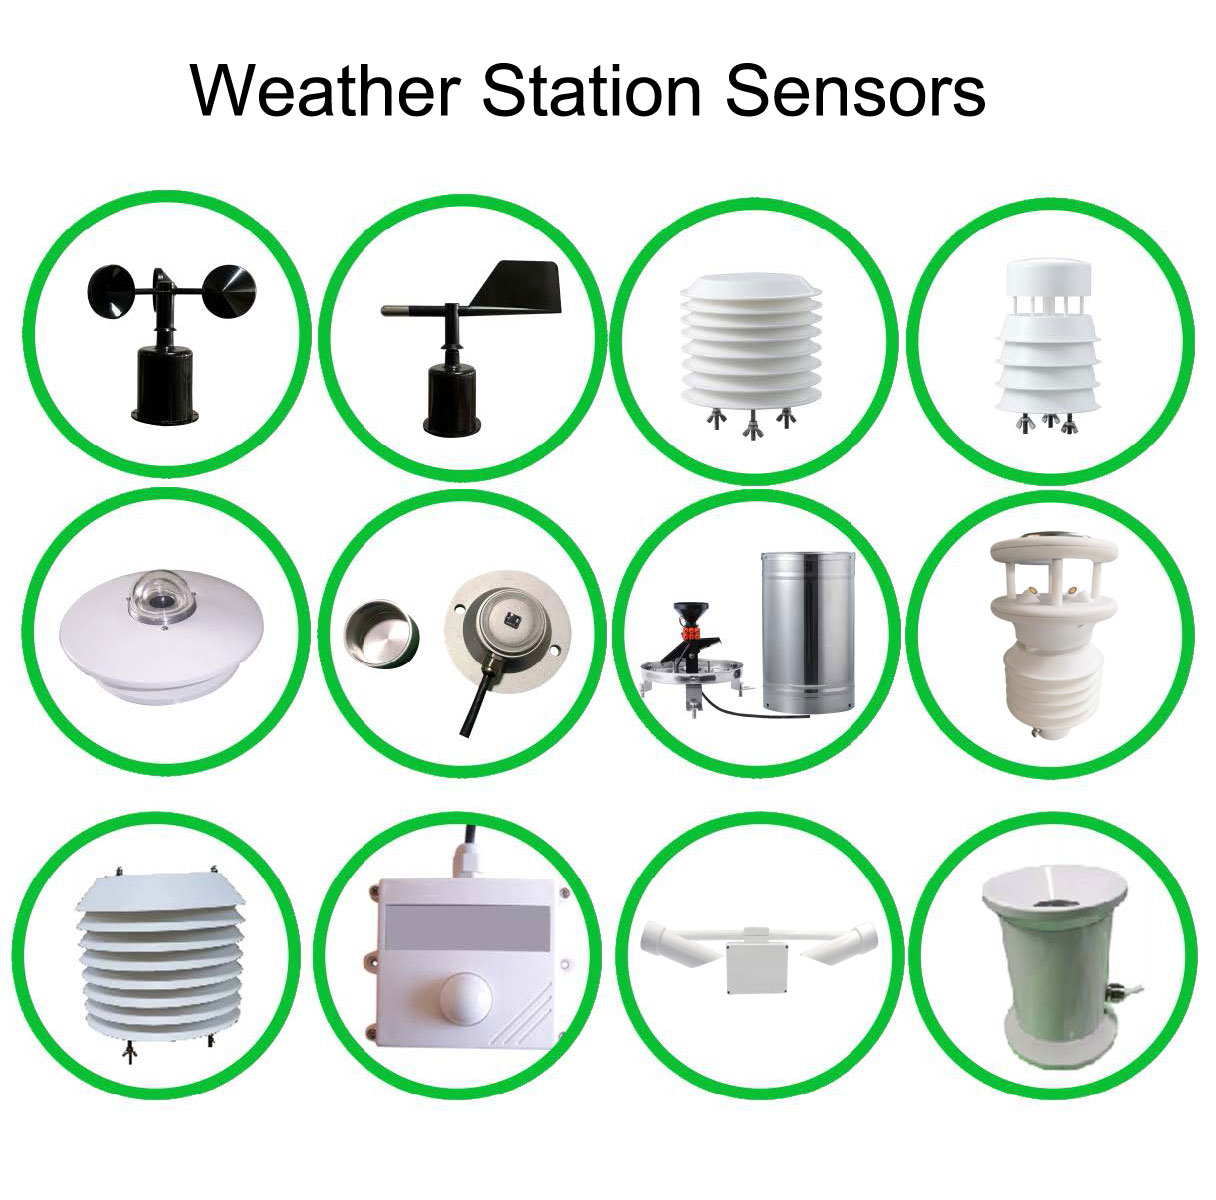
Air temperature and relative humidity describe the air at the sensor. Wind describes local airflow. Rainfall measures liquid precipitation collected at a point. Solar irradiance describes incoming radiation on the instrument's measurement plane. None of these independently measures biodiversity, plant water stress, soil water availability or human thermal comfort. Add an appropriate measurement only when the project needs that additional quantity.
| Instrument | Selected specification | Meaning for a paired-site study |
|---|---|---|
| NBL-W-LBTH | Temperature -40 to 80 C, accuracy +/-0.5 C; humidity 0-100% RH, accuracy +/-5% RH; pressure 10-1200 hPa, accuracy +/-1.5 hPa; DC 12-24 V options | Use matching exposure and shields where comparison requires them. Display resolution is not uncertainty. |
| NBL-W-SS | Wind speed 0-45 or 0-70 m/s; accuracy +/-(0.3 + 0.03V) m/s, with V in m/s; IP65 | Select the same range and output for comparable locations; tree shelter is part of a woodland observation. |
| NBL-W-DS | Wind direction 0-360 degrees; accuracy +/-3 degrees; IP65 | Record the directional reference and surrounding obstructions. Direction becomes less informative during very light wind. |
| NBL-W-RS | 0.2 mm per tip; intensity range 0-4 mm/min; stated accuracy +/-4% in an indoor static test at 2 mm/min; operation 0-50 C | Separate an open rainfall reference from any intended canopy-throughfall measurement. The test accuracy is not a promise for every field exposure. |
The NBL-W-LBTH temperature, humidity and pressure sensor is one possible air-measurement component. Its RS485 and 4-20 mA output options are different ordering configurations. Pressure can provide atmospheric context, but a difference between points at different elevations is not automatically an ecological effect.
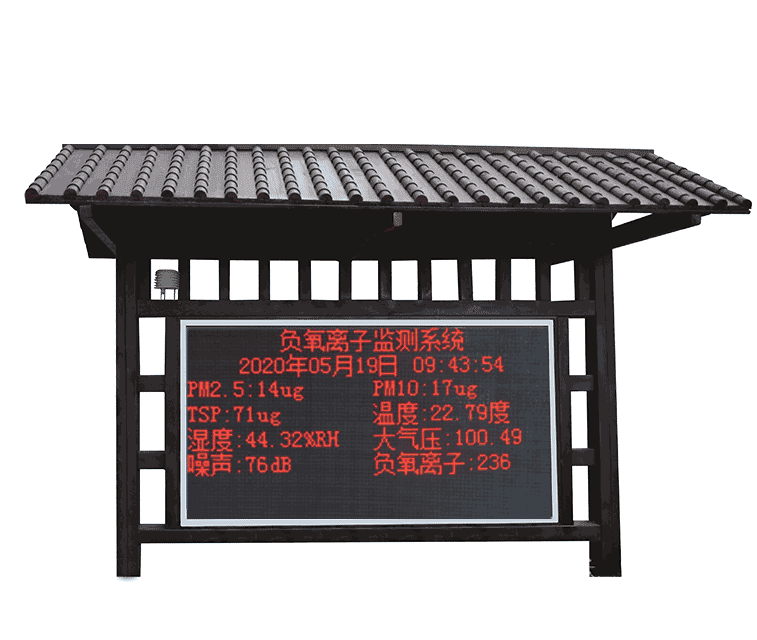
A public screen can show a recent woodland temperature or an open-site rain total. A study needs more: the physical point identity, measurement height, acquisition time, units and any service interval. Decide which record is the authoritative observation before connecting multiple screens or applications. A copied display value is not a second independent measurement.
Keep missing observations and estimates distinguishable. If a shaded station loses power, a value copied from the entrance plaza must not silently replace its observation. It may be useful as a clearly labelled estimate for a separate operational purpose, but it cannot be treated as measured woodland data in the comparison.
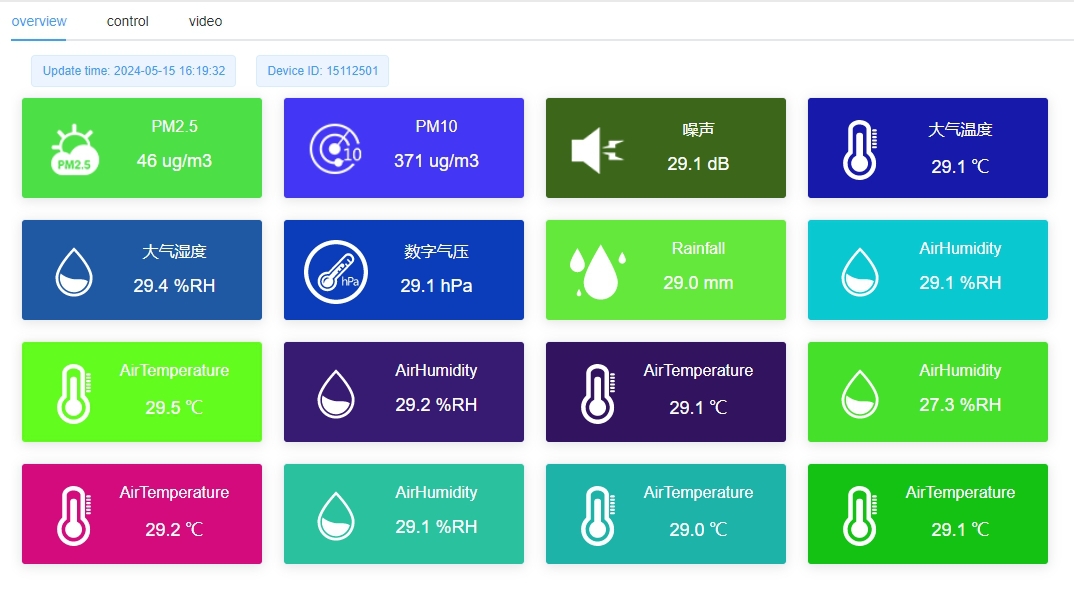
Where practical, run the intended instruments together under comparable exposure before deployment. Use the same time basis and review whether any persistent difference needs investigation. This is a comparison check, not automatically a traceable calibration. Keep the results so an apparent woodland/open-site difference can later be examined against instrument behavior as well as environmental conditions.
After deployment, compare concurrent intervals rather than unrelated daily extremes. State whether a temperature value is an instantaneous sample or an average. A minimum from one sampling schedule may not be comparable with a minimum from another. Rain totals need matching start and end times, and wind summaries need the same averaging definition.
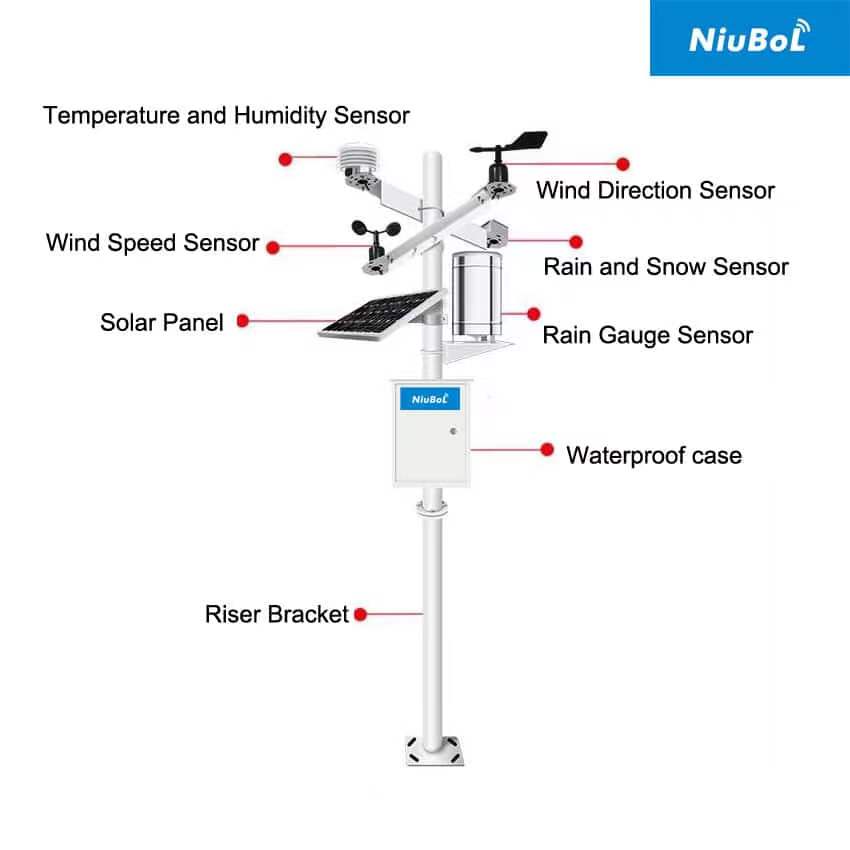
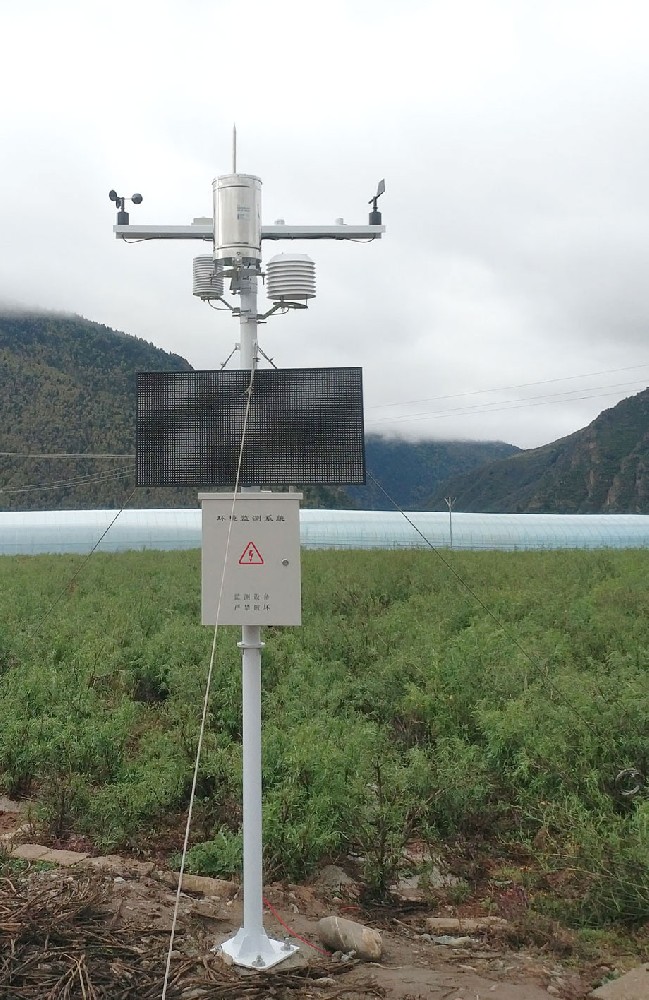
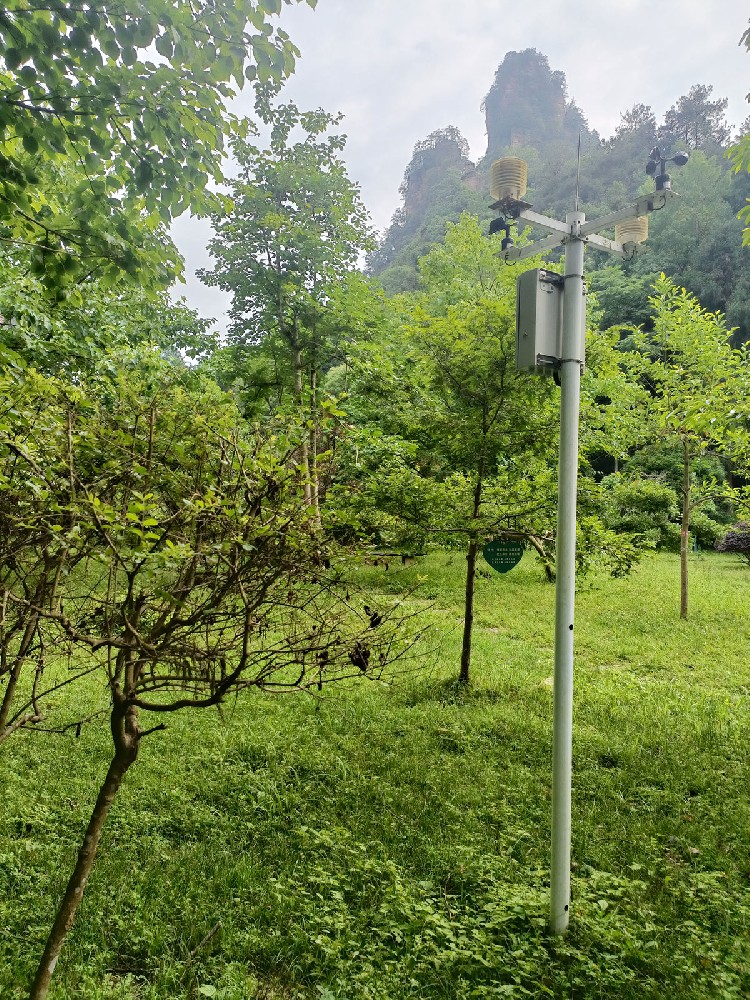
Record canopy condition, nearby surfaces, sensor height and the position of the solar panel, enclosure and access path. A panel mounted above a light sensor can create a recurring shadow. A temperature shield near the cabinet may sample a different environment from one farther away. Photographs help explain the exposure but do not by themselves establish measurement quality.
For canopy research, changes in leaf cover may be the phenomenon of interest. Do not trim the study vegetation solely to make the readings resemble an open reference. Instead, keep the observation purpose clear and document any pruning, construction, mowing or instrument move. If a point must be relocated, preserve the old and new identities and record the change date.
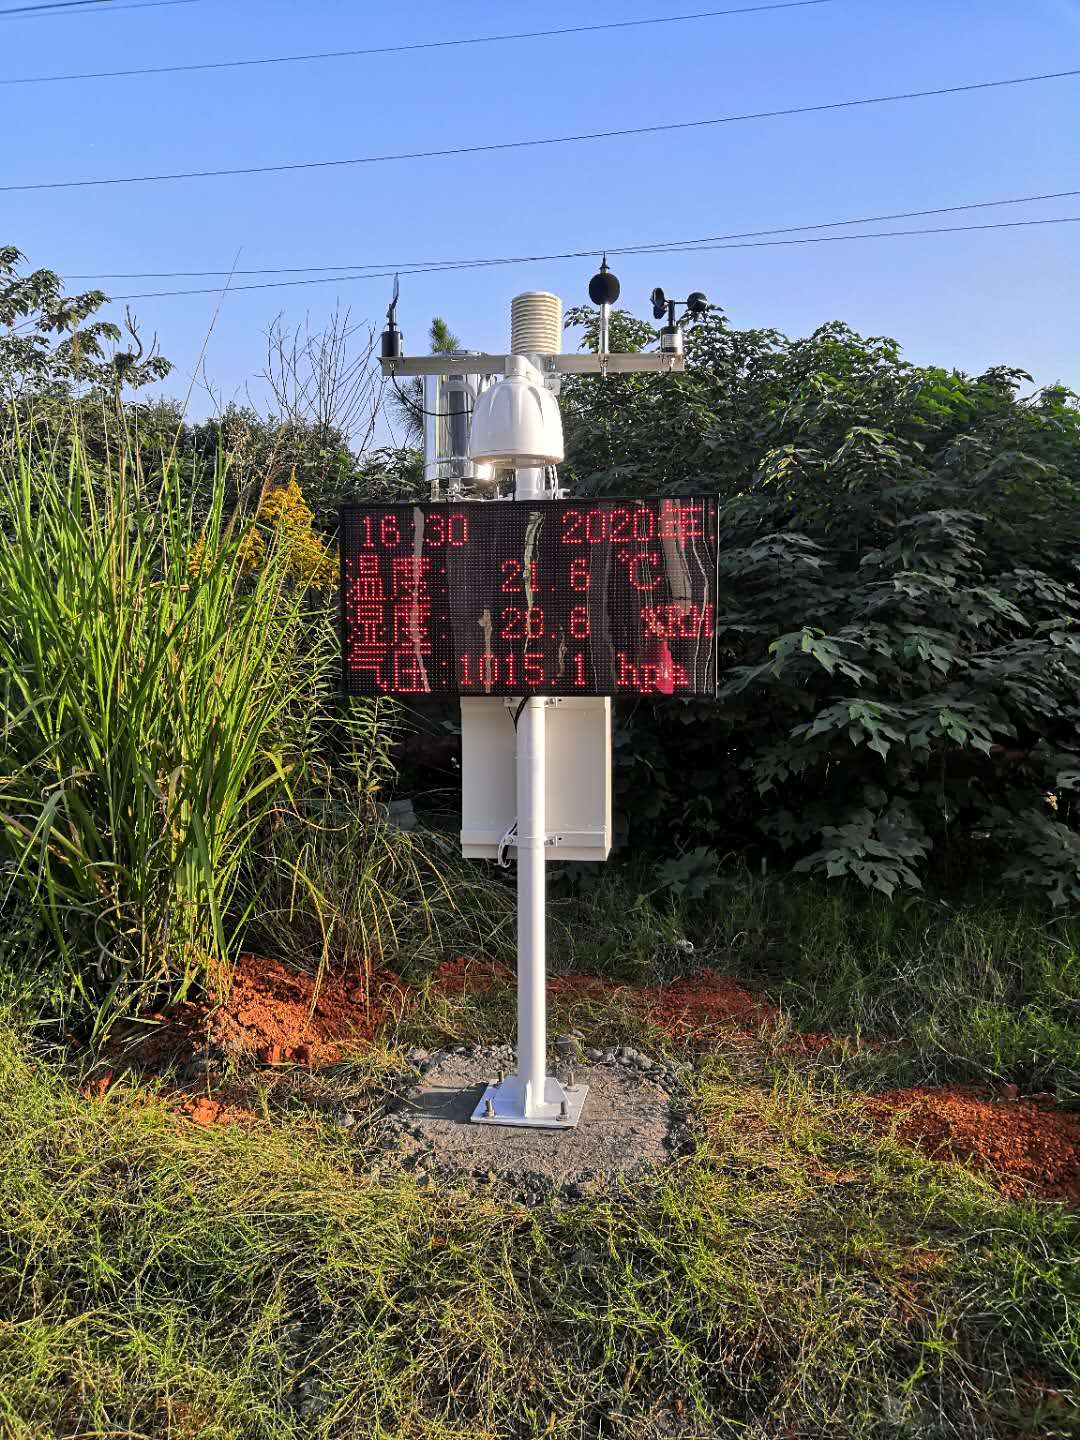
A data logger acquires each instrument's selected signal. A gateway then transfers records to the receiving application. In an RS485 Modbus RTU configuration, match the address, serial settings, register meaning and scaling for each device. RS485 alone does not establish protocol compatibility, remote access or a shared clock across separate stations.
The TG462/TG462S logger and gateway family provides multiple field interfaces and configurable networking. Ask for the actual acquisition schedule, storage behavior and recovery procedure for the ordered system. Canopy shading and terrain can constrain both solar charging and communication; evaluate each point rather than assuming the entrance installation represents the entire reserve.
A negative-air-ion channel, particulate instrument or CO2 transmitter can be added for a defined environmental purpose. Their numbers are not interchangeable. An ion count is not oxygen percentage, proof of health benefit or a complete air-quality assessment. CO2 concentration alone does not quantify ecosystem carbon exchange without the additional measurements and analysis required for that task.
For ion-specific projects, review the negative-air-ion measurement and sampling considerations separately. For an ecological enquiry, send NiuBoL the comparison question, point map, canopy conditions, required channels and observation period. This helps avoid buying extra display functions while omitting the records needed for the study.
Not as simultaneous independent observations. One point measures its own exposure. For a concurrent comparison, use separate suitable points or a study design that explicitly addresses the limitations of moving an instrument between locations.
It demonstrates a measured difference under the observed conditions only after instrument and timing issues are checked. Elevation, surface, wind and weather can also contribute. A causal claim needs an appropriate study design rather than a single paired reading.
No. Canopy interception and dripping alter what reaches that collector. If throughfall is the objective, identify it explicitly and design representative sampling. Use a separately exposed reference for the open precipitation comparison.
No. Co-location can reveal relative differences under those conditions. Calibration requires an appropriate reference, method and documented result. Specify the required calibration documents separately from the field comparison.
The agreed local record, acquisition times and channel identities should be recoverable where that function is included. Test the chosen logger and application. A live screen returning to normal does not prove that every missing observation was recovered.
Scenic area meteorological monitoring supports ecological work when each point has a defined environment and comparable records. Match instruments and timing, preserve exposure changes and avoid turning a local reading into a park-wide health or safety claim. NiuBoL can configure weather sensors and data acquisition around the observation design rather than a uniform sensor package.
Prev:Automatic Weather Station Site Selection: Compare Locations Before Construction
Next:Weather Monitoring Instruments: Rain, Snow and Visibility Configuration
Related recommendations
Sensors & Weather Stations Catalog
 Agriculture Sensors and Weather Stations Catalog-NiuBoL.pdf
Weather Stations Catalog-NiuBoL.pdf
Agriculture Sensors Catalog-NiuBoL.pdf
Water Quality Sensor Catalog-NiuBoL.pdf
Related products
 Combined air temperature and relative humidity sensor
 TDR Soil Moisture & Temperature Sensor for irrigation| RS485 |4-20mA| NBL-S-THR
 Soil pH sensor RS485 soil Testing instrument soil ph meter for agriculture |NBL-S-PH
 Wind Speed sensor Output Modbus/RS485/Analog/0-5V/4-20mA
 Tipping bucket rain gauge for weather monitoring auto rainfall sensor RS485/Outdoor/stainless steel
 Pyranometer Solar Radiation Sensor 4-20mA/RS485


Screenshot, WhatsApp to identify the QR code
WhatsApp number:+8615367865107
(Click on WhatsApp to copy and add friends)

