





— Blogs —
—Products—
 Consumer hotline +8618073152920
WhatsApp:+8615367865107
Address:Room 102, District D, Houhu Industrial Park, Yuelu District, Changsha City, Hunan Province, China
Product knowledge
Time:2025-09-20 15:50:44 Popularity:1716
Water quality monitoring objectives should state the decision or estimate the measurements must support, the location and period represented, and the conditions under which the result is usable. "Monitor pollution" is too broad to determine sensor range, sampling frequency or acceptance. Write a measurable objective first, then select the observations, reference tests and response procedure needed to meet it.
Protecting a water source, improving treatment performance and investigating a discharge are legitimate purposes. They are not yet equipment specifications. The design changes when the required answer is a current operating value, a daily load, an event duration or evidence of a long-term trend.
Compare two requests. "Measure ammonia at the outlet" leaves timing and use unclear. "Record the outlet's ammonia-nitrogen trend across the production cycle and obtain paired reference samples during normal and high-load periods" identifies a more testable observation task. It still needs a defined method, range and data-quality criteria, but it gives the engineer a basis for selecting them.
The EPA Data Quality Objectives planning guidance links study questions with information needs, boundaries and performance criteria. Establish the applicable analytical methods and reporting requirements separately for the project.
| Purpose | A more usable objective | Evidence the plan needs |
|---|---|---|
| Treatment operation | Characterize a selected channel during identified operating states | Time-stamped readings, process-state records and suitable comparison tests |
| Pollutant-load assessment | Estimate mass passing a defined boundary over a defined period | Representative concentration and corresponding flow, with a suitable calculation method |
| Event investigation | Determine when a specified change starts and how long it persists | Adequate time coverage, valid-data flags and an investigation or sampling response |
| Restoration assessment | Compare defined ecological or chemical measures over comparable periods | Baseline, suitable comparison locations, seasonal context and consistent methods |
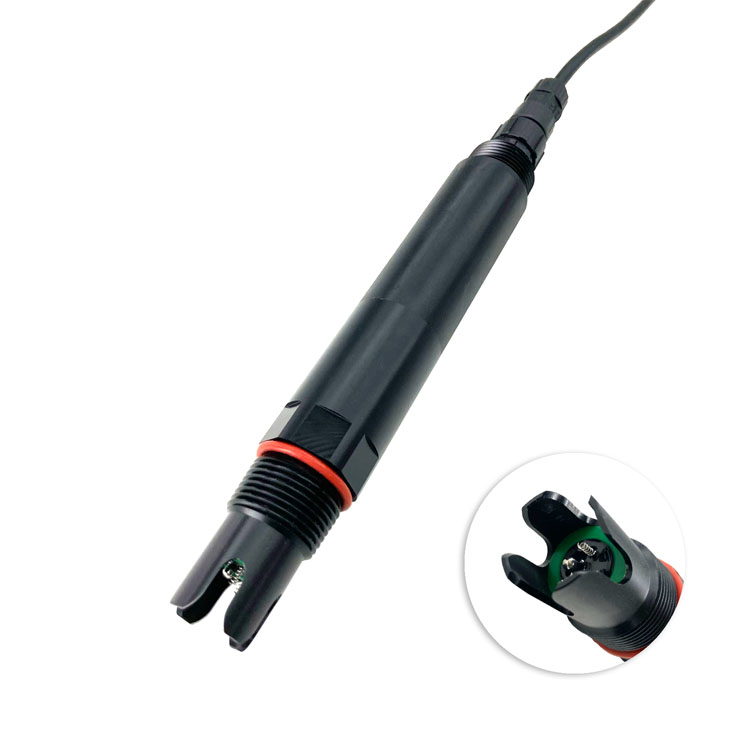
A disinfection-monitoring objective should identify the sampling point, required chlorine quantity and applicable operating criterion. Free chlorine, total chlorine and an HClO-based response are not interchangeable labels. A trend used to investigate dosing behavior is also different from a required microbiological determination.
For the NiuBoL NBL-WQ-CL, the listed range is 0-2.000 mg/L HClO and the matching flow cell requires 30-60 L/h. These conditions affect the sampling arrangement. Define how the field reference relates to HClO before using the channel against a differently defined chlorine criterion.
A useful commissioning demonstration would compare the configured channel with an appropriate reference while sample flow and pH are recorded. The acceptance limits must come from the selected method and project requirements. Do not replace them with a general chlorine concentration copied from another water supply.
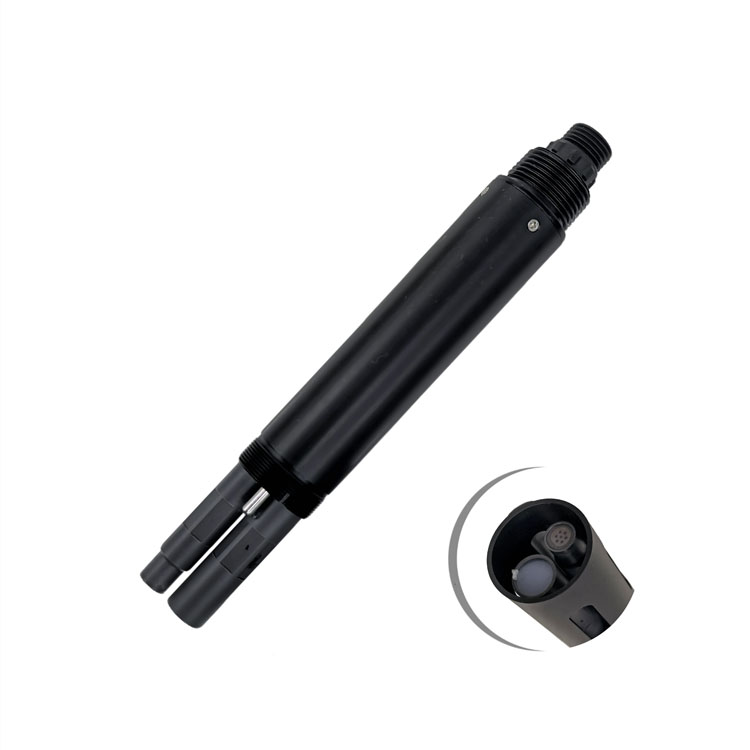
The online ammonia-nitrogen probe can contribute a concentration trend, subject to its ion-selective principle and water-matrix limitations. If the objective is total nitrogen removal, ammonia alone is not enough. If the objective is discharged ammonia-nitrogen mass, concentration alone is not enough either: corresponding flow is needed.
For a simplified steady-flow example, load in kg/day = concentration in mg/L x flow in m3/day / 1000. At 5 mg/L and 1000 m3/day, the calculated load is 5 kg/day. At 2 mg/L and 4000 m3/day, it is 8 kg/day. The lower concentration in the second example does not mean a lower mass discharge. These are arithmetic examples, not NiuBoL project results or discharge criteria.
For changing flow and concentration, use suitably aligned intervals and representative data rather than multiplying unrelated daily averages without examining the assumptions. Keep bypasses, recirculation and the chosen assessment boundary explicit. An apparent improvement caused by dilution is not the same as removal of pollutant mass.
| Objective distinction | What must be aligned | Potential mistake |
|---|---|---|
| Inlet versus outlet performance | Water residence time, flow boundary and sample fraction | Comparing water collected at the same clock time although it represents different process batches |
| Concentration trend versus mass load | Concentration and corresponding flow | Reporting lower concentration as lower load without flow information |
| Ammonia change versus total nitrogen change | Analyte fractions and required reference determinations | Treating one nitrogen species as the total |
A daily spot sample can answer a different question from a continuous oxygen record. Before selecting a recording interval, identify the event or cycle of interest and the time required to act. Include sensor response, sample-line transport, logger recording and remote transmission delay; changing the dashboard refresh rate does not shorten all of them.
For an oxygen objective in an aerated basin or pond, define where the observation should represent the managed water rather than the immediate aerator plume. The NBL-WQ-DO offers a 0-20 mg/L range, RS485 Modbus RTU and operation at 0-45 degrees C below 0.2 MPa. These limits help evaluate the instrument, but the project must still define acceptable delay and the operational response.
Separate an early warning from automatic control. A low-oxygen observation may prompt inspection or a predefined control action in a suitably engineered system. The probe itself does not provide a complete safety function. Agree who receives a warning and how unavailable or implausible data are handled.
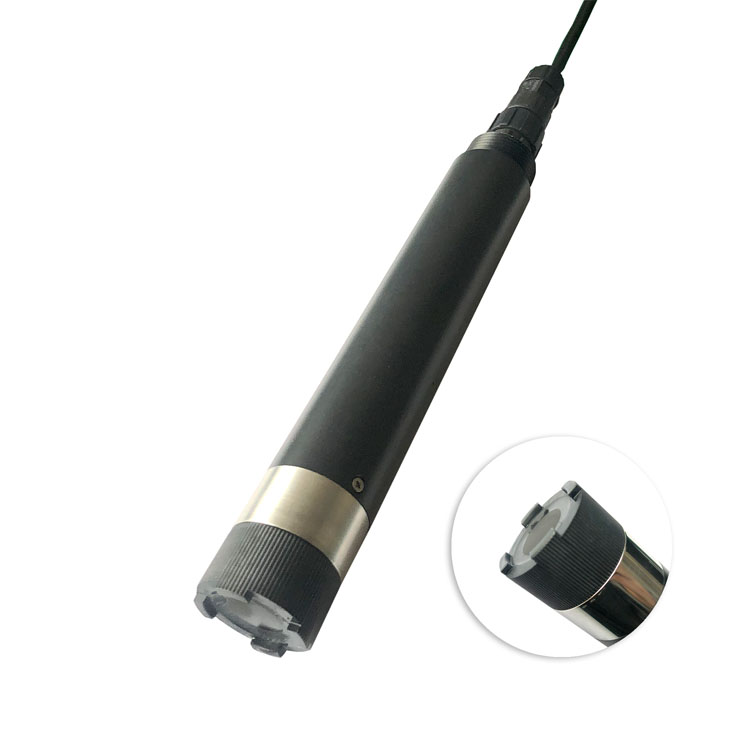
For a runoff investigation, identify a reference period and the part of the catchment or intake being observed. Rainfall, streamflow, construction activity and sample depth can affect interpretation. A single optical excursion may deserve a sampling visit without identifying the responsible pollutant.
A turbidity probe can record changes associated with particles. To investigate an excursion, retain the original trace, inspect for bubbles or deposits and obtain representative comparison information. Do not alter the baseline by adjusting the instrument before recording its as-found condition.
If source attribution is the objective, plan suitable upstream, downstream or tributary observations and relevant chemical tests. Account for travel time and mixing. An association between a downstream peak and nearby activity is a hypothesis to investigate, not proof of source identity.
A trend program needs consistency across seasons and maintenance events. Record changes in site position, depth, sensor model, range and method. Retain overlap comparisons where practicable when equipment changes; otherwise a step caused by replacement can be mistaken for environmental change.
For a transparency study, define whether the program uses a visual observation or an online optical transparency instrument. These observations can be related but should not be merged automatically. State how seasonal water color, particles and deployment depth affect the comparison.
Choose measurement requirements around the size of the change that matters. A display increment is not a complete uncertainty statement. Check range, error expression, drift and matrix effects near the decision level, then select a suitable comparison procedure.
Also specify data coverage: the duration and pattern of missing observations that would make a daily summary or event assessment unusable. Ten missing minutes during a short event can matter more than a longer gap during stable operation. Do not automatically label both datasets complete because their average uptime is similar.
Decide how false alarms and missed events will be evaluated during a trial. Set thresholds or persistence rules with the water process and measurement variability in mind. There is no universal number of consecutive readings suitable for every channel. Retain invalid-data flags and investigation outcomes so the trial can improve the rule without concealing failures.
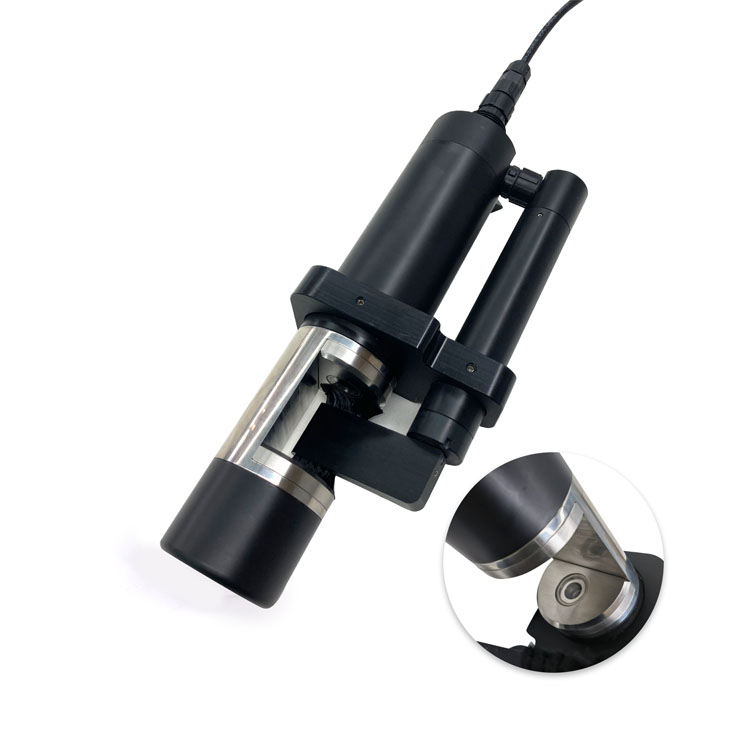
A NiuBoL multiparameter assembly can collect several colocated channels through RS485 Modbus RTU. It does not decide the study question, select regulatory tests or determine which alarms are meaningful. Fit channels that provide required information, and retain separate measurements where locations or analytical duties differ.
For a trial, compare candidate layouts using the same objectives. Ask whether the output supports the intended decision, whether checks can be performed safely and whether staffing can sustain cleaning and reference work. A package with more channels can still fail a simple requirement if its intake is unrepresentative or critical data are unavailable.
Send NiuBoL the decision statement, expected concentration range, water and site conditions, required time coverage and receiving-system details. Request a quotation that distinguishes sensing hardware, installation items, data acquisition and commissioning work. Include reference testing and service resources in the project budget rather than judging value only by the sensor purchase price.
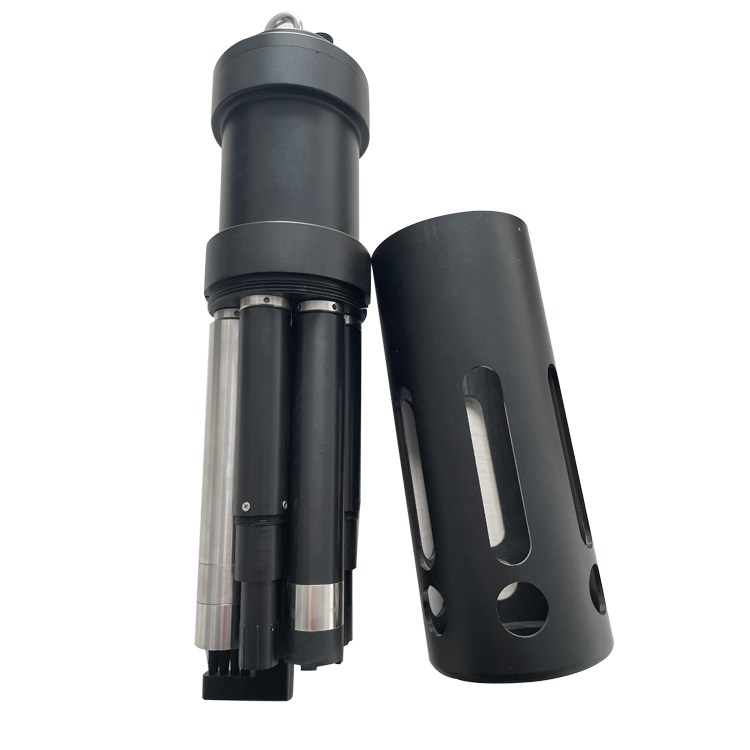
A parameter list names measurements. An objective explains what those measurements must establish, at what place and time, and how the result will be used. Without that context, channel count cannot determine whether the installation is adequate.
Not by itself. Flow, dilution, assessment boundaries and the timing of inlet and outlet observations matter. Use an appropriate mass-balance approach where the objective concerns pollutant load or removal.
The change or operating cycle that must be resolved, together with instrument response and sample transport. Assess the complete time path and available storage. A fast server refresh does not create faster measurements.
Review instrument validity, site variability and the intended response before changing the threshold. Evaluate confirmed events and missed events as well as false alarms. Document any revised rule and retest it against the objective.
Only the relevant measurement duties can be considered, subject to the applicable program and method acceptance. Online physicochemical channels do not automatically supply microbiological, metals or total-nutrient determinations. Retain necessary reference and analyte-specific testing.
Provide a representative trial record, agreed reference comparisons, documented data gaps and a demonstration of the required response or reporting output. A powered instrument and a populated dashboard establish installation, not necessarily fitness for the decision.
Useful water quality monitoring objectives connect a question to observations that can answer it. Define the place, time, measured fraction and required quality before choosing equipment. Verify the intended decision with a representative trial, then specify the NiuBoL configuration and supporting work needed to sustain it.
Prev:Water Quality Monitoring Methods: Match Sensors, Samples and Surveys
Next:Multi-Parameter Water Quality Sensors: Modules, Shared Services and Limits
Related recommendations
Sensors & Weather Stations Catalog
 Agriculture Sensors and Weather Stations Catalog-NiuBoL.pdf
Weather Stations Catalog-NiuBoL.pdf
Agriculture Sensors Catalog-NiuBoL.pdf
Water Quality Sensor Catalog-NiuBoL.pdf
Related products
 Combined air temperature and relative humidity sensor
 TDR Soil Moisture & Temperature Sensor for irrigation| RS485 |4-20mA| NBL-S-THR
 Soil pH sensor RS485 soil Testing instrument soil ph meter for agriculture |NBL-S-PH
 Wind Speed sensor Output Modbus/RS485/Analog/0-5V/4-20mA
 Tipping bucket rain gauge for weather monitoring auto rainfall sensor RS485/Outdoor/stainless steel
 Pyranometer Solar Radiation Sensor 4-20mA/RS485


Screenshot, WhatsApp to identify the QR code
WhatsApp number:+8615367865107
(Click on WhatsApp to copy and add friends)

