

— Blogs —
—Products—
 Consumer hotline +8618073152920
 WhatsApp:+8615367865107
Address:Room 102, District D, Houhu Industrial Park, Yuelu District, Changsha City, Hunan Province, China
Product knowledge
Time:2025-09-20 15:14:38 Popularity:700
Water quality monitoring is a critical tool for assessing water body health, identifying pollution sources, and guiding environmental management. With the increasing severity of water pollution and advancements in monitoring technology, China's water quality monitoring methods have expanded from traditional physicochemical approaches to include biological monitoring and remote sensing, forming a multi-level, multi-dimensional monitoring system. These methods measure physical, chemical, and biological indicators to reveal the types, concentrations, and distribution patterns of pollutants, providing a scientific basis for environmental protection, public health, and water resource management. This article elaborates on the main water quality monitoring methods—traditional physicochemical monitoring, biological monitoring, and remote sensing—analyzing their principles, applications, advantages, and disadvantages, and exploring future trends.
Water quality monitoring methods can be classified into three main categories based on their technical principles:
1. Physicochemical Monitoring: Quantitatively measures physical parameters (e.g., turbidity, conductivity) and chemical components (e.g., heavy metals, organic matter) through physical and chemical analysis.
2. Biological Monitoring: Assesses water body ecological health and pollution levels using the responses of aquatic organisms.
3. Remote Sensing Monitoring: Uses satellite or drone imagery to derive water quality parameters through spectral analysis, suitable for large-scale dynamic monitoring.
Each method has unique advantages and is applicable to different scenarios, such as surface water, groundwater, industrial wastewater, domestic sewage, and emergency pollution event monitoring.
Physicochemical monitoring is the cornerstone of water quality monitoring, relying on physical measurements and chemical analysis. It is widely used for surface water, groundwater, and wastewater monitoring, characterized by high accuracy and standardization but with relatively complex equipment and operations.
Physical monitoring measures the physical properties of water, with relatively simple instrumentation and rapid data acquisition. Common physical parameters and instruments include:
- Turbidity: Reflects the concentration of suspended particles, affecting water transparency and disinfection efficiency. Measured using a turbidimeter (based on light scattering), with units in NTU.
- Color: Indicates water color, typically caused by organic matter or metal ions. Measured with a filter photometer, expressed in PCU (platinum-cobalt units).
- Conductivity: Reflects ion concentration, indirectly indicating total dissolved solids (TDS). Measured with a conductivity meter, expressed in μS/cm.
- Temperature: Influences chemical reaction rates and biological activity, measured with temperature sensors.
- Multi-Parameter Monitors: Integrate measurements of turbidity, color, conductivity, pH, etc., for synchronized data collection and improved efficiency.
Applications: Drinking water monitoring, wastewater treatment plant influent/effluent assessment, and river/lake monitoring.
Chemical monitoring is a key focus in surface water monitoring, covering inorganic substances, organic compounds, and heavy metals. With growing emphasis on toxic organic pollutants and heavy metals, chemical monitoring technologies have advanced significantly. Common methods include:
- Chemical Methods:
- Gravimetric Method: Measures specific substances (e.g., suspended solids) through precipitation, filtration, and weighing.
- Volumetric Titration: Determines concentrations via titration reactions (e.g., for COD, ammonia nitrogen).
- Spectrophotometry: Measures COD, total phosphorus, ammonia nitrogen, etc., based on light absorption at specific wavelengths.
- Electrochemical Methods:
- Ion-Selective Electrode Method: Uses ion-specific electrodes to qualitatively and quantitatively measure ammonia nitrogen, fluoride, etc., ideal for simple, on-site monitoring.
- Conductivity Method: Measures ion conductivity to indirectly assess salinity or TDS.
- Atomic Absorption Spectrophotometry (AAS): High-precision measurement of heavy metals (e.g., Zn, Fe, Pb, Cd, Hg, Mn), widely used in laboratory analysis.
- Ion Chromatography: Separates and detects anions (e.g., nitrate, sulfate) and cations, suitable for complex water samples.
- Gas Chromatography (GC): Measures volatile organic compounds (e.g., benzene derivatives, halogenated hydrocarbons), commonly used for industrial wastewater.
- Inductively Coupled Plasma Atomic Emission Spectroscopy (ICP-AES): Simultaneously measures multiple heavy metals and elements with high sensitivity, ideal for trace analysis.
Applications: Monitoring heavy metals (Zn, Pb, Cd, Hg), ammonia nitrogen, nitrite nitrogen, cyanide, phenols, anionic surfactants, etc., in drinking water sources, industrial wastewater, and wastewater treatment plants.
- High accuracy (e.g., AAS detection limits reach μg/L levels).
- Standardized methods compliant with national standards (e.g., Surface Water Environmental Quality Standard GB 3838-2002).
- Broad applicability across various pollutants.
- Expensive equipment and time-consuming laboratory analysis.
- Some methods require chemical reagents, potentially causing secondary pollution.
- Limited on-site monitoring capabilities, requiring portable instruments.
Biological monitoring assesses water body ecological health and pollution levels using the responses of aquatic organisms. It is characterized by sensitivity, bioaccumulation, long-term effects, and comprehensiveness, capturing combined pollution effects that chemical monitoring may miss. It is ideal for long-term ecological assessments.
- Biological Index Method: Calculates pollution indices based on the abundance and diversity of specific organisms (e.g., benthic animals) to reflect water quality.
- Species Diversity Index Method: Assesses ecological health using biological community diversity (e.g., Shannon Index).
- Microbial Community Monitoring: Analyzes the types and abundance of microorganisms (e.g., bacteria, algae) to indicate pollution levels.
- Bio-toxicity Testing: Uses fish, algae, or luminescent bacteria to test water toxicity and assess pollutant impacts on organisms.
- Bioaccumulation Measurement: Detects pollutant accumulation (e.g., heavy metals, organic compounds) in aquatic organisms, reflecting long-term pollution.
- Ecological Detoxification Method: Evaluates water body self-purification capacity through biological metabolism (e.g., plant uptake).
- Single-Celled Algae: E.g., diatoms, sensitive to nutrients and heavy metals, indicating eutrophication.
- Protozoa: E.g., ciliates, responsive to organic pollution and toxic substances.
- Benthic Organisms: E.g., aquatic insects, mollusks, reflecting long-term water pollution.
- Fish and Amphibians: Indicate water toxicity and ecological health.
Applications: Ecological monitoring of rivers and lakes, toxicity assessment of wastewater treatment plant effluents, and pollution source tracking.
- Comprehensive, reflecting ecological impacts of pollution.
- Highly sensitive to trace pollutants undetectable by chemical methods.
- Suitable for long-term dynamic monitoring.
- Complex data interpretation requiring professional biological expertise.
- Longer monitoring cycles with poor real-time performance.
- Susceptible to environmental factors (e.g., temperature, seasonality).
Remote sensing monitoring uses satellite, drone, or aerial imagery to derive water quality parameters through spectral analysis, suitable for large-scale water body monitoring. Its principle relies on the absorption or scattering properties of pollutants at specific wavelengths (visible, near-infrared, ultraviolet).
- Spectral Feature Analysis: Different water quality parameters (e.g., turbidity, chlorophyll-a, COD) exhibit unique spectral responses at specific wavelengths (e.g., 550 nm, 680 nm).
- Inversion Algorithms: Establish relationships between remote sensing spectral data and ground-measured water quality parameters using empirical models, statistical analysis, or machine learning.
- Data Processing: Combine satellite imagery (e.g., Landsat, MODIS) with synchronized ground monitoring data to calculate the spatial-temporal distribution of water quality parameters.
- Turbidity: Derived from scattered light intensity.
- Chlorophyll-a: Reflects algal concentration, indicating eutrophication.
- COD and Dissolved Organic Matter: Based on UV-visible light absorption.
- Water Color and Suspended Solids: Analyzed using visible light bands.
Applications: Pollution distribution monitoring in lakes, rivers, and coastal waters, pollution source tracking, and algal bloom warnings.
- Wide coverage, suitable for large-scale water body monitoring.
- Fast, enabling near-real-time monitoring.
- Cost-effective for long-term dynamic monitoring.
- Detects pollution sources and migration patterns difficult to identify with conventional methods.
- Accuracy affected by cloud cover, water depth, and vegetation.
- Requires ground-measured data for calibration and depends on the accuracy of inversion models.
- Limited ability to directly measure deep water quality or certain chemical parameters (e.g., heavy metals).
| Method | Applicable Scenarios | Advantages | Disadvantages |
| Physicochemical Monitoring | Drinking water, wastewater, surface water | High accuracy, standardized, wide applicability | Expensive equipment, time-consuming, potential secondary pollution |
| Biological Monitoring | Ecological health, long-term pollution | Comprehensive, high sensitivity | Complex interpretation, poor real-time performance |
| Remote Sensing Monitoring | Large-scale water bodies, pollution distribution | Wide coverage, fast, low cost | Limited accuracy, requires ground calibration |
- Monitoring Objectives: Drinking water safety requires precise chemical monitoring, ecological assessments need biological monitoring, and large-scale pollution distribution requires remote sensing.
- Water Body Type: Surface water is suitable for physicochemical and remote sensing monitoring; groundwater requires chemical analysis.
- Time Requirements: Real-time monitoring favors online sensors, while long-term trend analysis suits biological monitoring.
- Budget and Resources: Remote sensing is cost-effective for large-scale applications; chemical monitoring offers high accuracy for laboratory analysis.
1. Multi-Parameter Integration: Develop sensors integrating pH, COD, dissolved oxygen, and other parameters to reduce equipment costs and operational complexity.
2. Smart Technology: Combine AI and big data analytics to optimize data processing and pollution prediction models.
3. Green Technology: Promote reagent-free monitoring methods (e.g., UV-based COD sensors) to reduce chemical reagent use and secondary pollution.
4. IoT Integration: Use online sensors and cloud platforms for real-time data transmission and grid-based monitoring.
5. Remote Sensing Advancements: Leverage high-resolution satellites (e.g., Gaofen series) and drones to improve monitoring accuracy and coverage.
6. Biological Monitoring Innovation: Develop molecular biology-based methods (e.g., DNA barcoding) to enhance sensitivity and specificity.
Water quality monitoring methods encompass physicochemical monitoring, biological monitoring, and remote sensing, each with distinct characteristics and complementary roles. Physicochemical monitoring provides high accuracy and standardization for drinking water and wastewater; biological monitoring reflects ecological impacts, suitable for long-term assessments; and remote sensing offers wide coverage for large-scale dynamic monitoring. By selecting appropriate methods and integrating IoT, AI, and green technologies, water quality monitoring can significantly improve efficiency and reliability, providing robust support for water environment protection, pollution management, and public health.
Prev:Significance of Water Quality Monitoring
Next:Testing Purposes and Objectives of Water Quality Monitoring
Related recommendations
Sensors & Weather Stations Catalog
Agriculture Sensors and Weather Stations Catalog-NiuBoL.pdf
Weather Stations Catalog-NiuBoL.pdf
Related products
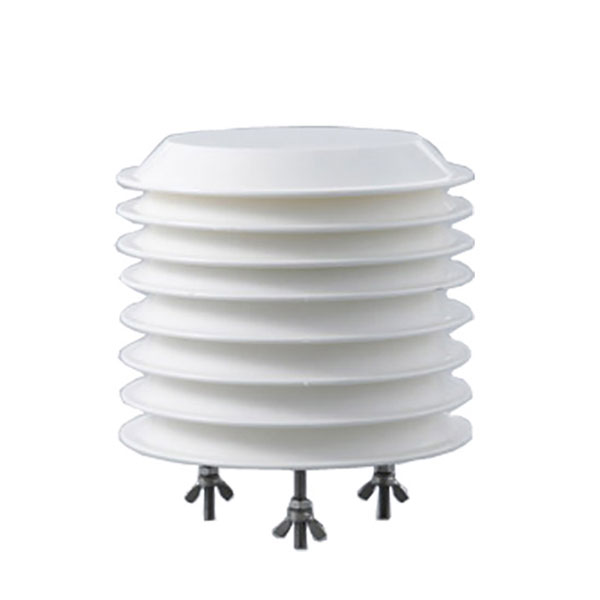 Combined air temperature and relative humidity sensor
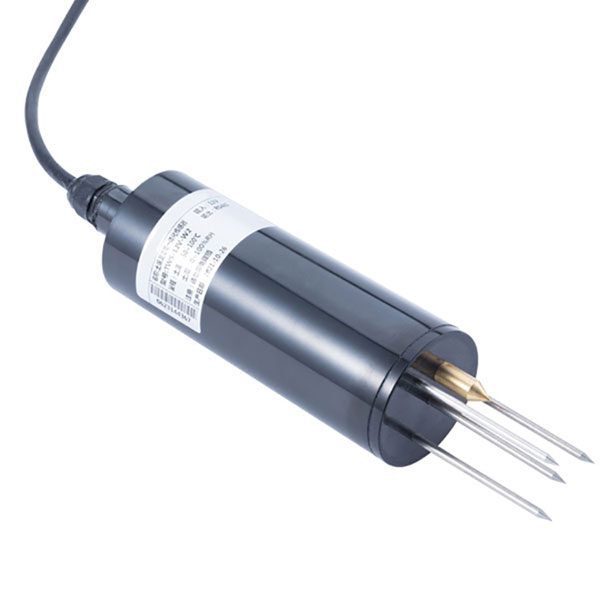 Soil Moisture Temperature sensor for irrigation
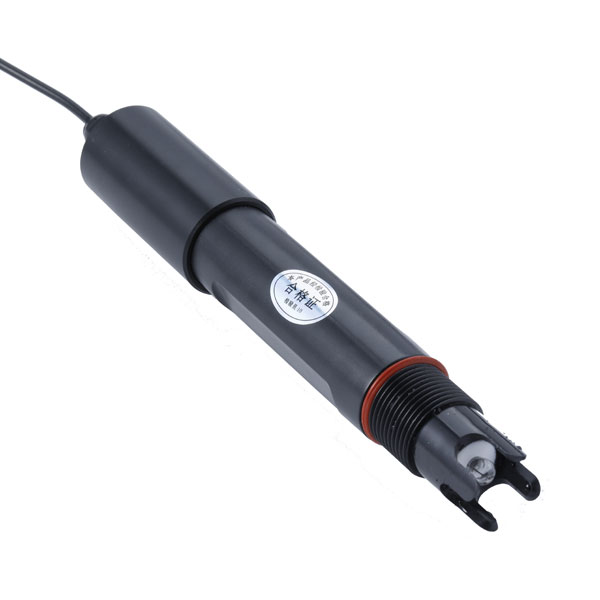 Soil pH sensor RS485 soil Testing instrument soil ph meter for agriculture
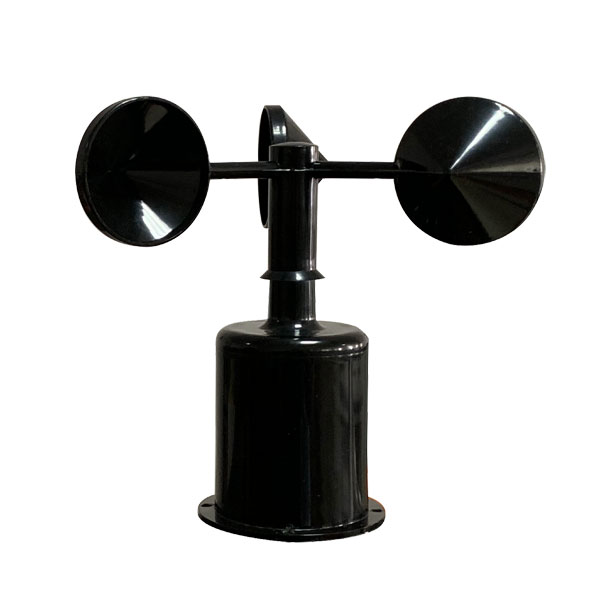 Wind Speed sensor Output Modbus/RS485/Analog/0-5V/4-20mA
 Tipping bucket rain gauge for weather monitoring auto rainfall sensor RS485/Outdoor/stainless steel
 Pyranometer Solar Radiation Sensor 4-20mA/RS485
Screenshot, WhatsApp to identify the QR code
WhatsApp number:+8615367865107
(Click on WhatsApp to copy and add friends)
