





— Blogs —
—Products—
 Consumer hotline +8618073152920
WhatsApp:+8615367865107
Address:Room 102, District D, Houhu Industrial Park, Yuelu District, Changsha City, Hunan Province, China
Product knowledge
Time:2025-09-20 15:08:00 Popularity:1203
Why water quality monitoring matters comes down to evidence: when a source changed, whether a treatment response was timely, what conditions preceded an oxygen problem and whether a claimed improvement persists. Measurements help answer those questions. They do not remove pollutants, identify every contaminant or guarantee that someone will act on an alarm.
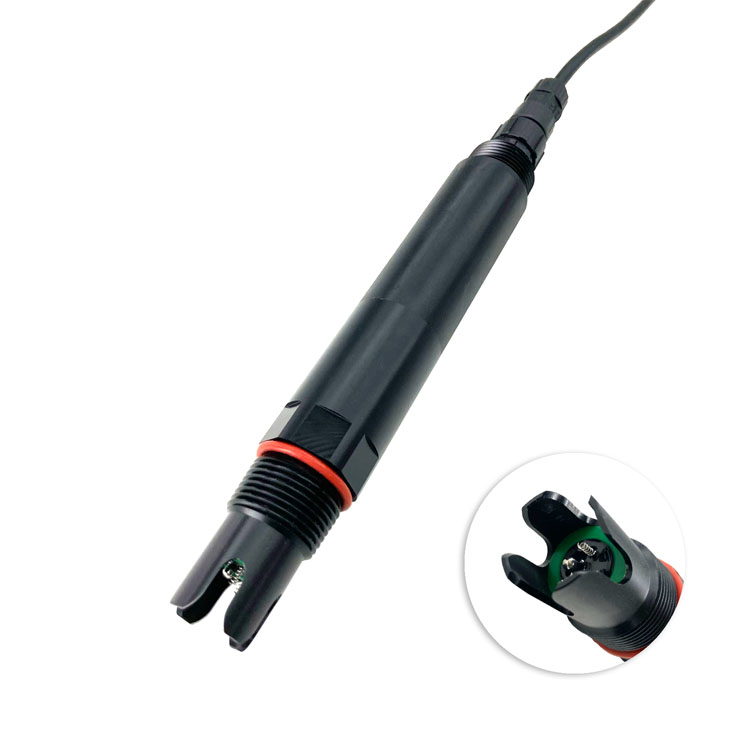
A sample collected after a process upset may no longer describe the water that triggered it. A maintained online record can show the onset, duration and recovery of a measured change. That history helps operators select follow-up samples and compare the event with dosing, pumping, rainfall or production records.
In a water-supply investigation, a chlorine trend can support review of disinfection conditions. The measured chlorine quantity still matters: the NiuBoL NBL-WQ-CL reports an HClO-based response in its defined flow-cell arrangement. It must not be treated as a universal test for chemical or microbial safety.
The practical benefit is a better-timed investigation, not automatic proof of the cause. A valid record should retain measurement time, units and periods when the instrument was being cleaned or was unavailable. An uninterrupted line drawn through missing data can hide the event information the project was intended to capture.
For wastewater treatment, measurements can help distinguish a persistent operating condition from a short disturbance. Comparing ammonia-nitrogen observations with process timing may identify periods that deserve laboratory checks or operational review. The online ammonia-nitrogen probe addresses a defined nitrogen fraction; it does not independently describe total nitrogen removal.
An inlet and outlet comparison also needs corresponding water and flow information. Treatment residence time, recirculation and dilution can change the interpretation. A concentration decrease alone should not be presented as proof of mass removal. Monitoring adds value when these records allow an operator to test an explanation rather than simply associate two curves.
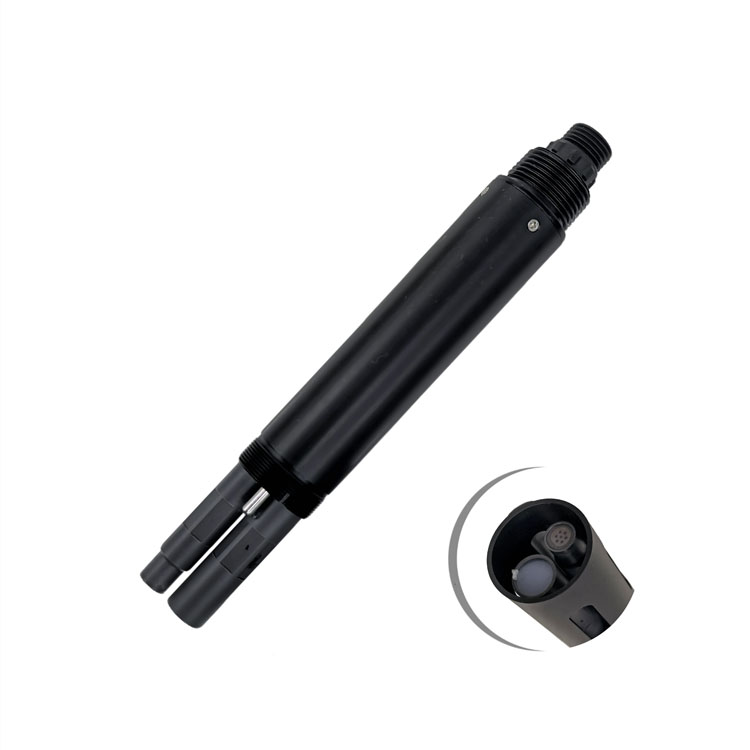
Oxygen conditions can vary over a daily cycle as biological activity, mixing and aeration change. A satisfactory reading during a site visit does not establish that the same conditions persisted overnight. A time series can help identify recurring low periods and whether the installed observation point represents the managed water.
The NBL-WQ-DO optical sensor measures dissolved oxygen locally. Its measurement does not replace checks at other depths or locations where stratification or poor circulation is suspected. Suitable operating targets depend on the species, treatment process and water conditions rather than one number applied to all sites.
A warning becomes operationally useful only when the response is assigned. Establish who checks the reading, what independent observation is available and what happens if communications or power fail. Any automatic aeration function requires appropriate control equipment and logic beyond the sensing probe.
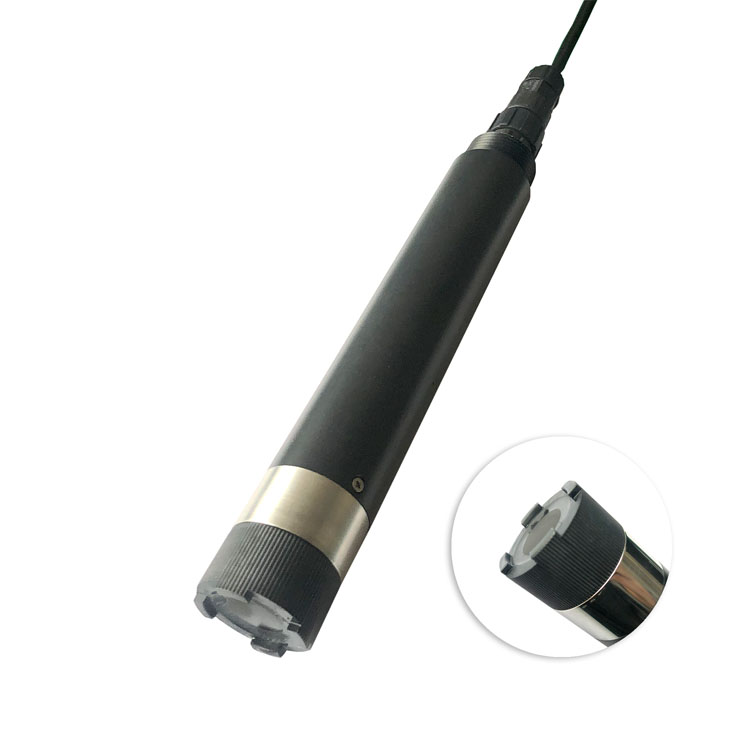
River and intake monitoring can reveal changes associated with runoff or sediment disturbance. Turbidity is one useful optical observation, but it does not identify the source or chemistry of every particle. A turbidity probe affected by bubbles or a dirty window can also produce an apparent event.
Keep the original trace and the as-found condition before service. Compare relevant field observations or samples, then record the result after cleaning. This gives the project evidence for deciding whether an excursion represented the water, the installation or the instrument. Recalibrating first can erase information needed to make that distinction.
| Claim to examine | Useful monitoring evidence | What must not be assumed |
|---|---|---|
| A treatment adjustment improved performance | Comparable before-and-after records with loading, flow and reference checks | That a change caused every difference when production or water source also changed |
| A river condition improved | Consistent methods, seasonal context and suitable comparison locations | That one clear-water visit proves a sustained ecological recovery |
| An alarm provided useful warning | Measurement time, notification time, investigation record and action taken | That a configured alarm guarantees detection or response |
| A station is producing usable data | Reference checks, valid-data coverage and documented maintenance states | That a visible reading alone proves measurement quality |
For a water-clarity project, a transparency instrument can provide a repeatable local observation under its optical method. Keep the method and deployment position consistent when evaluating change. Water clarity alone does not establish nutrient status, absence of pathogens or the cause of an ecological response.
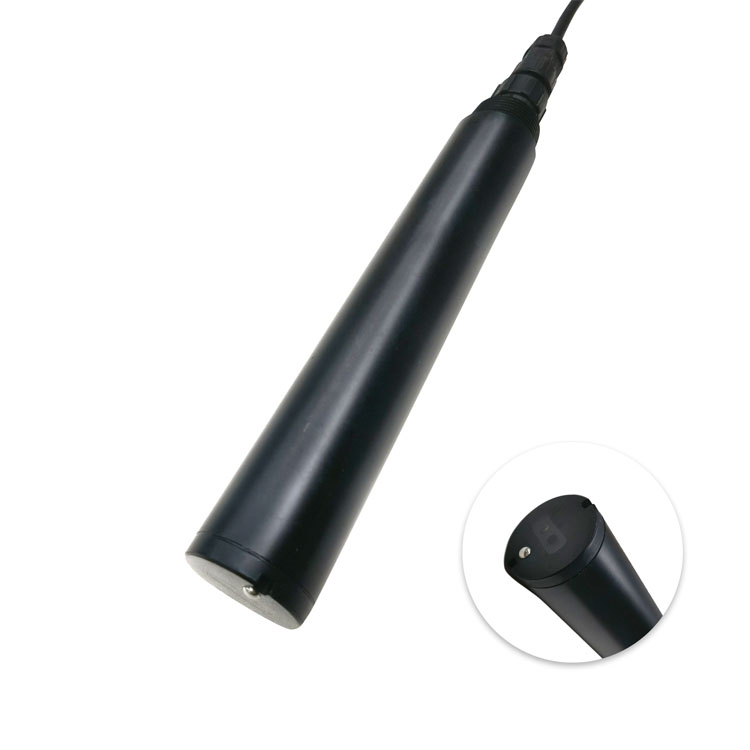
Long-term research and management need records that remain interpretable after the original operator has left. Store instrument identification, units, location, depth, maintenance changes and reference results alongside the measurements. A sensor replacement or relocated intake may introduce a step that should not be mistaken for a new environmental trend.
Preserve the difference between online observations and laboratory determinations. Studies of metals, emerging contaminants, sediments or biological communities need their appropriate methods; a normal group of routine sensor readings does not establish that those questions have been answered. The value of a long record depends on knowing what was measured as well as what was not.
A station can be expensive to maintain even when the initial instrument price is modest. Include safe access, cleaning, consumables, reference work, communications and staff time when evaluating whether a monitoring arrangement can be sustained. A neglected channel adds numbers without necessarily adding evidence.
For a small trial, measure concrete outputs: usable observations during the required periods, unresolved data gaps, time to investigate an event and the work needed for service. These are more defensible indicators of project value than an unsupported percentage saving attributed to the sensor purchase.
EPA online monitoring resources discuss observation systems together with operational and incident-response uses. Monitoring is one part of that work. Sampling, interpretation, treatment and response responsibilities remain necessary.
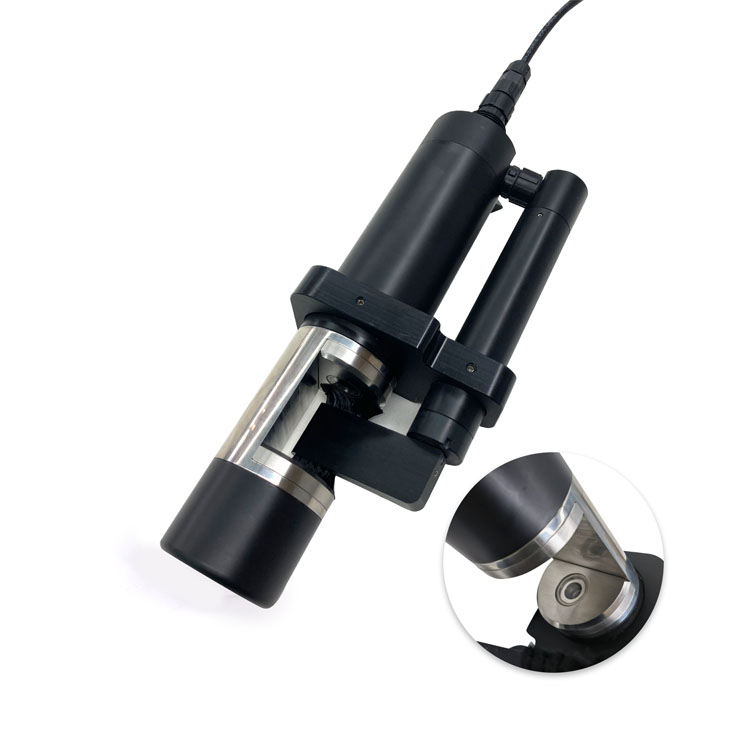
A NiuBoL multiparameter assembly can provide selected colocated measurements through RS485 Modbus RTU to compatible acquisition equipment. Separate probes can suit different locations or hydraulic duties. The configuration should follow the information needed, not an assumption that every available channel improves the project.
When enquiring, describe the operating problem, observation locations, water conditions and what result will change a decision. Include the receiving PLC, RTU or data logger and the service resources available. This gives the equipment discussion a practical basis without claiming that the instrument alone delivers compliance, source attribution or pollution prevention.
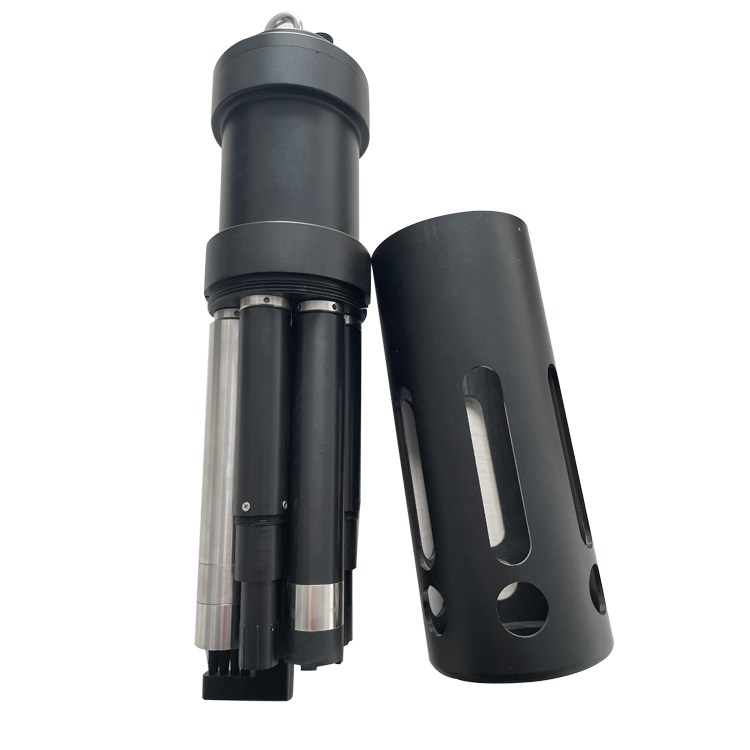
It can show the timing and duration of measured changes between visits and help target further samples. Periodic laboratory work remains necessary for constituents or reference determinations outside the installed channels.
The station can supply observations that support detection and response within its measurement coverage. Prevention and mitigation depend on source controls, investigation and effective operational action. An alarm setting alone does not guarantee those outcomes.
No. It shows only the fitted measurements at their observation points, subject to data validity. Safety assessment needs the relevant chemical and microbiological testing and the applicable management program.
Check whether it produces valid information during the required periods, supports the intended investigation or operating decision and can be maintained with available resources. Record those results rather than assigning an assumed financial return.
Consistent methods and locations, suitable reference checks and visible records of missing data, service and configuration changes. The record should allow another engineer to distinguish environmental variation from changes in the measurement system.
Why water quality monitoring matters is the evidence it adds to operations, investigations and long-term assessment. Useful records reveal changes and test explanations without overstating what the sensors can establish. Select a maintainable NiuBoL configuration and connect the observations to a defined response or evaluation task.
Prev:Knowledge of Surface Water Quality Monitoring
Next:Water Quality Monitoring Methods: Match Sensors, Samples and Surveys
Related recommendations
Sensors & Weather Stations Catalog
 Agriculture Sensors and Weather Stations Catalog-NiuBoL.pdf
Weather Stations Catalog-NiuBoL.pdf
Agriculture Sensors Catalog-NiuBoL.pdf
Water Quality Sensor Catalog-NiuBoL.pdf
Related products
 Combined air temperature and relative humidity sensor
 TDR Soil Moisture & Temperature Sensor for irrigation| RS485 |4-20mA| NBL-S-THR
 Soil pH sensor RS485 soil Testing instrument soil ph meter for agriculture |NBL-S-PH
 Wind Speed sensor Output Modbus/RS485/Analog/0-5V/4-20mA
 Tipping bucket rain gauge for weather monitoring auto rainfall sensor RS485/Outdoor/stainless steel
 Pyranometer Solar Radiation Sensor 4-20mA/RS485


Screenshot, WhatsApp to identify the QR code
WhatsApp number:+8615367865107
(Click on WhatsApp to copy and add friends)

